The Southern Company (SO) and Pacific Gas & Electric Co. (PCG) are two major players in the regulated electric utilities sector, each serving millions of customers with a mix of traditional and renewable energy sources. Both companies are navigating the energy transition with innovative strategies in power generation and grid modernization. This comparison will help you identify which utility stock offers the most compelling investment opportunity in today’s evolving energy landscape.

Table of contents
Companies Overview
I will begin the comparison between The Southern Company and Pacific Gas & Electric Co. by providing an overview of these two companies and their main differences.
The Southern Company Overview
The Southern Company operates in the regulated electric industry, focusing on electricity generation, transmission, and distribution. It serves approximately 8.7M electric and gas utility customers across several states. The company manages a diverse portfolio including renewable energy projects and extensive natural gas pipeline infrastructure, emphasizing a broad energy mix and regional coverage primarily in the southeastern US.
Pacific Gas & Electric Co. Overview
Pacific Gas & Electric Co. is a regulated electric utility serving northern and central California, providing electricity and natural gas to residential, commercial, industrial, and agricultural customers. Its energy generation sources include nuclear, hydroelectric, fossil fuels, and solar. The company also innovates with smart grid technologies, integrating backup power systems with existing electric meters to enhance customer energy management.
Key similarities and differences
Both companies operate in the regulated electric sector and provide electricity and natural gas services, focusing on regional markets within the US. They utilize a mix of energy sources, including renewables and fossil fuels. However, Southern Company has a wider geographic footprint in the southeast and a larger customer base, while Pacific Gas & Electric concentrates on California with an emphasis on smart grid technology integration. Their market caps and dividend policies also differ, reflecting varied scale and financial strategies.
Income Statement Comparison
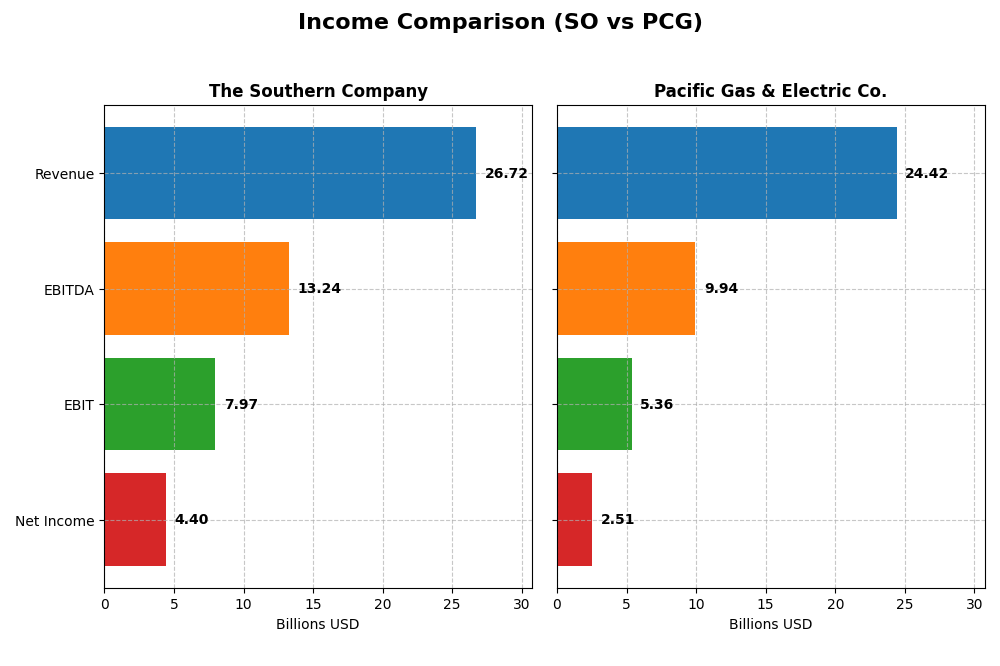
This table presents a side-by-side comparison of the key income statement metrics for The Southern Company and Pacific Gas & Electric Co. for the fiscal year 2024.
| Metric | The Southern Company (SO) | Pacific Gas & Electric Co. (PCG) |
|---|---|---|
| Market Cap | 95.7B | 34.8B |
| Revenue | 26.7B | 24.4B |
| EBITDA | 13.2B | 9.94B |
| EBIT | 7.97B | 5.36B |
| Net Income | 4.40B | 2.51B |
| EPS | 4.02 | 1.16 |
| Fiscal Year | 2024 | 2024 |
Income Statement Interpretations
The Southern Company
The Southern Company’s revenue grew steadily from 20.4B in 2020 to 26.7B in 2024, with net income rising from 3.1B to 4.4B. Gross and EBIT margins remained strong at nearly 50% and 30%, respectively, indicating stable profitability. The 2024 fiscal year saw moderate revenue growth of 5.8%, improved gross profit by 14%, and a favorable EBIT increase of 17%, confirming solid operational progress.
Pacific Gas & Electric Co.
Pacific Gas & Electric’s revenue increased from 18.5B in 2020 to 24.4B in 2024, though 2024 revenue was essentially flat versus 2023. Net income surged from a loss of -1.3B in 2020 to 2.5B in 2024, supported by a significant improvement in gross profit and EBIT margins to 37.5% and 22%. The latest year showed a sharp 129% gross profit rise and a 51% EBIT gain, reflecting strong margin recovery despite stagnant sales.
Which one has the stronger fundamentals?
Both companies show favorable income statement trends, but Pacific Gas & Electric’s extraordinary growth in net income (up 293% over five years) and margin expansion stand out, despite some unfavorable revenue dynamics. The Southern Company maintains higher absolute margins and consistent revenue growth with moderate net income gains. PG&E’s higher volatility and rapid improvement contrast with Southern’s steadier performance, highlighting differing risk and growth profiles.
Financial Ratios Comparison
This table presents the key financial ratios for The Southern Company (SO) and Pacific Gas & Electric Co. (PCG) for the fiscal year 2024, providing a clear side-by-side comparison.
| Ratios | The Southern Company (SO) | Pacific Gas & Electric Co. (PCG) |
|---|---|---|
| ROE | 13.25% | 8.33% |
| ROIC | 4.25% | 3.98% |
| P/E | 20.5 | 17.2 |
| P/B | 2.72 | 1.43 |
| Current Ratio | 0.67 | 1.05 |
| Quick Ratio | 0.46 | 1.00 |
| D/E (Debt-to-Equity) | 2.00 | 1.94 |
| Debt-to-Assets | 45.7% | 43.7% |
| Interest Coverage | 2.58 | 1.46 |
| Asset Turnover | 0.18 | 0.18 |
| Fixed Asset Turnover | 0.25 | 0.28 |
| Payout Ratio | 67.1% | 3.42% |
| Dividend Yield | 3.27% | 0.20% |
Interpretation of the Ratios
The Southern Company
The Southern Company shows a mixed ratio profile with strong net margin (16.47%, favorable) and dividend yield (3.27%, favorable), but weak liquidity (current ratio 0.67, unfavorable) and asset turnover (0.18, unfavorable). Its return on equity (13.25%) is neutral, while return on invested capital (4.25%) is unfavorable. The company pays consistent dividends supported by a reasonable payout ratio, but free cash flow coverage is a concern due to negative free cash flow to equity.
Pacific Gas & Electric Co.
Pacific Gas & Electric Co. has a favorable net margin (10.29%) and valuation multiples such as price-to-book (1.43, favorable), but weaker profitability with return on equity (8.33%, unfavorable) and return on invested capital (3.98%, unfavorable). Liquidity ratios are better, with a current ratio of 1.05 (neutral) and quick ratio of 1.0 (favorable). The dividend yield is low at 0.2%, reflecting cautious shareholder returns amid ongoing financial challenges.
Which one has the best ratios?
Both companies face challenges, with slightly unfavorable overall ratios. The Southern Company benefits from stronger profitability and dividend yield but struggles with liquidity and efficiency. Pacific Gas & Electric shows better liquidity and valuation metrics but weaker profitability and dividend returns. Neither stands out clearly; each presents trade-offs in financial health and shareholder remuneration.
Strategic Positioning
This section compares the strategic positioning of The Southern Company and Pacific Gas & Electric Co., including market position, key segments, and exposure to technological disruption:
The Southern Company
- Large market cap of 95.7B in regulated electric utilities with moderate competitive pressure.
- Diverse segments: gas distribution, pipeline investments, power generation including renewables and storage.
- Operates multiple generation types including hydro, fossil, nuclear, solar, wind, and battery storage.
Pacific Gas & Electric Co.
- Smaller market cap of 34.8B in regulated electric utilities with moderate competitive pressure.
- Focused on electricity and natural gas in northern and central California with integrated smart grid technology.
- Uses nuclear, hydroelectric, fossil fuel, photovoltaic sources, and develops personal microgrid backup devices.
The Southern Company vs Pacific Gas & Electric Co. Positioning
The Southern Company pursues a diversified strategy across electric and gas utilities, renewable assets, and energy storage, while Pacific Gas & Electric Co. concentrates on electricity and natural gas with smart grid innovations. Diversification offers broader business drivers, concentration may enhance operational focus.
Which has the best competitive advantage?
Both companies are shedding value with ROIC below WACC but show growing profitability trends. Their economic moats are rated slightly unfavorable, indicating challenges in sustaining competitive advantages despite improving returns.
Stock Comparison
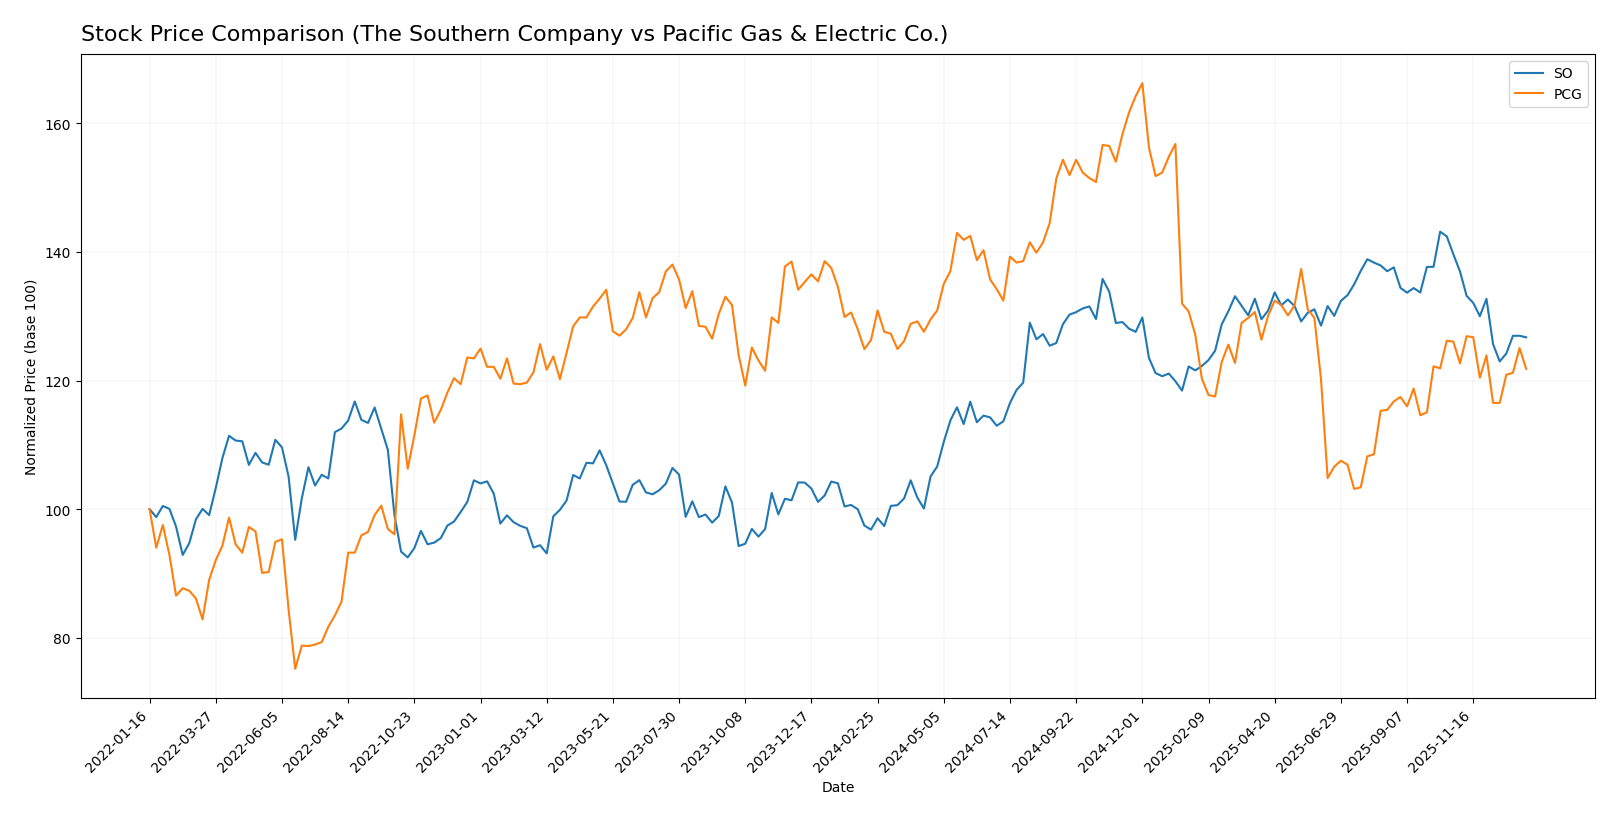
The stock prices of The Southern Company and Pacific Gas & Electric Co. have exhibited distinct movements over the past 12 months, with SO showing a strong bullish trend despite recent deceleration, while PCG has faced a consistent bearish trend with mild deceleration.
Trend Analysis
The Southern Company (SO) recorded a 30.88% price increase over the past year, indicating a bullish trend with decelerating momentum. The stock ranged between 66.48 and 98.29, showing moderate volatility (std deviation 7.54).
Pacific Gas & Electric Co. (PCG) experienced a -3.53% price decrease over the same period, reflecting a bearish trend with deceleration. The price oscillated between 13.42 and 21.63, with lower volatility (std deviation 1.93).
Comparing both, SO delivered the highest market performance with a significant positive gain, while PCG showed a modest decline, confirming SO’s stronger bullish momentum.
Target Prices
Analysts provide a clear target price consensus for both The Southern Company and Pacific Gas & Electric Co.
| Company | Target High | Target Low | Consensus |
|---|---|---|---|
| The Southern Company | 103 | 76 | 93.1 |
| Pacific Gas & Electric Co. | 25 | 18 | 21.5 |
The Southern Company’s consensus target of 93.1 is modestly above its current price of 87.01, indicating moderate upside potential. Pacific Gas & Electric’s consensus target of 21.5 significantly exceeds its current price of 15.85, suggesting strong expected recovery or growth.
Analyst Opinions Comparison
This section compares analysts’ ratings and grades for The Southern Company and Pacific Gas & Electric Co.:
Rating Comparison
SO Rating
- Rating: B-, considered very favorable overall.
- Discounted Cash Flow Score: Moderate at 3, indicating a balanced valuation.
- ROE Score: Favorable at 4, showing efficient profit generation.
- ROA Score: Moderate at 3, reflecting average asset utilization.
- Debt To Equity Score: Very unfavorable at 1, implying high financial risk.
- Overall Score: Moderate at 3, summarizing average financial standing.
PCG Rating
- Rating: B-, also considered very favorable overall.
- Discounted Cash Flow Score: Very unfavorable at 1, suggesting potential overvaluation.
- ROE Score: Moderate at 3, indicating average efficiency in generating profit.
- ROA Score: Moderate at 3, similarly indicating average asset utilization.
- Debt To Equity Score: Very unfavorable at 1, also indicating high financial risk.
- Overall Score: Moderate at 3, representing a comparable financial position.
Which one is the best rated?
Both companies share the same overall rating (B-) and overall score (3). SO has a higher ROE score (4 vs. 3) and better discounted cash flow score (3 vs. 1), while PCG scores better in price-to-book (not shown in table). Based strictly on provided data, SO is slightly better rated in key profitability and valuation metrics.
Scores Comparison
Here is a comparison of the Altman Z-Score and Piotroski Score for both companies:
SO Scores
- Altman Z-Score: 0.98, indicating financial distress.
- Piotroski Score: 6, reflecting average financial strength.
PCG Scores
- Altman Z-Score: 0.48, indicating financial distress.
- Piotroski Score: 5, reflecting average financial strength.
Which company has the best scores?
SO has a higher Altman Z-Score and Piotroski Score than PCG, though both are in distress zones with average strength scores. SO’s scores are marginally better.
Grades Comparison
Here is the detailed grades comparison from reputable grading companies for The Southern Company and Pacific Gas & Electric Co.:
The Southern Company Grades
The table below summarizes recent grades assigned by recognized financial institutions:
| Grading Company | Action | New Grade | Date |
|---|---|---|---|
| UBS | Maintain | Neutral | 2025-12-17 |
| JP Morgan | Maintain | Neutral | 2025-12-15 |
| Jefferies | Maintain | Neutral | 2025-12-15 |
| RBC Capital | Maintain | Sector Perform | 2025-12-12 |
| Keybanc | Maintain | Underweight | 2025-12-12 |
| Mizuho | Maintain | Neutral | 2025-12-11 |
| Barclays | Maintain | Equal Weight | 2025-11-20 |
| Jefferies | Downgrade | Neutral | 2025-11-05 |
| Ladenburg Thalmann | Downgrade | Neutral | 2025-10-17 |
| Keybanc | Maintain | Underweight | 2025-10-15 |
Overall, grades for The Southern Company show a clear trend toward neutrality with some downgrades from prior Buy ratings, indicating cautious sentiment.
Pacific Gas & Electric Co. Grades
The table below presents recent grades from established financial graders:
| Grading Company | Action | New Grade | Date |
|---|---|---|---|
| JP Morgan | Maintain | Overweight | 2025-12-12 |
| UBS | Maintain | Neutral | 2025-10-24 |
| Jefferies | Maintain | Buy | 2025-10-22 |
| BMO Capital | Maintain | Outperform | 2025-10-14 |
| Jefferies | Maintain | Buy | 2025-10-03 |
| Barclays | Maintain | Overweight | 2025-10-01 |
| Morgan Stanley | Maintain | Equal Weight | 2025-09-25 |
| Morgan Stanley | Upgrade | Equal Weight | 2025-09-18 |
| UBS | Maintain | Neutral | 2025-09-18 |
| Barclays | Maintain | Overweight | 2025-07-22 |
Pacific Gas & Electric Co. consistently receives positive ratings, including multiple Buy and Overweight grades, reflecting a generally optimistic outlook.
Which company has the best grades?
Pacific Gas & Electric Co. has received stronger and more frequent Buy and Overweight grades compared to The Southern Company’s predominantly Neutral and Underweight ratings. This suggests a more favorable consensus among analysts for PCG, potentially influencing investor confidence and portfolio positioning.
Strengths and Weaknesses
The table below summarizes the key strengths and weaknesses of The Southern Company (SO) and Pacific Gas & Electric Co. (PCG) based on their financial performance, market positioning, and operational metrics as of 2026.
| Criterion | The Southern Company (SO) | Pacific Gas & Electric Co. (PCG) |
|---|---|---|
| Diversification | Moderate diversification with strong focus on electric utilities and gas distribution operations; growing gas marketing and pipeline investments | Balanced between electricity and natural gas regulated operations; slightly more diversified in utility segments |
| Profitability | Net margin favorable at 16.47%; ROIC 4.25% below WACC; slightly unfavorable but improving ROIC trend | Net margin favorable at 10.29%; ROIC 3.98% below WACC; also slightly unfavorable but with stronger ROIC growth |
| Innovation | Limited innovation emphasis; infrastructure-heavy with stable but slow growth | Similar profile with focus on regulated utilities; innovation efforts less visible but steady improvement in profitability |
| Global presence | Primarily US-focused with regional dominance in Southeast | US regional focus, mainly California; less geographic diversification but strong local market presence |
| Market Share | Large market share in electric utilities and gas distribution in its regions | Significant market share in California utilities; competitive in both electricity and gas markets |
In summary, both companies demonstrate stable market positions with moderate diversification and strong local presence. However, both are currently shedding value as ROIC remains below WACC, despite positive trends in profitability. Investors should weigh these factors carefully, considering the improving but still challenged efficiency in capital use.
Risk Analysis
Below is a comparison of key risks for The Southern Company (SO) and Pacific Gas & Electric Co. (PCG) based on the most recent data from 2024.
| Metric | The Southern Company (SO) | Pacific Gas & Electric Co. (PCG) |
|---|---|---|
| Market Risk | Moderate (Beta 0.447) | Moderate (Beta 0.379) |
| Debt Level | High (Debt/Equity 2.0, Neutral) | High (Debt/Equity 1.94, Neutral) |
| Regulatory Risk | Significant (Utility sector) | High (Utility sector, CA regulations) |
| Operational Risk | Moderate (Asset turnover low) | Moderate (Asset turnover low) |
| Environmental Risk | Elevated (Coal, nuclear assets) | Elevated (Nuclear, wildfire liabilities) |
| Geopolitical Risk | Low (US Domestic focus) | Moderate (California wildfire exposure) |
Both companies face substantial regulatory and environmental risks inherent to the regulated utility sector. PCG’s wildfire liabilities and lower interest coverage ratio (1.76) increase its operational and financial vulnerability. SO’s debt level and liquidity ratios suggest tighter financial flexibility. Market risks remain moderate, but environmental and regulatory factors are the most impactful for these utilities in 2026.
Which Stock to Choose?
The Southern Company (SO) shows a favorable income statement with growing revenue and net income over 2020–2024. Despite slightly unfavorable financial ratios, including high debt and low liquidity, it maintains neutral profitability ratios and a very favorable overall rating of B-. The company’s ROIC is below WACC, indicating value destruction, but its ROIC trend is positive.
Pacific Gas & Electric Co. (PCG) presents a favorable income statement with strong net income growth and mixed ratio evaluations. Financial ratios show some strengths, such as a favorable P/B ratio and liquidity, but also weaknesses in debt management and interest coverage. Its overall rating is also B-, with a slightly unfavorable MOAT due to ROIC below WACC despite improving profitability.
Considering the ratings and financial metrics, SO might appear more suitable for investors prioritizing stable income growth and a stronger rating profile, while PCG could appeal to those accepting higher risk for potential value improvement reflected in profitability trends. The choice may depend on an investor’s tolerance for debt levels and preference for income stability versus turnaround potential.
Disclaimer: Investment carries a risk of loss of initial capital. The past performance is not a reliable indicator of future results. Be sure to understand risks before making an investment decision.
Go Further
I encourage you to read the complete analyses of The Southern Company and Pacific Gas & Electric Co. to enhance your investment decisions: