In the regulated electric utility sector, Public Service Enterprise Group Incorporated (PEG) and Pacific Gas & Electric Co. (PCG) stand out as major players serving distinct but overlapping markets in the US. Both companies emphasize innovation in energy distribution and sustainability strategies, making them compelling options for investors interested in stable, essential services with growth potential. This article will analyze their strengths to help you decide which company merits a place in your investment portfolio.

Table of contents
Companies Overview
I will begin the comparison between Public Service Enterprise Group Incorporated and Pacific Gas & Electric Co. by providing an overview of these two companies and their main differences.
Public Service Enterprise Group Incorporated Overview
Public Service Enterprise Group Incorporated (PEG) operates as an energy company primarily serving the Northeastern and Mid-Atlantic United States. Its business segments include electricity transmission and distribution, gas distribution, solar generation projects, and energy efficiency programs. Based in Newark, New Jersey, PEG manages extensive infrastructure with 25,000 circuit miles of electric transmission and 18,000 miles of gas mains, positioning it as a significant regional utility player.
Pacific Gas & Electric Co. Overview
Pacific Gas & Electric Co. (PCG) is a California-based utility company providing electricity and natural gas to northern and central California. It generates power through nuclear, hydroelectric, fossil fuel, and solar sources, and innovates with smart grid technology like personal microgrid backup devices. PCG serves a broad customer base including residential, commercial, industrial, and agricultural sectors, operating as a subsidiary of PG&E Corporation with a workforce of over 28K employees.
Key similarities and differences
Both PEG and PCG operate in the regulated electric utility sector, focusing on electricity and gas transmission and distribution. They serve large regional markets in the US but differ in geographical focus and generation mix, with PEG concentrated in the Northeast/Mid-Atlantic and PCG in California, incorporating diverse energy sources including nuclear and hydroelectric. PEG emphasizes solar and energy efficiency projects, while PCG invests in smart grid technologies, reflecting variations in their business models and innovation strategies.
Income Statement Comparison
This table presents a side-by-side comparison of key income statement metrics for Public Service Enterprise Group Incorporated (PEG) and Pacific Gas & Electric Co. (PCG) for the fiscal year 2024.
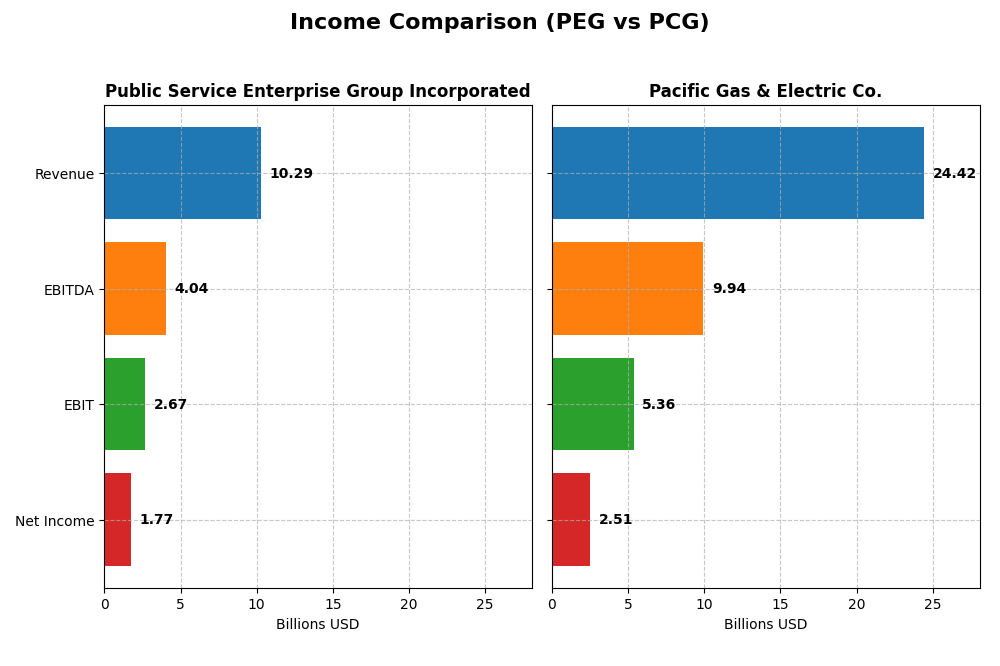
| Metric | Public Service Enterprise Group Incorporated (PEG) | Pacific Gas & Electric Co. (PCG) |
|---|---|---|
| Market Cap | 39.3B | 34.8B |
| Revenue | 10.3B | 24.4B |
| EBITDA | 4.0B | 9.9B |
| EBIT | 2.7B | 5.4B |
| Net Income | 1.77B | 2.51B |
| EPS | 3.56 | 1.16 |
| Fiscal Year | 2024 | 2024 |
Income Statement Interpretations
Public Service Enterprise Group Incorporated
From 2020 to 2024, PEG’s revenue showed moderate growth of 7.15%, but net income declined by nearly 7%, reflecting margin pressures. Gross and EBIT margins remain favorable at 34.41% and 25.91%, respectively, while net margin sits at 17.22%. However, 2024 saw an 8.43% revenue drop and a 24.5% net margin decline, signaling weakening profitability.
Pacific Gas & Electric Co.
PCG exhibited strong overall growth with revenue up 32.22% and net income surging nearly 293% over 2020-2024. Gross margin improved to 37.5%, though interest expense ratio worsened to 12.49%. The latest year showed stable revenue but significant gains in gross profit (+128.84%) and EBIT (+51.11%), alongside an 11.39% net margin expansion, indicating solid operational improvement.
Which one has the stronger fundamentals?
PCG demonstrates stronger fundamentals based on substantial revenue and net income growth, alongside improved margins and earnings per share. PEG’s income statement reveals unfavorable trends with declining net income and margins in the latest year, despite generally stable margins. PCG’s favorable growth and profitability metrics contrast with PEG’s weakening performance.
Financial Ratios Comparison
The table below presents key financial ratios for Public Service Enterprise Group Incorporated (PEG) and Pacific Gas & Electric Co. (PCG) for the fiscal year 2024, allowing a side-by-side evaluation of their recent financial performance and stability.
| Ratios | Public Service Enterprise Group (PEG) | Pacific Gas & Electric Co. (PCG) |
|---|---|---|
| ROE | 10.99% | 8.33% |
| ROIC | 4.40% | 3.98% |
| P/E | 23.74 | 17.20 |
| P/B | 2.61 | 1.43 |
| Current Ratio | 0.65 | 1.05 |
| Quick Ratio | 0.48 | 1.00 |
| D/E (Debt-to-Equity) | 1.42 | 1.94 |
| Debt-to-Assets | 41.89% | 43.65% |
| Interest Coverage | 2.80 | 1.46 |
| Asset Turnover | 0.19 | 0.18 |
| Fixed Asset Turnover | 0.26 | 0.28 |
| Payout Ratio | 67.49% | 3.42% |
| Dividend Yield | 2.84% | 0.20% |
Interpretation of the Ratios
Public Service Enterprise Group Incorporated
Public Service Enterprise Group shows a mixed ratio profile with a favorable net margin of 17.22% but unfavorable returns on invested capital (4.4%) and weak liquidity ratios, including a current ratio of 0.65. The debt-to-equity ratio is elevated at 1.42, signaling leverage concerns. Dividend yield is attractive at 2.84%, supported by stable dividends and moderate payout risk.
Pacific Gas & Electric Co.
Pacific Gas & Electric exhibits a favorable net margin of 10.29%, though its return on equity is unfavorable at 8.33%, coupled with high debt-to-equity of 1.94. Liquidity ratios are better than its peer, with a current ratio of 1.05. Dividend yield is low at 0.2%, reflecting limited shareholder returns and potential reinvestment focus.
Which one has the best ratios?
Both companies present slightly unfavorable global ratio profiles, but Public Service Enterprise Group offers stronger profitability and dividend yield, while Pacific Gas & Electric has better liquidity but weaker returns and shareholder distributions. Neither company distinctly outperforms, as each faces notable challenges in financial ratios.
Strategic Positioning
This section compares the strategic positioning of Public Service Enterprise Group Incorporated (PEG) and Pacific Gas & Electric Co. (PCG) regarding Market position, Key segments, and disruption:
Public Service Enterprise Group Incorporated
- Established market presence in Northeastern and Mid-Atlantic US with regulated electric utility operations.
- Diverse segments including electricity transmission, gas distribution, solar projects, and appliance services.
- Moderate exposure through investment in solar and energy efficiency programs alongside traditional utilities.
Pacific Gas & Electric Co.
- Serves northern and central California with regulated electric and natural gas utilities.
- Focused on electricity generation (nuclear, hydro, fossil, photovoltaic) and natural gas distribution.
- Active in smart grid technology development with microgrid backup integration, indicating tech adaptation.
Public Service Enterprise Group Incorporated vs Pacific Gas & Electric Co. Positioning
PEG adopts a diversified approach with multiple business segments including solar and appliance services, while PCG concentrates on electricity generation and smart grid innovation. PEG’s broader scope may offer stability; PCG’s focus emphasizes technological integration but depends on fewer core activities.
Which has the best competitive advantage?
Both companies show slightly unfavorable MOAT evaluations due to ROIC below WACC but with growing profitability trends. PCG exhibits a stronger ROIC growth than PEG, suggesting a potentially more improving competitive position despite current value destruction.
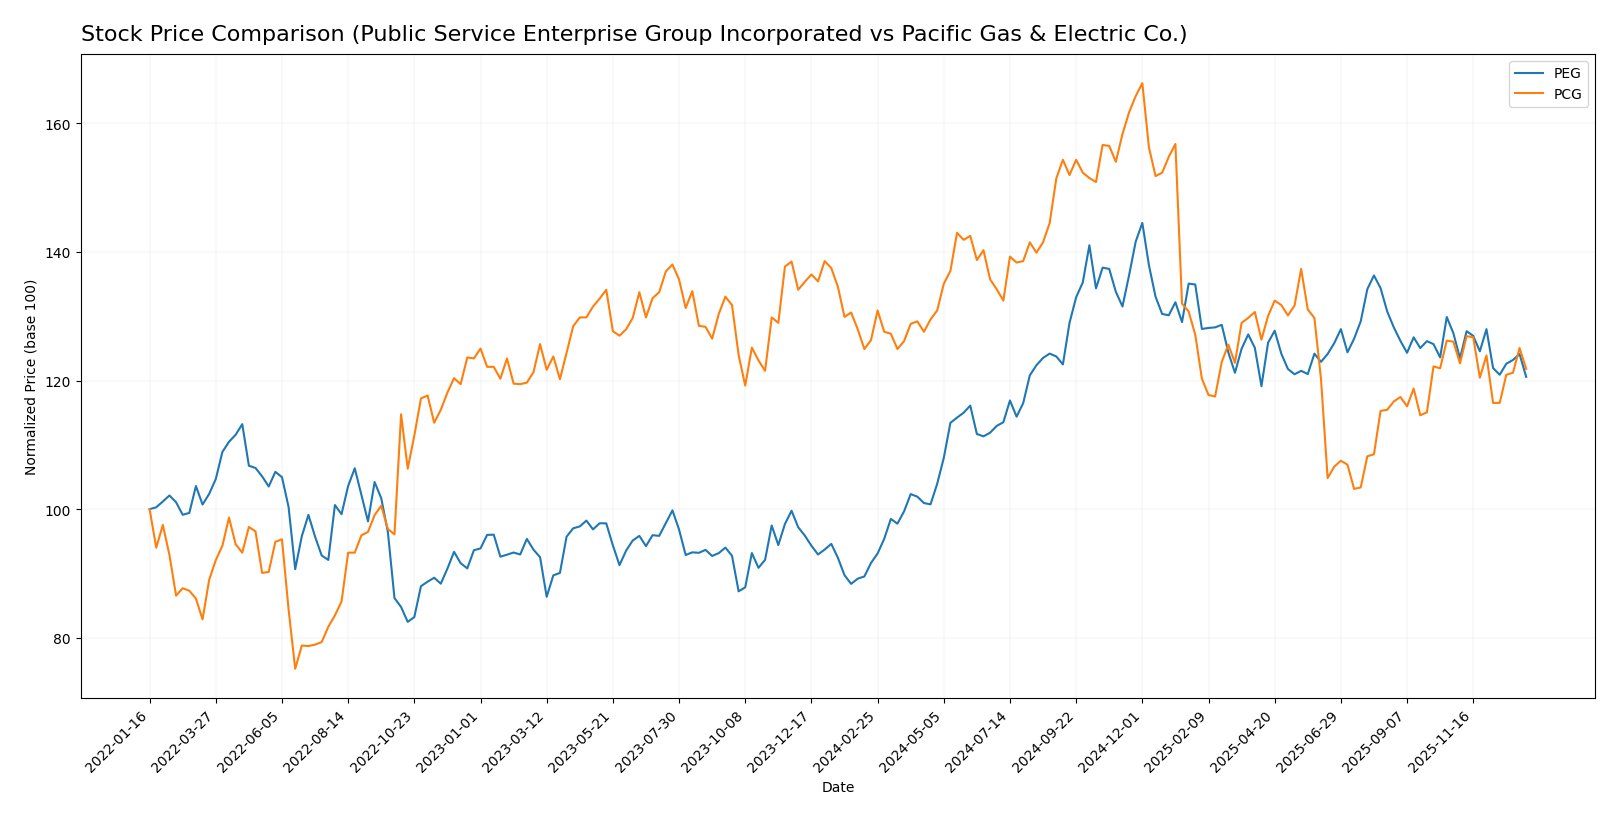
Stock Comparison
The stock price movements over the past 12 months reveal a strong bullish trend for Public Service Enterprise Group Incorporated (PEG), contrasted by a bearish trajectory for Pacific Gas & Electric Co. (PCG), with both showing signs of decelerating momentum in recent months.
Trend Analysis
Public Service Enterprise Group Incorporated (PEG) experienced a 31.59% price increase over the past year, indicating a clear bullish trend with decelerating momentum. The stock ranged between 59.79 and 94.3, showing moderate volatility with a 7.17 standard deviation.
Pacific Gas & Electric Co. (PCG) recorded a 3.53% price decline over the same period, marking a bearish trend with deceleration. Its price fluctuated between 13.42 and 21.63, with lower volatility reflected by a 1.93 standard deviation.
Comparing both stocks, PEG delivered substantially higher market performance than PCG over the past year, reflecting divergent investor sentiment and price momentum between the two utilities.
Target Prices
The current analyst consensus presents moderate upside potential for these regulated electric utilities.
| Company | Target High | Target Low | Consensus |
|---|---|---|---|
| Public Service Enterprise Group Incorporated | 98 | 83 | 89 |
| Pacific Gas & Electric Co. | 25 | 18 | 21.5 |
Analysts expect Public Service Enterprise Group’s stock to rise from $78.68 to a consensus target of $89, indicating a potential 13% gain. Pacific Gas & Electric is also forecasted to appreciate from $15.85 to $21.5, signaling roughly 36% upside.
Analyst Opinions Comparison
This section compares analysts’ ratings and grades for Public Service Enterprise Group Incorporated (PEG) and Pacific Gas & Electric Co. (PCG):
Rating Comparison
PEG Rating
- Rating: B-, considered very favorable by analysts.
- Discounted Cash Flow Score: 1, rated very unfavorable, indicating potential overvaluation concerns.
- ROE Score: 4, favorable, showing efficient profit generation from equity.
- ROA Score: 4, favorable, reflecting strong asset utilization.
- Debt To Equity Score: 2, moderate, showing balanced financial risk.
- Overall Score: 3, moderate, summarizing average overall financial health.
PCG Rating
- Rating: B-, also regarded as very favorable.
- Discounted Cash Flow Score: 1, similarly very unfavorable, suggesting valuation risks.
- ROE Score: 3, moderate, indicating average efficiency in generating shareholder returns.
- ROA Score: 3, moderate, reflecting average asset use effectiveness.
- Debt To Equity Score: 1, very unfavorable, indicating higher financial risk due to leverage.
- Overall Score: 3, moderate, indicating similar overall financial standing.
Which one is the best rated?
Both PEG and PCG share the same overall rating of B- and an overall score of 3, indicating moderate financial health. PEG outperforms PCG on ROE and ROA scores and has a stronger debt-to-equity score, whereas PCG shows a less favorable debt profile.
Scores Comparison
Here is a comparison of the financial health scores for Public Service Enterprise Group Incorporated (PEG) and Pacific Gas & Electric Co. (PCG):
PEG Scores
- Altman Z-Score: 1.32, indicating financial distress zone.
- Piotroski Score: 7, reflecting strong financial health.
PCG Scores
- Altman Z-Score: 0.48, indicating financial distress zone.
- Piotroski Score: 5, reflecting average financial health.
Which company has the best scores?
PEG and PCG are both in the distress zone by Altman Z-Score, but PEG’s value is higher, indicating relatively less risk. PEG also outperforms PCG on the Piotroski Score, showing stronger financial health overall.
Grades Comparison
The following section compares the latest grades and ratings issued by reputable financial institutions for both companies:
Public Service Enterprise Group Incorporated Grades
This table summarizes recent grades from recognized grading companies for PEG:
| Grading Company | Action | New Grade | Date |
|---|---|---|---|
| Ladenburg Thalmann | Upgrade | Buy | 2026-01-07 |
| UBS | Maintain | Buy | 2025-12-17 |
| JP Morgan | Maintain | Overweight | 2025-12-12 |
| Jefferies | Upgrade | Buy | 2025-11-06 |
| TD Cowen | Maintain | Buy | 2025-11-05 |
| BMO Capital | Maintain | Market Perform | 2025-11-04 |
| Barclays | Maintain | Equal Weight | 2025-10-21 |
| BMO Capital | Maintain | Market Perform | 2025-10-20 |
| Morgan Stanley | Maintain | Overweight | 2025-09-25 |
| BMO Capital | Maintain | Market Perform | 2025-08-06 |
Overall, PEG’s grades trend toward positive ratings, with several upgrades to Buy and sustained Overweight ratings from major firms.
Pacific Gas & Electric Co. Grades
This table summarizes recent grades from recognized grading companies for PCG:
| Grading Company | Action | New Grade | Date |
|---|---|---|---|
| JP Morgan | Maintain | Overweight | 2025-12-12 |
| UBS | Maintain | Neutral | 2025-10-24 |
| Jefferies | Maintain | Buy | 2025-10-22 |
| BMO Capital | Maintain | Outperform | 2025-10-14 |
| Jefferies | Maintain | Buy | 2025-10-03 |
| Barclays | Maintain | Overweight | 2025-10-01 |
| Morgan Stanley | Maintain | Equal Weight | 2025-09-25 |
| Morgan Stanley | Upgrade | Equal Weight | 2025-09-18 |
| UBS | Maintain | Neutral | 2025-09-18 |
| Barclays | Maintain | Overweight | 2025-07-22 |
The overall rating for PCG remains stable with a mix of Buy, Overweight, and Neutral grades, indicating a balanced outlook.
Which company has the best grades?
Both PEG and PCG hold a consensus rating of Buy with multiple Buy and Overweight grades from reputable firms. PEG shows a slightly stronger upgrade momentum recently, which could reflect a more favorable near-term outlook, while PCG’s ratings are steadier but less frequently upgraded. These dynamics may influence investor sentiment regarding risk and potential returns.
Strengths and Weaknesses
Below is a comparison table highlighting the strengths and weaknesses of Public Service Enterprise Group Incorporated (PEG) and Pacific Gas & Electric Co. (PCG) based on recent financial and operational data.
| Criterion | Public Service Enterprise Group Incorporated (PEG) | Pacific Gas & Electric Co. (PCG) |
|---|---|---|
| Diversification | Moderate diversification with revenue from gas distribution, transmission, and electric services | Strong focus on electricity and natural gas in US regulated markets |
| Profitability | Net margin 17.22% (favorable); ROIC 4.4% (unfavorable); growing ROIC trend | Net margin 10.29% (favorable); ROIC 3.98% (unfavorable); stronger ROIC growth |
| Innovation | Limited data on innovation; steady revenue growth in core segments | Limited innovation data; steady growth but operational challenges persist |
| Global presence | Primarily US-focused utilities with no significant global footprint | US regional utility with focused presence in California market |
| Market Share | Large market share in New Jersey and surrounding areas in electric and gas distribution | Significant market share in California electricity and gas markets |
Key takeaway: Both PEG and PCG show slightly unfavorable economic moats with value destruction but improving profitability trends. PEG has higher net margins and broader diversification, while PCG benefits from stronger ROIC growth but faces more operational risks. Investors should weigh stable cash flows against margin and capital efficiency challenges.
Risk Analysis
Below is a comparison table outlining key risk metrics for Public Service Enterprise Group Incorporated (PEG) and Pacific Gas & Electric Co. (PCG) as of 2024.
| Metric | Public Service Enterprise Group (PEG) | Pacific Gas & Electric (PCG) |
|---|---|---|
| Market Risk | Beta 0.61 (moderate volatility) | Beta 0.38 (low volatility) |
| Debt Level | Debt to Equity 1.42 (unfavorable) | Debt to Equity 1.94 (very unfavorable) |
| Regulatory Risk | Moderate, stable US Northeast market | High, due to California wildfire liabilities |
| Operational Risk | Moderate; large infrastructure network | Elevated; legacy infrastructure and wildfire risk |
| Environmental Risk | Moderate; invests in solar and efficiency | High; exposed to wildfire and environmental compliance |
| Geopolitical Risk | Low; primarily US regional exposure | Moderate; California regulatory environment and energy policies |
The most significant risks are PCG’s high regulatory and environmental exposure linked to wildfire liabilities, which pose substantial financial and operational challenges. PEG shows moderate debt concerns and operational risks but benefits from a more stable regulatory environment and lower market volatility. Investors should weigh PCG’s elevated risk profile against its potential recovery and regulatory reforms.
Which Stock to Choose?
Public Service Enterprise Group Incorporated (PEG) shows mixed financial health with a slight decline in income metrics and profitability over recent years. Its financial ratios reveal some unfavorable liquidity and leverage levels, though net margin and dividend yield remain favorable. The company’s rating is very favorable overall, despite a moderate score on discounted cash flow and debt metrics.
Pacific Gas & Electric Co. (PCG) displays a more favorable income evolution, with significant growth in net income and margins over the period. Financial ratios indicate some strengths in liquidity and valuation, but concerns persist with debt levels and interest coverage. PCG’s rating is also very favorable, supported by moderate to favorable scores in key profitability and valuation measures.
Investors prioritizing stable income growth and improving profitability might view PCG as more favorable, given its stronger income statement trends and liquidity ratios. Conversely, those focusing on dividend yield and moderate risk could find PEG’s profile more aligned with their preferences, despite some financial constraints. Both companies show slightly unfavorable moat evaluations, indicating value destruction but improving profitability.
Disclaimer: Investment carries a risk of loss of initial capital. The past performance is not a reliable indicator of future results. Be sure to understand risks before making an investment decision.
Go Further
I encourage you to read the complete analyses of Public Service Enterprise Group Incorporated and Pacific Gas & Electric Co. to enhance your investment decisions: