In the rapidly evolving technology sector, Trimble Inc. and Ouster, Inc. stand out as innovators in hardware and equipment. Trimble, with its broad portfolio spanning construction, agriculture, and transportation, contrasts with Ouster’s focus on advanced digital lidar sensors for 3D vision applications. This comparison explores their market approaches and innovation strategies to help you identify which company offers the most compelling investment opportunity today.

Table of contents
Companies Overview
I will begin the comparison between Trimble Inc. and Ouster, Inc. by providing an overview of these two companies and their main differences.
Trimble Inc. Overview
Trimble Inc. provides technology solutions aimed at enhancing work processes for professionals and field mobile workers globally. The company operates across several segments including Buildings and Infrastructure, Geospatial, Resources and Utilities, and Transportation. Its offerings range from 3D design software to precision agriculture products and fleet management systems, positioning Trimble as a diversified technology provider in hardware and software for construction, agriculture, and transportation sectors.
Ouster, Inc. Overview
Ouster, Inc. specializes in designing and manufacturing high-resolution digital lidar sensors and enabling software that deliver 3D vision capabilities to machinery, vehicles, robots, and fixed infrastructure. Its product range includes scanning and solid-state flash sensors. Based in San Francisco and a relatively newer player since its 2020 IPO, Ouster focuses on advanced sensing technology within the hardware and equipment industry.
Key similarities and differences
Both Trimble and Ouster operate in the technology sector within hardware, equipment, and parts. While Trimble offers a broad portfolio across multiple end markets such as construction, agriculture, and transportation, Ouster concentrates on lidar sensor technology providing 3D vision solutions. Trimble’s larger scale and diversified segments contrast with Ouster’s focused approach on sensing hardware and software, reflecting different business models and market strategies.
Income Statement Comparison
The table below compares the key income statement metrics for Trimble Inc. and Ouster, Inc. for their most recent fiscal year.

| Metric | Trimble Inc. (TRMB) | Ouster, Inc. (OUST) |
|---|---|---|
| Market Cap | 18.97B | 1.64B |
| Revenue | 3.68B | 111.1M |
| EBITDA | 2.33B | -79.95M |
| EBIT | 2.10B | -94.69M |
| Net Income | 1.50B | -97.05M |
| EPS | 6.13 | -2.08 |
| Fiscal Year | 2024 | 2024 |
Income Statement Interpretations
Trimble Inc.
Trimble Inc. showed a 17.02% revenue increase over 2020-2024, with net income growing 286% in the same period. Margins remain strong and favorable, with a 65.06% gross margin and a net margin of 40.84%. In 2024, revenue slightly declined by 3%, but net income and EBIT margins improved significantly, reflecting better profitability.
Ouster, Inc.
Ouster, Inc. experienced rapid revenue growth of 488% from 2020 to 2024, yet it remains unprofitable with a negative net margin of -87.35%. Gross margin is positive at 36.42%, but EBIT margin is deeply negative at -85.22%. In 2024, Ouster’s revenue and margins improved notably, with strong growth in net margin and EPS, though it still reports losses.
Which one has the stronger fundamentals?
Trimble exhibits stronger fundamentals with substantial net income growth, high and stable margins, and improved profitability despite a slight revenue dip in 2024. Conversely, Ouster’s impressive revenue growth is offset by persistent net losses and negative EBIT margins. Both companies show favorable income statement trends overall, but Trimble’s profitability metrics are markedly stronger.
Financial Ratios Comparison
This table compares the most recent key financial ratios for Trimble Inc. and Ouster, Inc., offering a snapshot of their profitability, liquidity, leverage, and efficiency metrics for fiscal year 2024.
| Ratios | Trimble Inc. (TRMB) | Ouster, Inc. (OUST) |
|---|---|---|
| ROE | 26.2% | -53.6% |
| ROIC | 4.5% | -50.8% |
| P/E | 11.5 | -5.87 |
| P/B | 3.02 | 3.15 |
| Current Ratio | 1.27 | 2.80 |
| Quick Ratio | 1.16 | 2.59 |
| D/E (Debt-to-Equity) | 0.26 | 0.11 |
| Debt-to-Assets | 16.0% | 7.3% |
| Interest Coverage | 5.08 | -57.1 |
| Asset Turnover | 0.39 | 0.40 |
| Fixed Asset Turnover | 11.81 | 4.54 |
| Payout Ratio | 0% | 0% |
| Dividend Yield | 0% | 0% |
Interpretation of the Ratios
Trimble Inc.
Trimble Inc. presents a generally favorable ratio profile with strong net margin (40.84%) and return on equity (26.18%), though return on invested capital (4.49%) and asset turnover are weaker. Its moderate current ratio (1.27) indicates reasonable short-term liquidity. The company does not pay dividends, likely prioritizing reinvestment given zero dividend yield and no payout activity.
Ouster, Inc.
Ouster shows weak financial ratios marked by a negative net margin (-87.35%) and return on equity (-53.64%), reflecting operational losses. However, liquidity ratios are strong with a current ratio of 2.8 and low debt levels. Ouster does not distribute dividends, consistent with its negative profitability and focus on growth and R&D expenditures.
Which one has the best ratios?
Trimble offers a more favorable overall ratios profile, with profitability and return metrics substantially better than Ouster’s negative results. While Ouster demonstrates solid liquidity and low leverage, its operational losses and unprofitable status weigh heavily. Trimble’s balanced risk and return metrics make its ratios comparatively stronger.
Strategic Positioning
This section compares the strategic positioning of Trimble Inc. and Ouster, Inc., focusing on Market position, Key segments, and Exposure to technological disruption:
Trimble Inc.
- Large market cap of $18.97B with diversified segments facing moderate competitive pressure.
- Diversified segments including Buildings, Geospatial, Resources, Utilities, and Transportation driving broad revenue streams.
- Exposure to tech disruption through integration of advanced construction and geospatial software, precision agriculture, and mobility solutions.
Ouster, Inc.
- Smaller market cap of $1.64B, operating in a niche lidar sensor market with high competitive volatility.
- Concentrated on high-resolution digital lidar sensors and software, targeting machinery, vehicles, and infrastructure.
- Positioned in an emerging tech niche with lidar sensors critical for 3D vision in robotics and autonomous systems.
Trimble Inc. vs Ouster, Inc. Positioning
Trimble follows a diversified strategy across multiple industries with broad revenue drivers, while Ouster focuses on a specialized lidar sensor market. Trimble’s scale offers stability, whereas Ouster’s niche may offer growth but with concentrated risk.
Which has the best competitive advantage?
Both companies are shedding value with ROIC below WACC. Trimble’s declining ROIC signals worsening profitability, while Ouster shows improving ROIC trends despite value destruction, indicating a slightly more favorable long-term potential moat.
Stock Comparison
The stock price dynamics over the past year reveal significant growth in both Trimble Inc. and Ouster, Inc., with notable deceleration in their bullish trends and contrasting recent downward movements in prices.
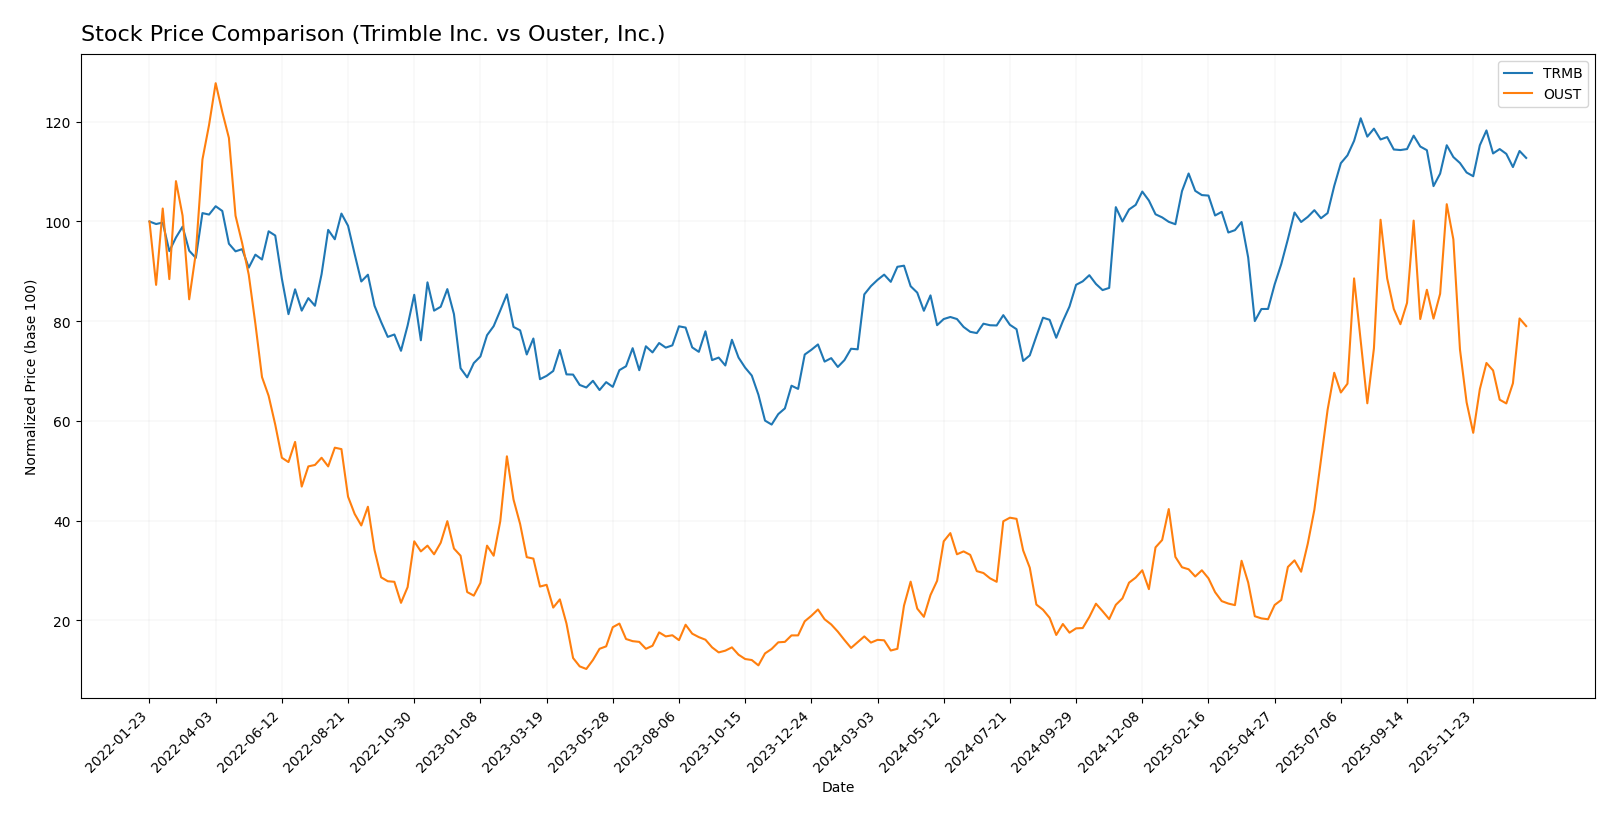
Trend Analysis
Trimble Inc. (TRMB) experienced a bullish trend over the past 12 months with a 29.56% price increase, showing deceleration and a peak price of 85.24. Recent trading indicates a neutral trend with a slight -0.16% change.
Ouster, Inc. (OUST) recorded a strong bullish trend with a 409.12% gain over the last year, also decelerating, hitting a high of 35.8. Its recent trend is bearish, with an 18.05% decline between November 2025 and January 2026.
Comparing both stocks, Ouster delivered the highest market performance over the year but currently shows a sharper recent decline compared to Trimble’s near-neutral recent movement.
Target Prices
Analysts present a cautiously optimistic target consensus for these technology hardware companies.
| Company | Target High | Target Low | Consensus |
|---|---|---|---|
| Trimble Inc. | 102 | 94 | 98.2 |
| Ouster, Inc. | 39 | 33 | 36.67 |
Trimble’s target consensus at 98.2 indicates a significant upside from the current price of 79.75, while Ouster’s consensus of 36.67 also suggests potential growth above its current 27.39 market price.
Analyst Opinions Comparison
This section compares analysts’ ratings and grades for Trimble Inc. and Ouster, Inc.:
Rating Comparison
Trimble Inc. Rating
- Rating: B- indicating a very favorable assessment
- Discounted Cash Flow Score: 3, a moderate positive score
- ROE Score: 3, showing moderate efficiency in profit use
- ROA Score: 3, moderate effectiveness in asset use
- Debt To Equity Score: 2, moderate financial risk
- Overall Score: 2, reflecting a moderate overall rating
Ouster, Inc. Rating
- Rating: C- with a very favorable status
- Discounted Cash Flow Score: 1, a very unfavorable score
- ROE Score: 1, indicating very unfavorable profitability
- ROA Score: 1, very unfavorable asset utilization
- Debt To Equity Score: 3, moderate financial risk
- Overall Score: 1, reflecting a very unfavorable rating
Which one is the best rated?
Trimble Inc. holds higher scores across discounted cash flow, ROE, ROA, and overall rating compared to Ouster, Inc., which has very unfavorable scores except for a better debt-to-equity rating. Therefore, Trimble is better rated overall based on the provided data.
Scores Comparison
Here is a comparison of the Altman Z-Score and Piotroski Score for Trimble Inc. and Ouster, Inc.:
Trimble Inc. Scores
- Altman Z-Score: 4.56, indicating a safe zone with low bankruptcy risk.
- Piotroski Score: 6, categorized as average financial strength.
Ouster, Inc. Scores
- Altman Z-Score: 3.66, also in the safe zone, indicating low bankruptcy risk.
- Piotroski Score: 4, also considered average financial strength.
Which company has the best scores?
Trimble Inc. shows a higher Altman Z-Score than Ouster, both in the safe zone, indicating stronger financial stability. Trimble also has a better Piotroski Score, suggesting relatively stronger financial health than Ouster based on the provided data.
Grades Comparison
Here is a comparison of the recent grades and ratings assigned to Trimble Inc. and Ouster, Inc.:
Trimble Inc. Grades
The following table summarizes recent grades issued by recognized grading companies for Trimble Inc.:
| Grading Company | Action | New Grade | Date |
|---|---|---|---|
| Barclays | Maintain | Overweight | 2026-01-12 |
| Keybanc | Upgrade | Overweight | 2025-12-16 |
| Piper Sandler | Maintain | Overweight | 2025-11-07 |
| JP Morgan | Maintain | Overweight | 2025-09-19 |
| JP Morgan | Maintain | Overweight | 2025-08-07 |
| Oppenheimer | Maintain | Outperform | 2025-08-07 |
| Raymond James | Maintain | Outperform | 2025-08-07 |
| Oppenheimer | Maintain | Outperform | 2025-07-17 |
| JP Morgan | Maintain | Overweight | 2025-07-10 |
| JP Morgan | Maintain | Overweight | 2025-05-14 |
Trimble Inc. consistently holds “Overweight” and “Outperform” ratings, indicating a generally positive outlook from multiple reputable firms.
Ouster, Inc. Grades
The following table details recent grades issued by recognized grading companies for Ouster, Inc.:
| Grading Company | Action | New Grade | Date |
|---|---|---|---|
| Cantor Fitzgerald | Upgrade | Overweight | 2025-11-07 |
| Cantor Fitzgerald | Upgrade | Overweight | 2025-11-06 |
| WestPark Capital | Maintain | Buy | 2025-11-05 |
| Rosenblatt | Maintain | Buy | 2025-11-05 |
| WestPark Capital | Upgrade | Buy | 2025-08-13 |
| Oppenheimer | Maintain | Outperform | 2025-07-16 |
| WestPark Capital | Downgrade | Hold | 2025-06-12 |
| WestPark Capital | Upgrade | Buy | 2025-05-09 |
| Rosenblatt | Maintain | Buy | 2025-03-21 |
| Cantor Fitzgerald | Maintain | Overweight | 2025-03-21 |
Ouster, Inc. shows a range of “Buy,” “Overweight,” and “Outperform” ratings, with some recent upgrades and one downgrade, reflecting mixed but generally positive sentiment.
Which company has the best grades?
Trimble Inc. has received more consistent “Overweight” and “Outperform” grades from multiple firms, while Ouster, Inc. shows more variability with several upgrades and a downgrade. This consistency for Trimble may suggest steadier analyst confidence, which could impact investor perceptions of stability and risk.
Strengths and Weaknesses
Below is a comparison of key strengths and weaknesses for Trimble Inc. and Ouster, Inc. based on the most recent financial and operational data.
| Criterion | Trimble Inc. (TRMB) | Ouster, Inc. (OUST) |
|---|---|---|
| Diversification | Highly diversified across Buildings, Geospatial, Resources, and Transportation segments with combined product and service revenues exceeding $3.6B | Limited diversification, mainly focused on product sales with $111M revenue in 2024 |
| Profitability | Strong net margin (40.8%) and ROE (26.2%), but ROIC (4.5%) below WACC (10.8%), indicating some value erosion | Negative net margin (-87.4%) and ROE (-53.6%), ROIC (-50.8%) well below WACC (17.5%), value destroying but improving |
| Innovation | Established leader with solid innovation in advanced devices and field solutions | Emerging company with growing ROIC trend reflecting improving innovation and operational efficiency |
| Global presence | Broad global footprint with multiple industry verticals and service offerings | Smaller scale with limited geographic and market penetration |
| Market Share | Significant market share in various segments backed by strong fixed asset turnover (11.8) | Smaller market share, still developing competitive positioning |
Key takeaways: Trimble shows robust profitability and diversification but struggles with capital efficiency and declining ROIC. Ouster is currently unprofitable but exhibits improving profitability trends, signaling potential growth. Investors should weigh Trimble’s stability against Ouster’s growth prospects and inherent risks.
Risk Analysis
The table below summarizes the key risks associated with Trimble Inc. and Ouster, Inc. based on their financial and operational profiles as of 2024.
| Metric | Trimble Inc. (TRMB) | Ouster, Inc. (OUST) |
|---|---|---|
| Market Risk | Moderate (Beta 1.59) | High (Beta 2.94) |
| Debt level | Low (D/E 0.26, 16% debt/assets) | Very Low (D/E 0.11, 7.3% debt/assets) |
| Regulatory Risk | Moderate (Technology sector regulations) | Moderate (Emerging lidar tech regulations) |
| Operational Risk | Moderate (Established with 12.1K employees) | High (Small size, 292 employees) |
| Environmental Risk | Moderate (Precision agriculture focus) | Moderate (Manufacturing emissions concerns) |
| Geopolitical Risk | Moderate (Global operations) | Moderate (US-focused, supply chain exposure) |
Trimble’s most significant risks stem from moderate market volatility and operational complexity, but strong financial health limits downside. Ouster faces higher market and operational risks due to its smaller scale, negative profitability, and high beta, increasing investment risk significantly.
Which Stock to Choose?
Trimble Inc. (TRMB) shows a generally favorable income evolution with strong profitability, including a 40.84% net margin and 26.18% ROE, supported by a moderate debt level and a positive rating of B-. Despite a declining ROIC and value destruction signals, TRMB maintains a stable financial profile with mostly favorable ratios.
Ouster, Inc. (OUST) exhibits rapid revenue growth but suffers from significant losses with an -87.35% net margin and negative ROE, reflecting ongoing value destruction despite improving ROIC trends. Its financial ratios are mixed, showing higher liquidity but an overall unfavorable rating of C- and weaker profitability metrics.
Investors prioritizing financial stability and established profitability might find TRMB’s profile more favorable, while those seeking high-growth opportunities with tolerance for risk could interpret OUST’s improving trends as potential. Both companies currently exhibit value destruction, so caution and further monitoring may be prudent.
Disclaimer: Investment carries a risk of loss of initial capital. The past performance is not a reliable indicator of future results. Be sure to understand risks before making an investment decision.
Go Further
I encourage you to read the complete analyses of Trimble Inc. and Ouster, Inc. to enhance your investment decisions: