Home > Comparison > Technology > TDY vs OUST
The strategic rivalry between Teledyne Technologies Incorporated and Ouster, Inc. shapes the competitive landscape of the technology hardware sector. Teledyne operates as a diversified industrial technology powerhouse with broad applications across aerospace, defense, and imaging. Ouster, by contrast, focuses on high-resolution digital lidar sensors, emphasizing innovation in autonomous and robotic systems. This analysis evaluates which company offers a superior risk-adjusted profile for inclusion in a diversified portfolio.
Table of contents
Companies Overview
Teledyne Technologies and Ouster, Inc. each hold critical roles in the hardware and equipment sector, shaping industrial and technological innovation.
Teledyne Technologies Incorporated: Industrial Technology Powerhouse
Teledyne dominates as a diversified technology firm with a market cap of 29.5B USD. Its core revenue derives from instrumentation, digital imaging, aerospace, and engineered systems. In 2026, Teledyne’s strategic focus sharpens on integrating advanced sensor networks and defense electronics to solidify its competitive edge in industrial growth markets worldwide.
Ouster, Inc.: Digital Lidar Innovator
Ouster specializes in high-resolution digital lidar sensors and enabling software, targeting 3D vision applications across vehicles, robotics, and infrastructure. With a market cap of just over 1B USD, Ouster concentrates on expanding its product portfolio in scanning and solid-state sensors in 2026, aiming to disrupt the sensor technology landscape with innovative, software-driven hardware solutions.
Strategic Collision: Similarities & Divergences
Teledyne’s broad industrial ecosystem contrasts sharply with Ouster’s focused innovation in lidar technology. Both compete for market share in sensor-driven applications but approach growth differently: Teledyne leverages scale and diversification, while Ouster bets on niche precision and software integration. Their investment profiles diverge accordingly, with Teledyne embodying stability and breadth, and Ouster projecting high volatility and growth potential.
Income Statement Comparison
This data dissects the core profitability and scalability of both corporate engines to reveal who dominates the bottom line:

| Metric | Teledyne Technologies Incorporated (TDY) | Ouster, Inc. (OUST) |
|---|---|---|
| Revenue | 6.12B | 111.1M |
| Cost of Revenue | 3.72B | 70.6M |
| Operating Expenses | 1.25B | 144.6M |
| Gross Profit | 2.40B | 40.5M |
| EBITDA | 1.50B | -79.9M |
| EBIT | 1.16B | -94.7M |
| Interest Expense | 59.6M | 1.8M |
| Net Income | 895M | -97.0M |
| EPS | 18.88 | -2.08 |
| Fiscal Year | 2025 | 2024 |
Income Statement Analysis: The Bottom-Line Duel
This income statement comparison reveals which company operates with superior efficiency and financial discipline in their core business engine.
Teledyne Technologies Incorporated Analysis
Teledyne’s revenue grew steadily from 4.6B in 2021 to 6.1B in 2025, with net income doubling to 895M. Its gross margin holds firm near 39%, while net margin improved to 14.6%, signaling strong profitability. The 2025 year shows robust momentum, with EBIT up 16.6% and EPS rising nearly 10%, reflecting operational leverage and disciplined cost control.
Ouster, Inc. Analysis
Ouster’s revenue expanded rapidly from 19M in 2020 to 111M in 2024, but the company remains deeply unprofitable with a net loss of 97M in 2024. Its gross margin of 36.4% is respectable, yet the EBIT margin at -85% highlights ongoing operating inefficiencies. Despite heavy losses, Ouster shows improving trends with net margin and EPS growth exceeding 79% year-over-year, hinting at early-stage scaling dynamics.
Profitability Strength vs. Growth Struggles
Teledyne stands as the clear fundamental winner with consistent profitability, expanding margins, and strong net income growth. Ouster impresses with rapid top-line expansion and improving losses but remains far from break-even. Investors seeking steady returns favor Teledyne’s proven operating model; those betting on high growth must weigh Ouster’s riskier, loss-heavy profile.
Financial Ratios Comparison
These vital ratios act as a diagnostic tool to expose the underlying fiscal health, valuation premiums, and capital efficiency of the companies analyzed:
| Ratios | Teledyne Technologies (TDY) | Ouster, Inc. (OUST) |
|---|---|---|
| ROE | 8.51% | -53.64% |
| ROIC | 6.68% | -50.84% |
| P/E | 27.35 | -5.87 |
| P/B | 2.33 | 3.15 |
| Current Ratio | 1.64 | 2.80 |
| Quick Ratio | 1.08 | 2.59 |
| D/E (Debt to Equity) | 0.24 | 0.11 |
| Debt-to-Assets | 16.19% | 7.33% |
| Interest Coverage | 19.29 | -57.15 |
| Asset Turnover | 0.40 | 0.40 |
| Fixed Asset Turnover | 7.29 | 4.54 |
| Payout Ratio | 0 | 0 |
| Dividend Yield | 0% | 0% |
| Fiscal Year | 2025 | 2024 |
Efficiency & Valuation Duel: The Vital Signs
Financial ratios act as a company’s DNA, unveiling hidden risks and operational strengths that shape investor decisions.
Teledyne Technologies Incorporated
Teledyne posts a moderate ROE of 8.5%, paired with a strong net margin of 14.6%, signaling solid profitability but some pressure on equity returns. Its P/E ratio at 27.35 suggests the stock is slightly expensive relative to earnings. Teledyne maintains a disciplined capital structure with no dividends, focusing on reinvestment in R&D for growth.
Ouster, Inc.
Ouster suffers steep losses with a negative ROE of -53.6% and a net margin of -87.4%, reflecting deep operational challenges. The P/E is negative but the EV/Sales ratio near 4.9 indicates valuation stretched by growth expectations. Ouster invests heavily in R&D, foregoing dividends to fuel innovation despite unfavorable returns.
Profitability Stability vs. Growth Gambit
Teledyne offers a more stable profitability profile with reasonable valuation metrics and a balanced reinvestment strategy. Ouster’s ratios reveal high risk with a focus on growth over immediate returns. Investors seeking operational safety may lean toward Teledyne, while those willing to tolerate volatility for innovation exposure might consider Ouster.
Which one offers the Superior Shareholder Reward?
I compare Teledyne Technologies (TDY) and Ouster, Inc. (OUST) on shareholder returns. Neither pays dividends, so I focus on buybacks and reinvestment. TDY delivers solid free cash flow (22.7/share in 2025) with no dividends but a disciplined strategy. OUST burns cash with negative margins and free cash flow, reinvesting heavily in growth. TDY’s absence of dividends pairs with steady buybacks, sustaining long-term value. OUST’s aggressive R&D and capex fuel future potential but heighten risk. I see TDY as the superior choice for 2026 investors, balancing cash generation and shareholder reward more sustainably.
Comparative Score Analysis: The Strategic Profile
The radar chart reveals the fundamental DNA and trade-offs of Teledyne Technologies and Ouster, highlighting their financial strengths and weaknesses:
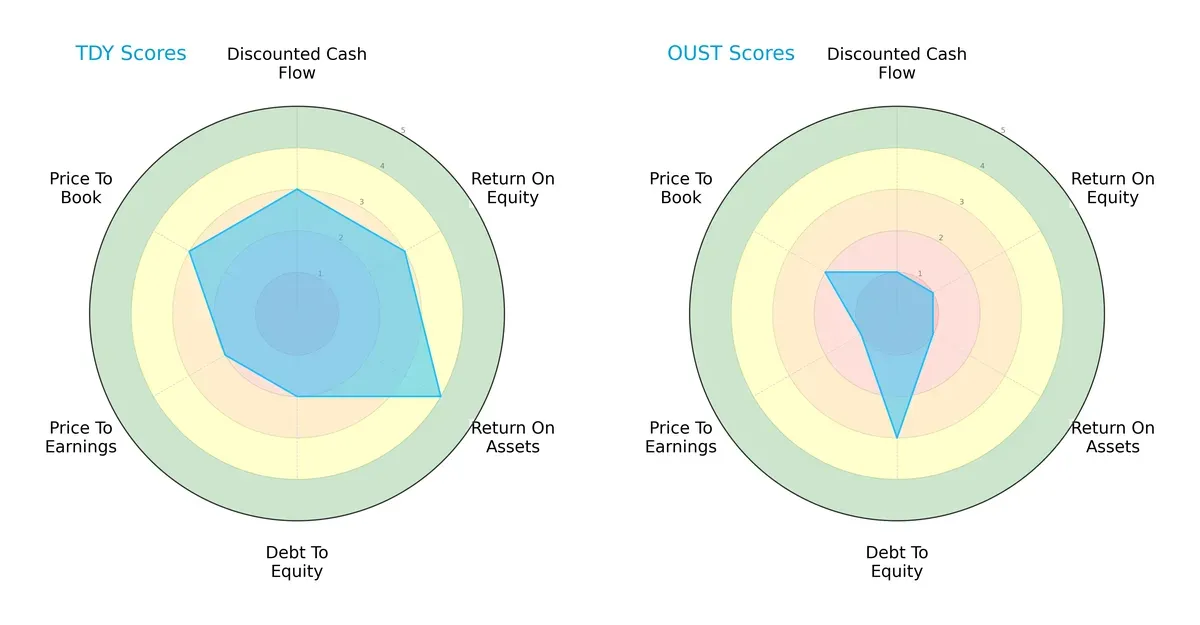
Teledyne Technologies shows a balanced profile with moderate scores in DCF, ROE, ROA, and valuation metrics, though its debt-to-equity score is moderate. Ouster relies heavily on a moderate debt-to-equity score but scores very low across profitability and valuation metrics, indicating a less stable financial foundation.
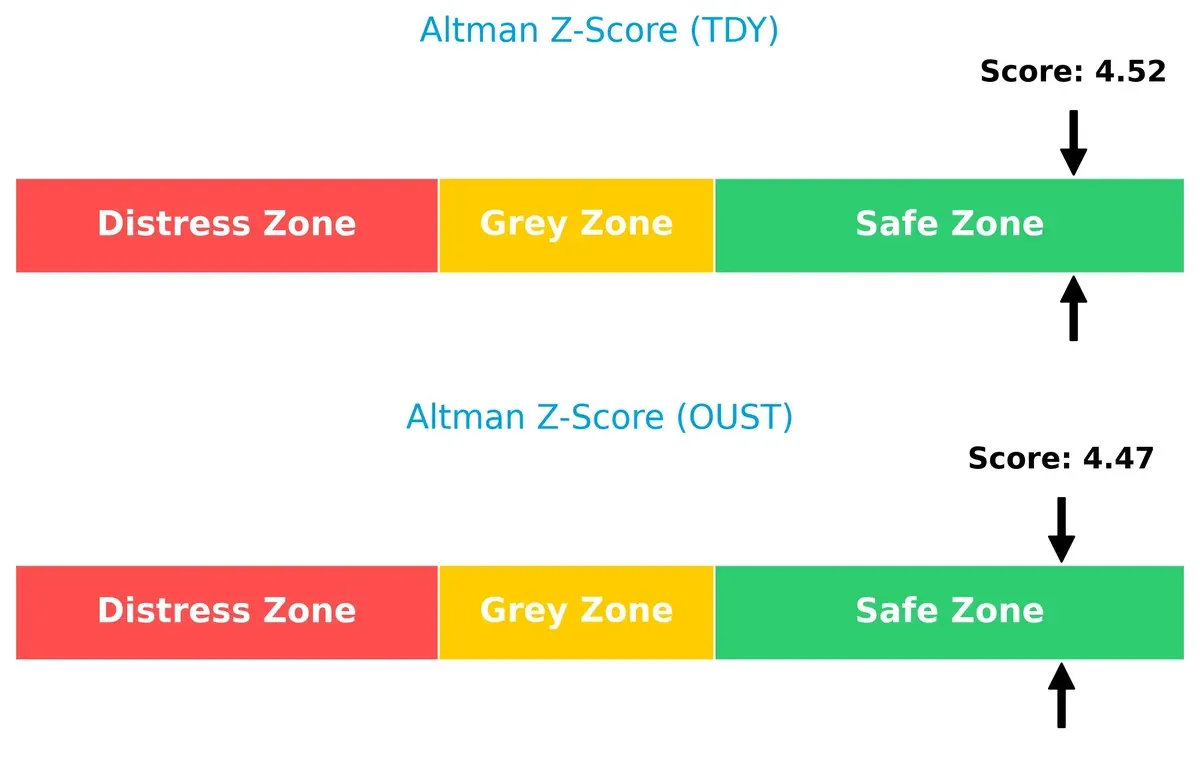
Bankruptcy Risk: Solvency Showdown
The Altman Z-Scores for both firms place them well within the safe zone, indicating strong solvency and low bankruptcy risk in the current economic cycle:
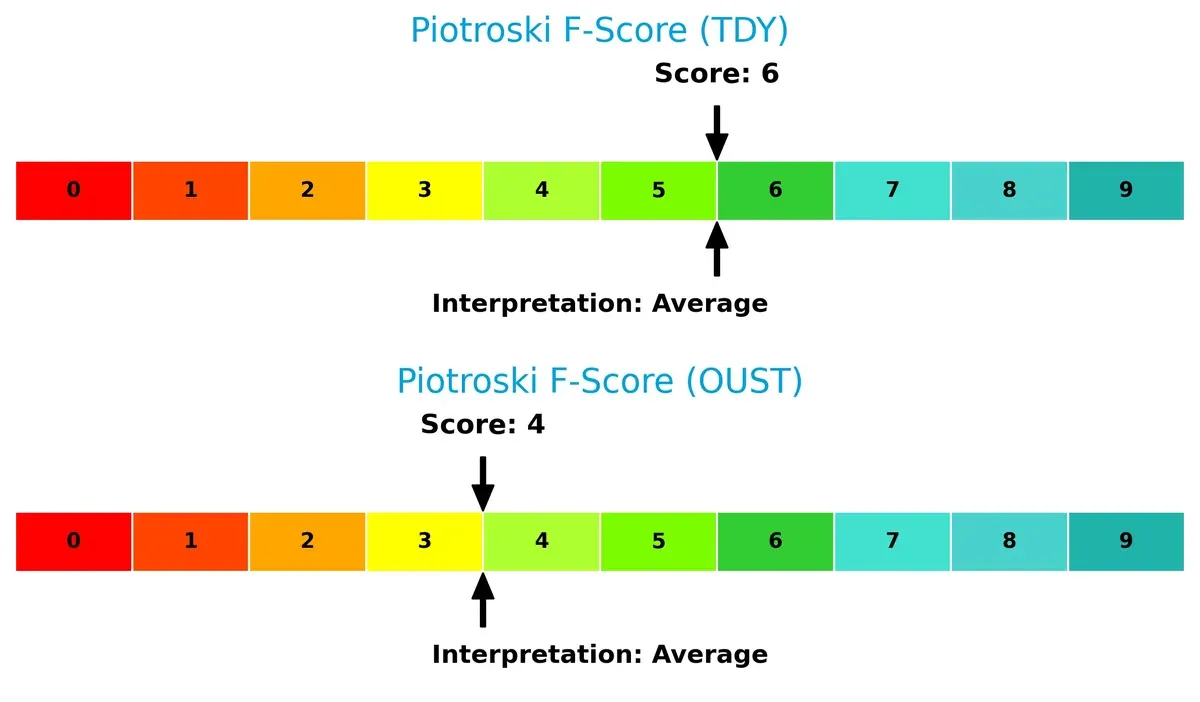
Financial Health: Quality of Operations
Teledyne Technologies scores higher on the Piotroski F-Score, signaling better financial health and operational quality. Ouster’s lower score suggests internal weaknesses and potential red flags in its fundamental metrics:
How are the two companies positioned?
This section dissects the operational DNA of TDY and OUST by comparing their revenue distribution by segment and internal dynamics. The goal is to confront their economic moats and identify which model offers the most resilient competitive advantage today.
Revenue Segmentation: The Strategic Mix
The following visual comparison dissects how Teledyne Technologies and Ouster diversify their income streams and where their primary sector bets lie:
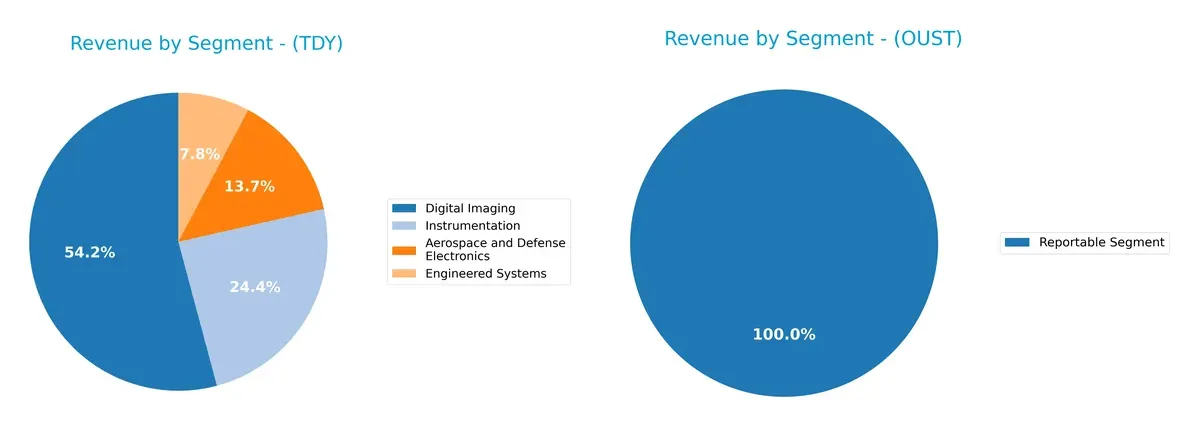
Teledyne dominates with a broad portfolio: Digital Imaging anchors at $3.07B, followed by Instrumentation at $1.38B. Aerospace and Defense Electronics and Engineered Systems add scale and diversification. Ouster, by contrast, pivots on a single $111M segment labeled “Reportable Segment,” signaling concentration risk and limited ecosystem lock-in. Teledyne’s mix suggests infrastructure dominance and resilience; Ouster’s narrow base demands careful monitoring amid market volatility.
Strengths and Weaknesses Comparison
This table compares the Strengths and Weaknesses of Teledyne Technologies (TDY) and Ouster (OUST):
TDY Strengths
- Diversified revenue across Aerospace, Digital Imaging, Instrumentation, and Engineered Systems
- Favorable net margin at 14.63%
- Strong current and quick ratios above 1.0
- Low debt-to-assets at 16.19% supports financial stability
- Global presence with significant US, Europe, and Asia revenue
- High fixed asset turnover indicates efficient asset use
OUST Strengths
- Favorable current and quick ratios indicate strong short-term liquidity
- Low debt-to-assets at 7.33% reduces financial risk
- Positive PE ratio reflects some market valuation support
- Segment focus simplifies operational strategy
- Presence in Americas, Asia Pacific, and EMEA regions supports geographic reach
- Favorable fixed asset turnover shows asset efficiency
TDY Weaknesses
- Unfavorable ROE at 8.51% below cost of equity
- PE ratio high at 27.35 suggests potential overvaluation
- Asset turnover low at 0.4 limits revenue generation per asset
- No dividend yield may deter income investors
- Some unfavorable ratios reduce overall financial robustness
- Moderate leverage could increase risk in downturns
OUST Weaknesses
- Substantial negative net margin at -87.35% indicates ongoing losses
- Negative ROE and ROIC highlight poor capital returns
- High WACC at 17.33% raises cost of capital concerns
- Negative interest coverage signals financial stress
- Unfavorable P/B ratio at 3.15 suggests overvaluation risks
- Lack of profitability undermines market competitiveness
Teledyne demonstrates diversified operations and solid financial health but faces challenges in capital efficiency and valuation. Ouster’s liquidity and asset use show promise, yet its profitability and cost of capital deficits pose significant strategic hurdles.
The Moat Duel: Analyzing Competitive Defensibility
A structural moat alone defends long-term profits from relentless competition erosion. Let’s examine how each company sustains this vital edge:
Teledyne Technologies Incorporated: Diversified Industrial and Aerospace Moat
Teledyne’s moat stems from intangible assets and system integration expertise. Its stable 19% EBIT margin signals robust pricing power. New aerospace and defense contracts in 2026 could deepen this advantage.
Ouster, Inc.: Emerging Lidar Innovator with Technology Moat
Ouster relies on proprietary lidar technology and rapid innovation. Unlike Teledyne, it burns cash but grows revenue 33% annually. Expansion in autonomous vehicles could strengthen its position despite current margin pressure.
Verdict: Established Diversification vs. High-Growth Innovation
Teledyne’s wider moat benefits from diversified markets and margin resilience. Ouster’s deeper technology moat shows promise but risks capital inefficiency. Teledyne is better equipped today to defend market share amid competitive pressures.
Which stock offers better returns?
The past year shows clear divergences in price dynamics between Teledyne Technologies and Ouster, with strong gains and recent shifts in trading behavior shaping their trajectories.
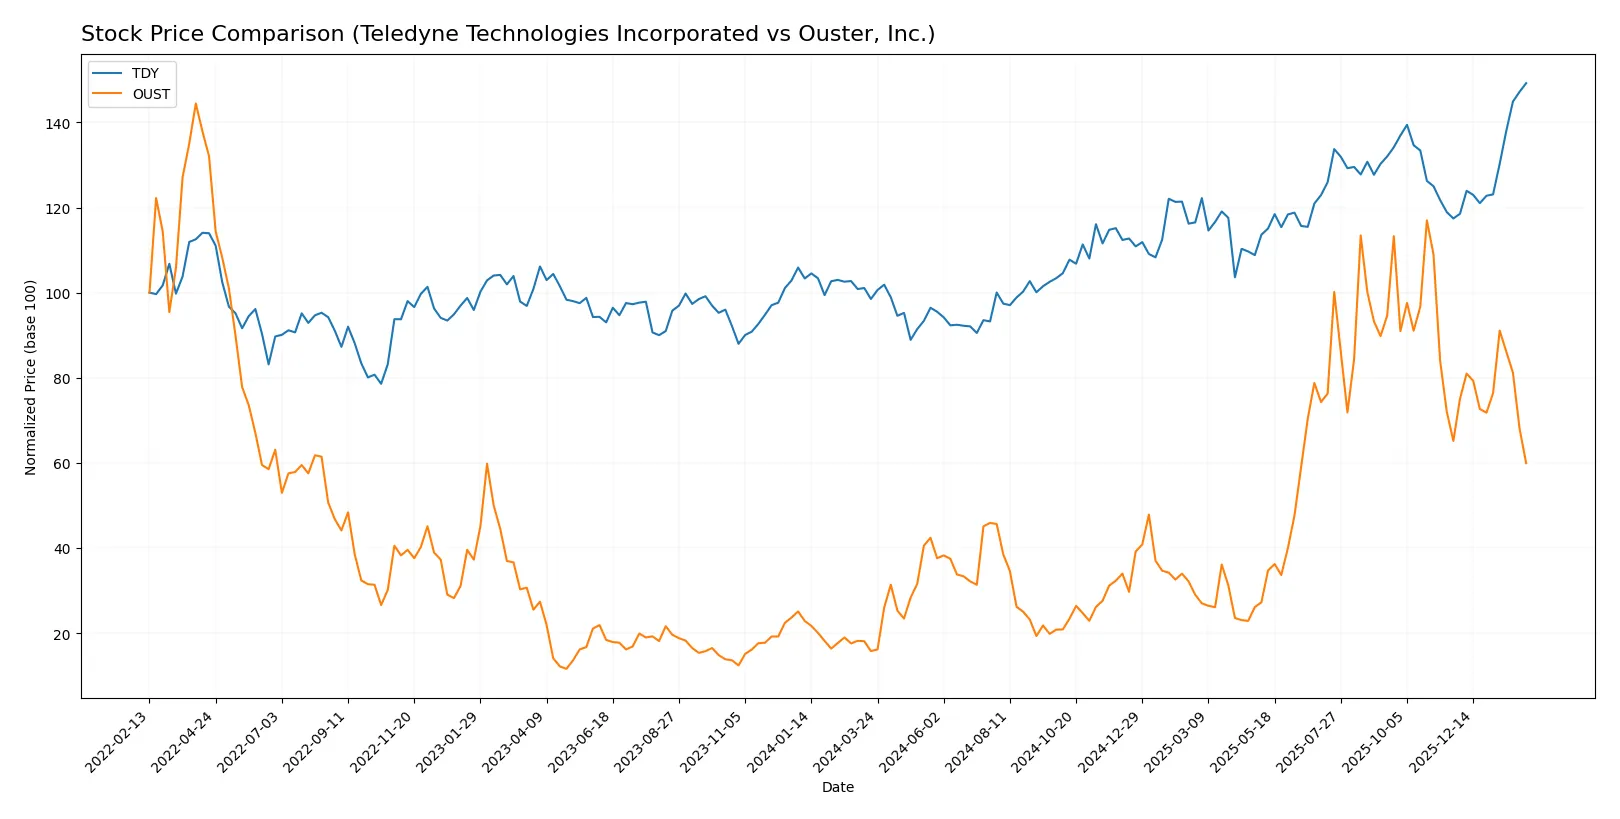
Trend Comparison
Teledyne Technologies recorded a 51.5% price increase over 12 months, marking a bullish trend with accelerating momentum. The stock hit a high of 628.89 and a low of 374.64, exhibiting substantial volatility (std deviation 59.85).
Ouster surged 280.29% over the same period, also bullish but with decelerating momentum. It traded between 4.82 and 35.8, showing lower volatility (std deviation 8.52). Recent months revealed an 8.03% decline, indicating short-term weakness.
Ouster delivered the highest overall return, outperforming Teledyne despite recent downward pressure. Both show distinct trend phases and volatility profiles.
Target Prices
Analysts present a constructive consensus on Teledyne Technologies and Ouster, reflecting optimism despite recent price volatility.
| Company | Target Low | Target High | Consensus |
|---|---|---|---|
| Teledyne Technologies Incorporated | 599 | 720 | 638.5 |
| Ouster, Inc. | 33 | 39 | 36.67 |
Teledyne’s target consensus at 638.5 slightly exceeds its current price of 627.5, signaling moderate upside potential. Ouster’s consensus of 36.67 nearly doubles its current 18.32 price, indicating strong growth expectations despite elevated risk.

Don’t Let Luck Decide Your Entry Point
Optimize your entry points with our advanced ProRealTime indicators. You’ll get efficient buy signals with precise price targets for maximum performance. Start outperforming now!
How do institutions grade them?
This section summarizes the latest institutional grades assigned to Teledyne Technologies Incorporated and Ouster, Inc.:
Teledyne Technologies Incorporated Grades
The table below shows recent grades from recognized institutions covering Teledyne Technologies Incorporated:
| Grading Company | Action | New Grade | Date |
|---|---|---|---|
| Barclays | Maintain | Equal Weight | 2026-01-22 |
| Stifel | Maintain | Buy | 2026-01-22 |
| Needham | Maintain | Buy | 2026-01-22 |
| Citigroup | Maintain | Neutral | 2026-01-13 |
| Barclays | Maintain | Equal Weight | 2026-01-12 |
| Barclays | Maintain | Equal Weight | 2025-10-23 |
| Needham | Maintain | Buy | 2025-10-23 |
| Stifel | Maintain | Buy | 2025-10-23 |
| Morgan Stanley | Maintain | Equal Weight | 2025-10-15 |
| UBS | Maintain | Buy | 2025-07-24 |
Ouster, Inc. Grades
The table below shows recent grades from recognized institutions covering Ouster, Inc.:
| Grading Company | Action | New Grade | Date |
|---|---|---|---|
| Cantor Fitzgerald | Upgrade | Overweight | 2025-11-07 |
| Cantor Fitzgerald | Upgrade | Overweight | 2025-11-06 |
| WestPark Capital | Maintain | Buy | 2025-11-05 |
| Rosenblatt | Maintain | Buy | 2025-11-05 |
| WestPark Capital | Upgrade | Buy | 2025-08-13 |
| Oppenheimer | Maintain | Outperform | 2025-07-16 |
| WestPark Capital | Downgrade | Hold | 2025-06-12 |
| WestPark Capital | Upgrade | Buy | 2025-05-09 |
| Cantor Fitzgerald | Maintain | Overweight | 2025-03-21 |
| WestPark Capital | Maintain | Hold | 2025-03-21 |
Which company has the best grades?
Ouster, Inc. generally receives more positive upgrades and higher ratings such as Overweight and Outperform. Teledyne shows more neutral to moderate Buy and Equal Weight grades. This suggests Ouster currently commands stronger institutional confidence, which could influence investor sentiment and valuation trends.
Risks specific to each company
The following categories identify critical pressure points and systemic threats facing both firms in the 2026 market environment:
1. Market & Competition
Teledyne Technologies Incorporated
- Established player with diversified industrial markets and strong product portfolio; faces competition but benefits from scale and reputation.
Ouster, Inc.
- Smaller, niche player focused on digital lidar sensors; high beta indicates vulnerability to market swings and competitive pressure from larger tech firms.
2. Capital Structure & Debt
Teledyne Technologies Incorporated
- Low debt-to-equity ratio (0.24) with strong interest coverage (19.47), signaling prudent leverage and manageable debt servicing.
Ouster, Inc.
- Very low debt (0.11 D/E) but negative interest coverage (-51.94) due to losses, raising concerns about operational cash flow and debt sustainability.
3. Stock Volatility
Teledyne Technologies Incorporated
- Beta near 1.0 (1.014), indicating stock moves roughly with the market; volatility is moderate and manageable.
Ouster, Inc.
- High beta (2.903) signals extreme stock price swings, increasing investor risk and potential for sudden value erosion.
4. Regulatory & Legal
Teledyne Technologies Incorporated
- Operates in regulated defense and aerospace sectors, requiring compliance but with established risk management processes.
Ouster, Inc.
- Emerging technology with potential regulatory scrutiny on lidar applications; less track record in managing complex compliance environments.
5. Supply Chain & Operations
Teledyne Technologies Incorporated
- Large scale and diversified suppliers reduce disruption risk; however, asset turnover (0.4) is low, signaling potential operational inefficiency.
Ouster, Inc.
- Smaller operations with higher asset turnover challenges; reliance on limited suppliers could amplify supply chain risks in volatile markets.
6. ESG & Climate Transition
Teledyne Technologies Incorporated
- Progressive in integrating ESG in aerospace and defense; energy systems focus aligns with climate transition trends.
Ouster, Inc.
- Early-stage company with limited ESG footprint; must invest to meet increasing investor and regulatory ESG demands.
7. Geopolitical Exposure
Teledyne Technologies Incorporated
- Global operations in defense and aerospace subject to geopolitical tensions but benefits from U.S. government contracts as a buffer.
Ouster, Inc.
- Primarily U.S.-based but exposed to global tech supply chains; geopolitical tensions could disrupt component sourcing and sales.
Which company shows a better risk-adjusted profile?
Teledyne’s prudent capital structure, moderate stock volatility, and diversified operations present a stronger risk-adjusted profile. Ouster’s high volatility, negative profitability metrics, and operational challenges increase investment risk. Teledyne’s Altman Z-score (4.52) confirms its safer financial footing compared to Ouster (4.47) despite similar bankruptcy risk zones. Ouster’s negative net margin (-87%) highlights immediate profitability risk, while Teledyne maintains a solid net margin (14.6%). These factors justify my cautious stance favoring Teledyne under current market conditions.
Final Verdict: Which stock to choose?
Teledyne Technologies (TDY) excels as a cash-generating powerhouse with solid operational efficiency and a robust balance sheet. Its growing profitability signals improving economic value, though its current ROIC still trails WACC—a point of vigilance. TDY fits well in portfolios seeking steady industrial innovation and moderate growth exposure.
Ouster (OUST) offers a strategic moat rooted in cutting-edge lidar technology and rapid revenue expansion. Its recurring R&D investments support future growth but come with heightened risk and negative profitability metrics compared to TDY. OUST suits investors with a higher risk tolerance pursuing aggressive growth and technological disruption.
If you prioritize stable cash flow and improving profitability, TDY is the compelling choice due to its efficiency and financial resilience. However, if you seek high-growth potential and can accept volatility, OUST offers superior top-line momentum and innovation prospects, though with greater financial uncertainty.
Disclaimer: Investment carries a risk of loss of initial capital. The past performance is not a reliable indicator of future results. Be sure to understand risks before making an investment decision.
Go Further
I encourage you to read the complete analyses of Teledyne Technologies Incorporated and Ouster, Inc. to enhance your investment decisions: