Home > Comparison > Technology > TEL vs OUST
The strategic rivalry between TE Connectivity Ltd. and Ouster, Inc. shapes the technology sector’s hardware, equipment, and parts landscape. TE Connectivity operates as a diversified industrial powerhouse with broad global reach and multiple business segments. Ouster, by contrast, is a nimble innovator specializing in high-resolution digital lidar sensors. This analysis explores their contrasting models to identify which offers superior risk-adjusted returns for a balanced, forward-looking portfolio.
Table of contents
Companies Overview
TE Connectivity and Ouster stand as key players in the hardware and equipment sector, each shaping distinct technology frontiers.
TE Connectivity Ltd.: Global Connectivity Leader
TE Connectivity dominates with a diversified product range in connectivity and sensor solutions. Its revenue stems from three segments: Transportation, Industrial, and Communications Solutions, selling across 140 countries. In 2026, the firm focuses on expanding industrial and communication components, leveraging its broad global footprint to maintain steady growth.
Ouster, Inc.: High-Resolution Lidar Innovator
Ouster specializes in advanced digital lidar sensors and software for 3D vision applications in machinery and vehicles. Its revenue engine relies on cutting-edge scanning and solid-state sensors. In 2026, the company aims to scale production and enhance sensor performance, betting on high-growth markets like autonomous systems and robotics.
Strategic Collision: Similarities & Divergences
Both firms compete in hardware solutions, yet TE Connectivity pursues a broad industrial ecosystem, while Ouster emphasizes niche innovation in lidar technology. Their battleground centers on sensor integration—TE through diversified components, Ouster through specialized 3D vision. Investors face contrasting profiles: TE offers stability and scale, whereas Ouster presents higher volatility with growth potential.
Income Statement Comparison
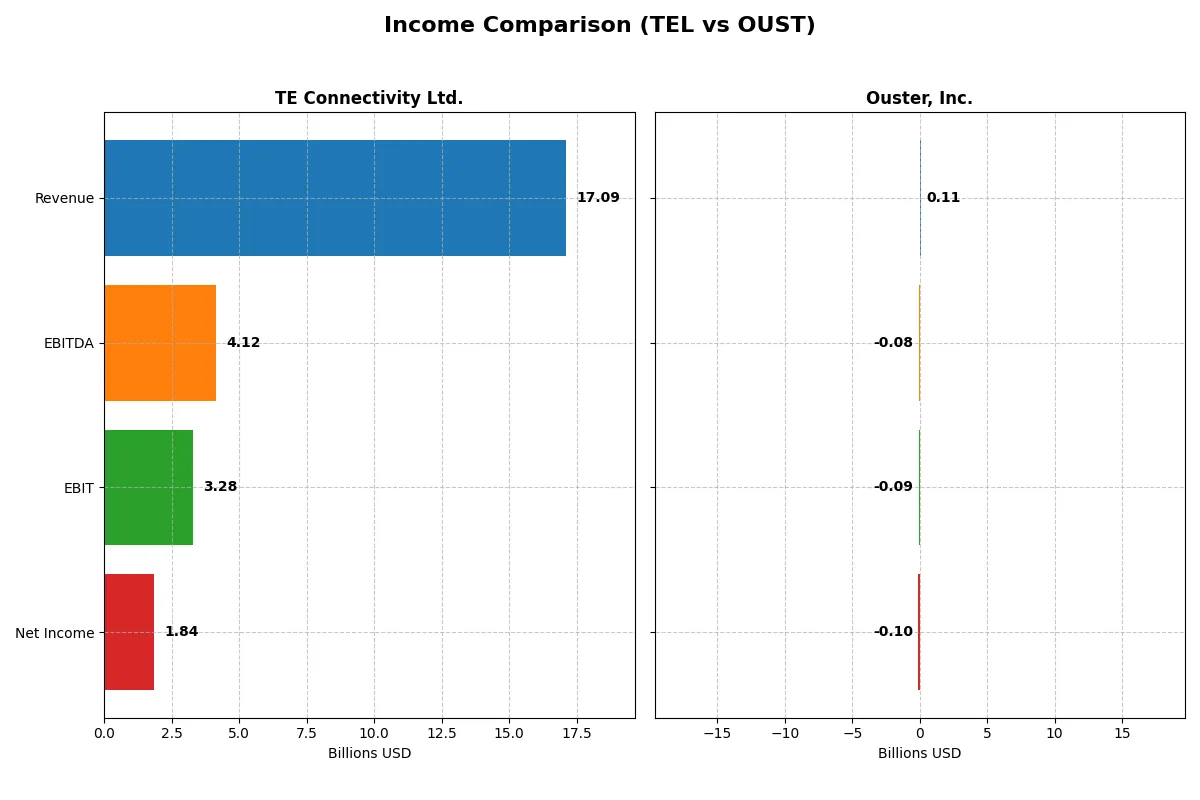
This data dissects the core profitability and scalability of both corporate engines, revealing who dominates the bottom line through their most recent fiscal performances:
| Metric | TE Connectivity Ltd. (TEL) | Ouster, Inc. (OUST) |
|---|---|---|
| Revenue | 17.1B | 111.1M |
| Cost of Revenue | 11.2B | 70.6M |
| Operating Expenses | 2.7B | 144.6M |
| Gross Profit | 5.9B | 40.5M |
| EBITDA | 4.1B | -79.9M |
| EBIT | 3.3B | -94.7M |
| Interest Expense | 77.0M | 1.8M |
| Net Income | 1.8B | -97.0M |
| EPS | 6.2 | -2.08 |
| Fiscal Year | 2025 | 2024 |
Income Statement Analysis: The Bottom-Line Duel
This income statement comparison reveals which company operates its business more efficiently and drives better profitability.
TE Connectivity Ltd. Analysis
TE Connectivity’s revenue climbed steadily to $17.1B in 2025, up 7.85% from 2024, reflecting consistent top-line growth. Gross margin remains robust at 34.6%, signaling strong production efficiency. However, net income declined sharply to $1.84B, shrinking net margin to 10.8%. This indicates rising costs or tax impacts undermining bottom-line momentum despite solid operating income growth.
Ouster, Inc. Analysis
Ouster’s revenue jumped 33.4% to $111M in 2024, showcasing rapid expansion typical for a growth-stage tech firm. Gross margin improved to 36.4%, a positive sign of scaling production. Yet, the company remains deeply unprofitable with a net loss of $97M, reflecting heavy operating expenses and an EBIT margin of -85.2%. Nonetheless, Ouster’s net margin and EPS improved significantly year-over-year, evidencing improving cost control.
Growth Scale vs. Profitability Strength
TE Connectivity delivers scale and solid gross margins but struggles to maintain net income growth, signaling pressure on its profit engine. Ouster, though far from profitable, demonstrates impressive revenue and margin improvements that hint at future profitability potential. Investors seeking stability may favor TE’s established earnings, while those prioritizing high growth might focus on Ouster’s accelerating expansion and margin gains.
Financial Ratios Comparison
These vital ratios act as a diagnostic tool to expose the underlying fiscal health, valuation premiums, and capital efficiency of the companies analyzed:
| Ratios | TE Connectivity Ltd. (TEL) | Ouster, Inc. (OUST) |
|---|---|---|
| ROE | 14.6% | -53.6% |
| ROIC | 8.8% | -50.8% |
| P/E | 35.0 | -5.9 |
| P/B | 5.12 | 3.15 |
| Current Ratio | 1.56 | 2.80 |
| Quick Ratio | 1.03 | 2.59 |
| D/E (Debt-to-Equity) | 0.52 | 0.11 |
| Debt-to-Assets | 26.1% | 7.3% |
| Interest Coverage | 41.7 | -57.1 |
| Asset Turnover | 0.68 | 0.40 |
| Fixed Asset Turnover | 3.96 | 4.54 |
| Payout Ratio | 43.6% | 0% |
| Dividend Yield | 1.25% | 0% |
| Fiscal Year | 2025 | 2024 |
Efficiency & Valuation Duel: The Vital Signs
Financial ratios act as a company’s DNA, exposing hidden risks and operational excellence that shape investor confidence and valuation.
TE Connectivity Ltd.
TE Connectivity posts a neutral 14.6% ROE and an 8.8% ROIC, reflecting moderate profitability against a slightly stretched 35.0 P/E ratio. The firm maintains a solid 1.56 current ratio and low debt-to-assets at 26.1%, signaling financial stability. With a 1.25% dividend yield, TE balances shareholder returns with steady reinvestment in R&D.
Ouster, Inc.
Ouster endures deep losses, showing a negative 53.6% ROE and -50.8% ROIC, indicating severe operational struggles. Despite a low 3.15 P/B ratio and a strong 2.8 current ratio, the company’s negative margins and zero dividend highlight elevated risk and no immediate shareholder payouts. Heavy R&D spending dominates capital allocation, aiming for long-term growth.
Premium Valuation vs. Operational Safety
TE Connectivity offers a more balanced risk-reward profile with stable profitability and prudent leverage, despite a high P/E. Ouster’s unfavorable returns and negative margins reflect substantial operational challenges. Investors preferring defensive stability may lean toward TE, while those seeking speculative growth face higher risks with Ouster.
Which one offers the Superior Shareholder Reward?
I observe TE Connectivity Ltd. (TEL) offers a more balanced distribution strategy with a 1.25% dividend yield and a 43.6% payout ratio, supported by robust free cash flow of $10.8/share. TEL also maintains buybacks, enhancing shareholder returns sustainably. In contrast, Ouster, Inc. (OUST) pays no dividends and posts negative free cash flow (-$0.8/share), focusing on reinvestment. OUST’s lack of buybacks and ongoing losses signal high risk. TEL’s combined dividend and buyback approach offers a more attractive, sustainable total return profile for 2026 investors.
Comparative Score Analysis: The Strategic Profile
The radar chart reveals the fundamental DNA and trade-offs of TE Connectivity Ltd. and Ouster, Inc., highlighting their strategic strengths and weaknesses across key financial metrics:
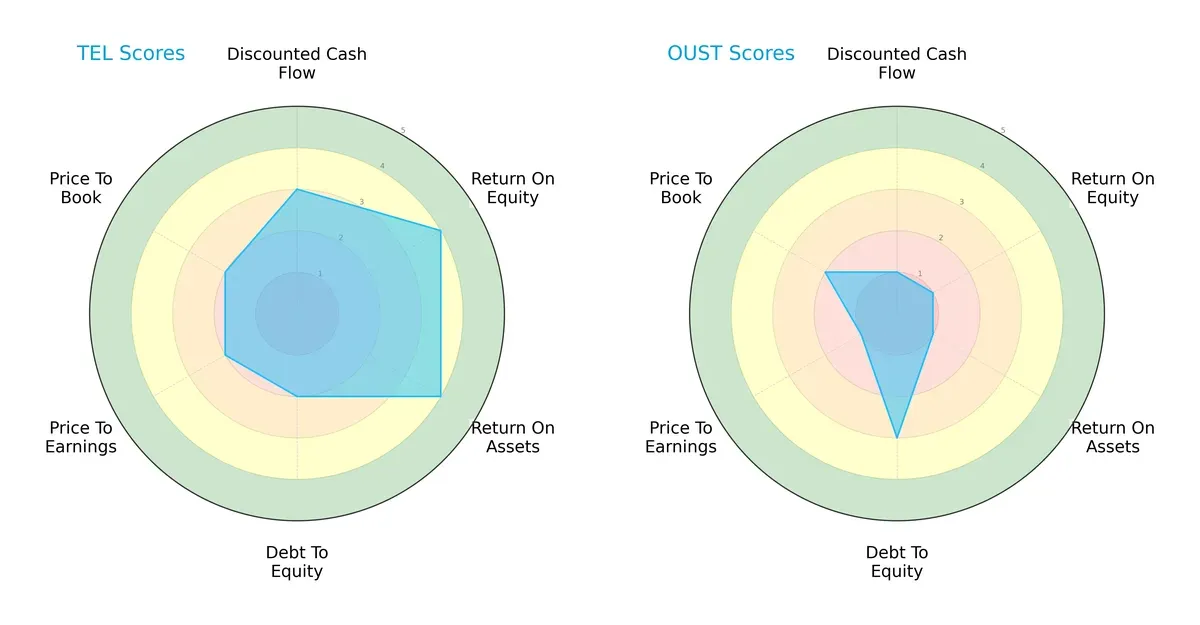
TE Connectivity Ltd. demonstrates a balanced profile with moderate DCF and valuation scores, coupled with favorable ROE and ROA, indicating efficient profit generation and asset use. Its debt-to-equity score is moderate, suggesting manageable leverage. Conversely, Ouster, Inc. relies heavily on a moderate debt-to-equity score but scores very low on profitability and valuation metrics, reflecting financial weakness and valuation challenges. TE Connectivity’s diversified strengths position it as the more stable investment.
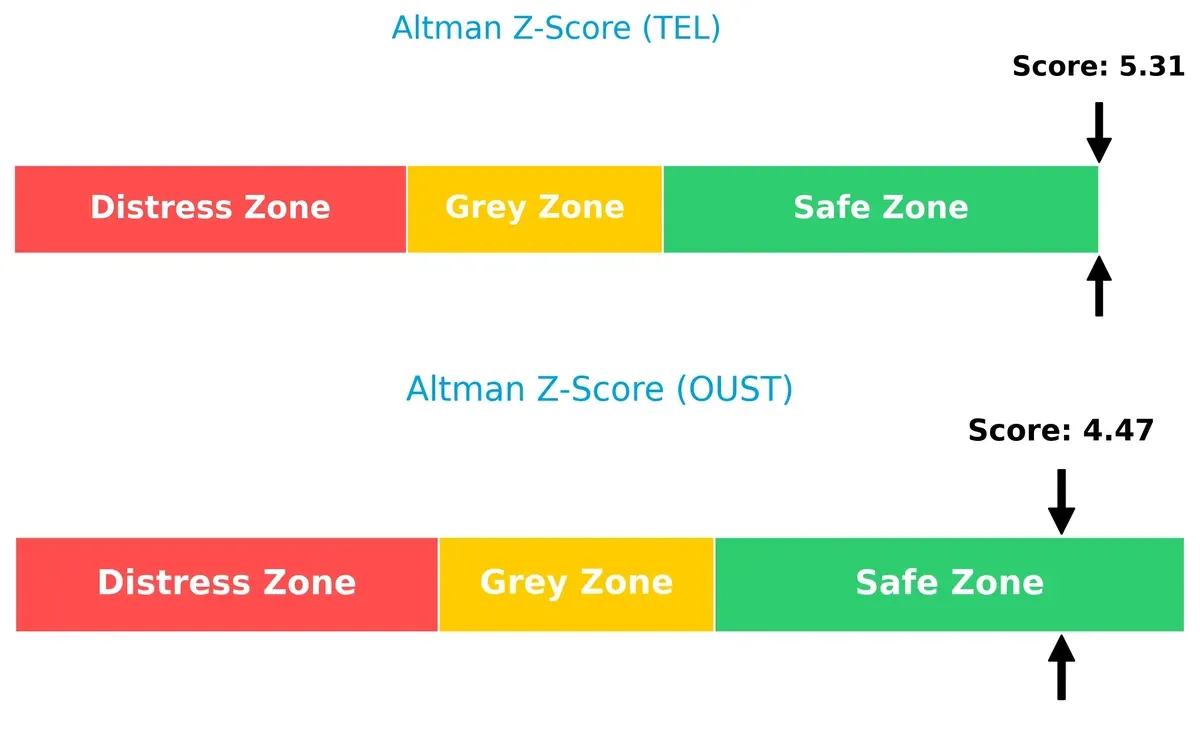
Bankruptcy Risk: Solvency Showdown
The Altman Z-Score gap shows TE Connectivity Ltd. (5.3) and Ouster, Inc. (4.5) both in the safe zone, but TE Connectivity has a clearer margin of safety, indicating stronger long-term solvency in this cycle:
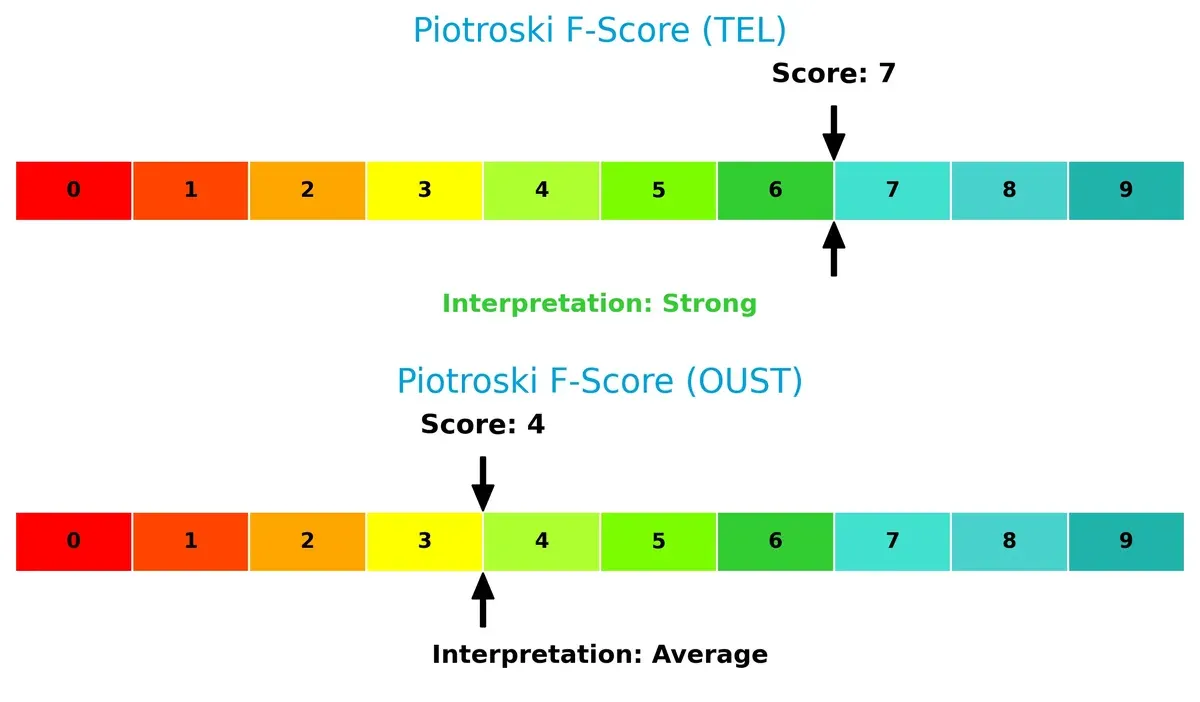
Financial Health: Quality of Operations
TE Connectivity Ltd. scores 7 on the Piotroski F-Score, signaling strong financial health and operational quality. Ouster, Inc. scores 4, showing average health with potential red flags in internal metrics when compared side-by-side:
How are the two companies positioned?
This section dissects the operational DNA of TEL and OUST by comparing their revenue distribution and internal dynamics. It confronts their economic moats to reveal which model offers the most resilient, sustainable competitive advantage today.
Revenue Segmentation: The Strategic Mix
This visual comparison dissects how TE Connectivity Ltd. and Ouster, Inc. diversify their income streams and highlights their primary sector bets:
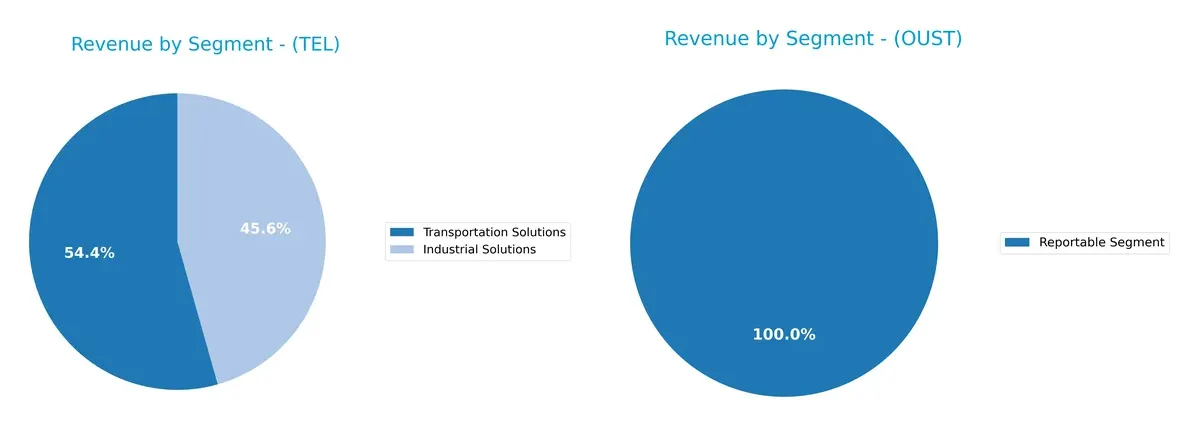
TE Connectivity anchors revenue in two major segments: Transportation Solutions at $9.39B and Industrial Solutions at $7.87B, showcasing a balanced yet concentrated portfolio. Ouster relies almost entirely on a single segment, Reportable Segment, generating $111M in 2024. TE’s diversified mix reduces concentration risk and leverages infrastructure dominance, while Ouster’s narrow focus signals higher vulnerability but potential for rapid scaling in its niche.
Strengths and Weaknesses Comparison
This table compares the strengths and weaknesses of TE Connectivity Ltd. and Ouster, Inc.:
TE Connectivity Ltd. Strengths
- Diversified revenue across Industrial and Transportation Solutions
- Solid global presence with consistent sales in China, US, and Europe
- Favorable net margin at 10.78%
- Strong liquidity ratios (current ratio 1.56, quick ratio 1.03)
- Low debt-to-assets at 26.12% with high interest coverage (42.61)
Ouster, Inc. Strengths
- Favorable current and quick ratios (2.8 and 2.59) indicate strong liquidity
- Very low debt-to-assets (7.33%) and debt/equity (0.11) reduce financial risk
- Favorable price-to-earnings ratio despite negative earnings
- Higher fixed asset turnover (4.54) suggests efficient use of fixed assets
TE Connectivity Ltd. Weaknesses
- High P/E (35.0) and P/B (5.12) suggest overvaluation risk
- ROIC (8.82%) slightly below WACC (9.07%) implies weak capital returns
- Neutral ROE (14.64%) limits profitability upside
- Asset turnover moderate at 0.68
- Limited growth from Communications Solutions segment
Ouster, Inc. Weaknesses
- Negative margins (net margin -87.35%) and returns (ROE -53.64%, ROIC -50.84%) indicate unprofitability
- High WACC (17.33%) increases capital costs
- Negative interest coverage (-51.94) signals financial stress
- Low asset turnover (0.4) limits operational efficiency
- No dividend yield and unfavorable P/B (3.15) highlight valuation concerns
TE Connectivity shows balanced strengths in profitability, liquidity, and global reach, tempered by valuation and capital efficiency concerns. Ouster benefits from strong liquidity and low leverage but faces significant profitability and financial stability challenges. These profiles suggest fundamentally different strategic positions in their respective markets.
The Moat Duel: Analyzing Competitive Defensibility
A durable structural moat protects long-term profits from relentless competitive erosion. Here is how these two tech firms stack up:
TE Connectivity Ltd.: Intangible Assets Moat
TE Connectivity leverages deep industry expertise and global scale to maintain stable, favorable EBIT margins near 19%. However, declining ROIC signals weakening capital efficiency in 2026.
Ouster, Inc.: Innovation-Driven Growth Moat
Ouster’s moat stems from cutting-edge lidar sensor technology and rapid revenue growth of 33%, but persistent negative margins reveal a fragile economic moat still under construction.
Innovation Momentum vs. Established Scale
While both firms currently shed value, TE Connectivity’s intangible assets provide a wider moat through diversified global sales. Ouster’s faster ROIC growth hints at potential, but TE better defends market share today.
Which stock offers better returns?
Over the past 12 months, TE Connectivity Ltd. and Ouster, Inc. both experienced strong gains, with Ouster showing a more pronounced price surge and recent trading indicating seller dominance.
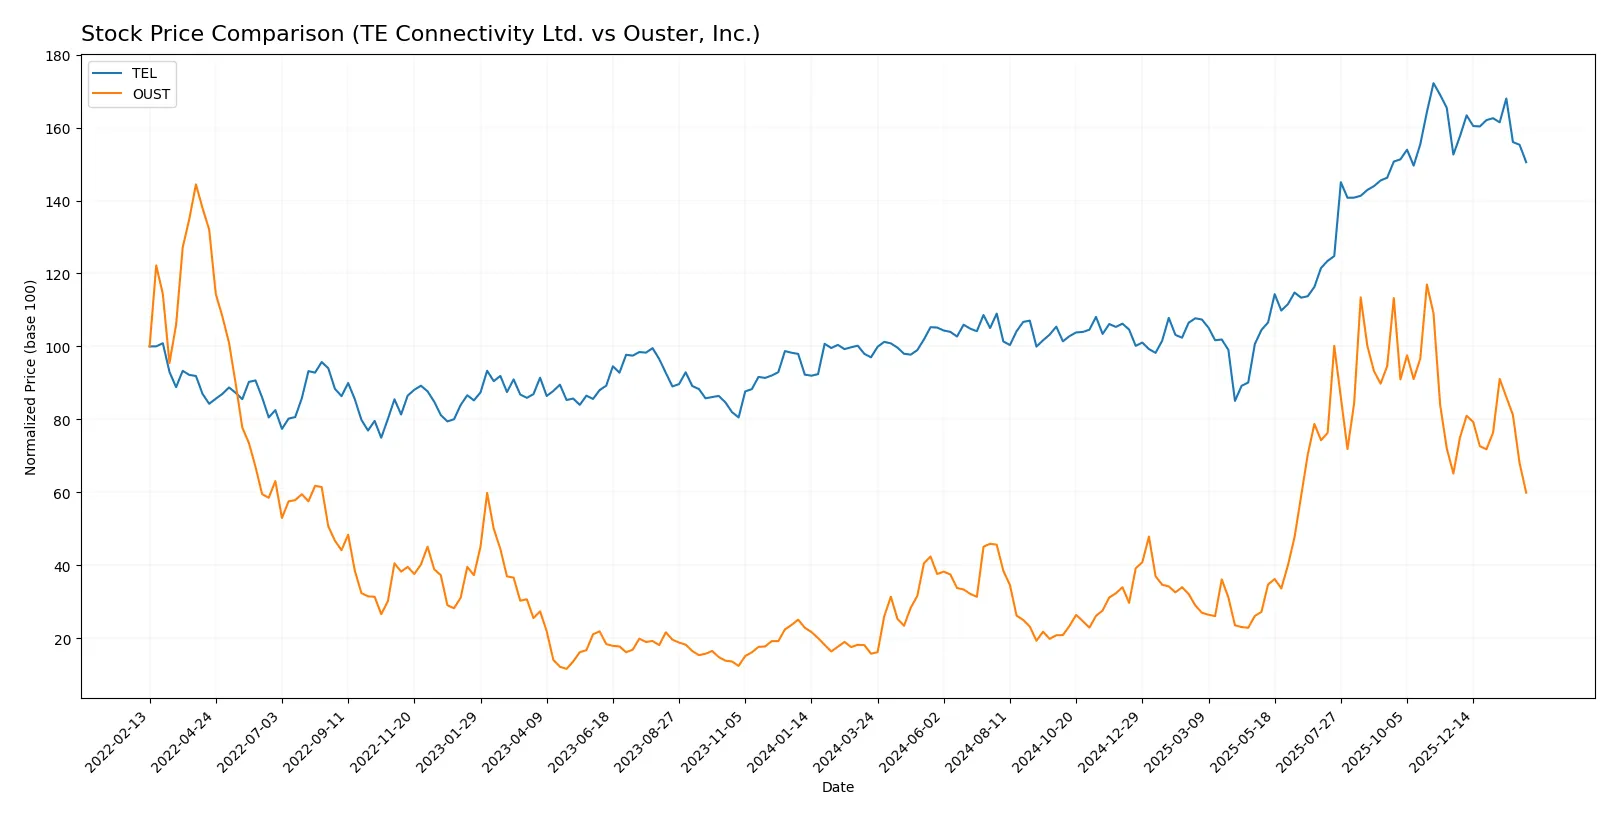
Trend Comparison
TE Connectivity Ltd. posted a 55.17% price increase over the past year, signaling a bullish trend with decelerating momentum and high volatility, peaking at 247.01 and bottoming at 122.0.
Ouster, Inc. surged 280.29%, reflecting a strong bullish trend with deceleration and lower volatility. Its highest price reached 35.8, and the lowest was 4.82 during the year.
Comparing both stocks, Ouster delivered the highest market performance with a 280.29% gain versus TE Connectivity’s 55.17% over the last 12 months.
Target Prices
Analysts present a clear upside potential for TE Connectivity Ltd. and Ouster, Inc. based on their target price consensus.
| Company | Target Low | Target High | Consensus |
|---|---|---|---|
| TE Connectivity Ltd. | 238 | 306 | 270.29 |
| Ouster, Inc. | 33 | 39 | 36.67 |
The consensus target prices for TEL and OUST exceed their current stock prices by 25% and 99%, respectively, indicating strong analyst optimism. Both stocks show potential for significant appreciation relative to their trading levels.

Don’t Let Luck Decide Your Entry Point
Optimize your entry points with our advanced ProRealTime indicators. You’ll get efficient buy signals with precise price targets for maximum performance. Start outperforming now!
How do institutions grade them?
TE Connectivity Ltd. Grades
The table below summarizes recent grade actions by major grading companies for TE Connectivity Ltd.:
| Grading Company | Action | New Grade | Date |
|---|---|---|---|
| Oppenheimer | Upgrade | Outperform | 2026-01-27 |
| Barclays | Maintain | Overweight | 2026-01-23 |
| Wells Fargo | Maintain | Equal Weight | 2026-01-22 |
| Truist Securities | Maintain | Hold | 2026-01-22 |
| UBS | Maintain | Buy | 2026-01-14 |
Ouster, Inc. Grades
The table below summarizes recent grade actions by major grading companies for Ouster, Inc.:
| Grading Company | Action | New Grade | Date |
|---|---|---|---|
| Cantor Fitzgerald | Upgrade | Overweight | 2025-11-07 |
| Cantor Fitzgerald | Upgrade | Overweight | 2025-11-06 |
| WestPark Capital | Maintain | Buy | 2025-11-05 |
| Rosenblatt | Maintain | Buy | 2025-11-05 |
| WestPark Capital | Upgrade | Buy | 2025-08-13 |
Which company has the best grades?
TE Connectivity Ltd. holds consistently higher grades like Outperform and Buy from top firms. Ouster, Inc. features mostly Buy and Overweight ratings but fewer top-tier upgrades. Investors may view TE Connectivity as having stronger institutional confidence.
Risks specific to each company
The following categories identify the critical pressure points and systemic threats facing both firms in the 2026 market environment:
1. Market & Competition
TE Connectivity Ltd.
- Established global player with diversified segments in transportation, industrial, and communications; faces intense hardware competition.
Ouster, Inc.
- Emerging lidar sensor specialist in a niche but highly competitive and rapidly evolving tech market.
2. Capital Structure & Debt
TE Connectivity Ltd.
- Moderate debt-to-equity ratio (0.52) with strong interest coverage (42.61) indicates stable capital structure.
Ouster, Inc.
- Low leverage (debt-to-equity 0.11) but negative interest coverage (-51.94) reflects financial stress and reliance on external funding.
3. Stock Volatility
TE Connectivity Ltd.
- Beta of 1.235 suggests moderate volatility, aligned with broader tech hardware sector trends.
Ouster, Inc.
- High beta of 2.903 signals significant stock price swings, increasing investment risk.
4. Regulatory & Legal
TE Connectivity Ltd.
- Global operations expose company to varied regulatory regimes but with established compliance frameworks.
Ouster, Inc.
- As a US-based innovator, faces emerging regulations on lidar technology and data privacy risks.
5. Supply Chain & Operations
TE Connectivity Ltd.
- Extensive global supply chain with proven resilience but potential exposure to geopolitical disruptions.
Ouster, Inc.
- Smaller scale and newer supply chains increase operational risks and vulnerability to component shortages.
6. ESG & Climate Transition
TE Connectivity Ltd.
- Large firm with mature ESG initiatives but must continuously adapt to stricter climate regulations.
Ouster, Inc.
- Innovation-driven but limited ESG track record; potential for reputational risks if standards are unmet.
7. Geopolitical Exposure
TE Connectivity Ltd.
- Operations span multiple regions, exposing it to geopolitical tensions but also providing diversification.
Ouster, Inc.
- Primarily US-focused, less diversified geographically but reliant on international markets for growth.
Which company shows a better risk-adjusted profile?
TE Connectivity Ltd. demonstrates a better risk-adjusted profile than Ouster, Inc. TEL’s diversified global footprint, stable capital structure, and strong financial health reduce downside risks. Conversely, Ouster’s high volatility, negative profitability metrics, and weaker financial scores highlight significant investment risks. The stark contrast in interest coverage—TEL’s 42.61 versus OUST’s -51.94—underscores Ouster’s acute financial stress. This makes TE Connectivity the more prudent choice amid 2026’s market uncertainties.
Final Verdict: Which stock to choose?
TE Connectivity Ltd. (TEL) demonstrates a compelling strength in operational efficiency and cash flow generation. Its superpower lies in a robust balance sheet and steady income quality, making it a reliable cash machine. The main point of vigilance is its elevated valuation multiples, which might limit upside in volatile markets. TEL suits portfolios focused on stable, moderate growth with income potential.
Ouster, Inc. (OUST) leverages a strategic moat in rapid innovation and revenue growth within the emerging lidar technology sector. Its key advantage is the growth trajectory and scalable R&D, though it carries higher risk given persistent losses and negative profitability metrics. Compared to TEL, OUST offers a higher-risk, higher-reward profile, fitting portfolios geared toward aggressive growth and speculative innovation plays.
If you prioritize capital preservation and consistent cash flow, TEL is the compelling choice due to its operational resilience and financial stability. However, if you seek high-growth exposure with a tolerance for volatility, OUST offers better growth momentum and innovation potential. Both present analytical scenarios aligned with distinct investor risk appetites and strategic goals.
Disclaimer: Investment carries a risk of loss of initial capital. The past performance is not a reliable indicator of future results. Be sure to understand risks before making an investment decision.
Go Further
I encourage you to read the complete analyses of TE Connectivity Ltd. and Ouster, Inc. to enhance your investment decisions: