Home > Comparison > Technology > SANM vs OUST
The strategic rivalry between Sanmina Corporation and Ouster, Inc. shapes the competitive landscape of the hardware, equipment, and parts sector. Sanmina, a capital-intensive manufacturing powerhouse with a diverse integrated solutions portfolio, contrasts sharply with Ouster’s innovative, high-tech lidar sensor design and software focus. This analysis weighs Sanmina’s scale and breadth against Ouster’s cutting-edge growth potential to identify the superior risk-adjusted investment trajectory for a diversified portfolio.
Table of contents
Companies Overview
Sanmina and Ouster represent two distinct pillars in the hardware and equipment sector, each commanding attention through unique technological contributions.
Sanmina Corporation: Integrated Manufacturing Powerhouse
Sanmina dominates as a global provider of integrated manufacturing solutions. It generates revenue through comprehensive services, including product design, assembly, supply chain management, and after-market support. In 2026, Sanmina strategically focuses on expanding its footprint in defense, aerospace, and cloud solutions industries, leveraging its scale and diversified capabilities to strengthen its competitive moat.
Ouster, Inc.: High-Resolution Lidar Innovator
Ouster specializes in designing and manufacturing digital lidar sensors and software, enabling 3D vision for vehicles, robots, and infrastructure. Its revenue stems primarily from advanced scanning and solid-state flash sensors. In 2026, Ouster emphasizes product innovation and scaling its technology adoption in autonomous systems, seeking to carve out a niche in the emerging lidar market despite its smaller size and higher volatility.
Strategic Collision: Similarities & Divergences
Both companies operate in hardware, but Sanmina pursues a broad manufacturing ecosystem, while Ouster innovates within a focused sensor niche. Their main battleground lies in industrial tech applications, where Sanmina’s scale contrasts with Ouster’s cutting-edge sensor technology. This divergence creates distinct investment profiles: Sanmina offers stability and diversification; Ouster promises growth potential marked by higher risk.
Income Statement Comparison
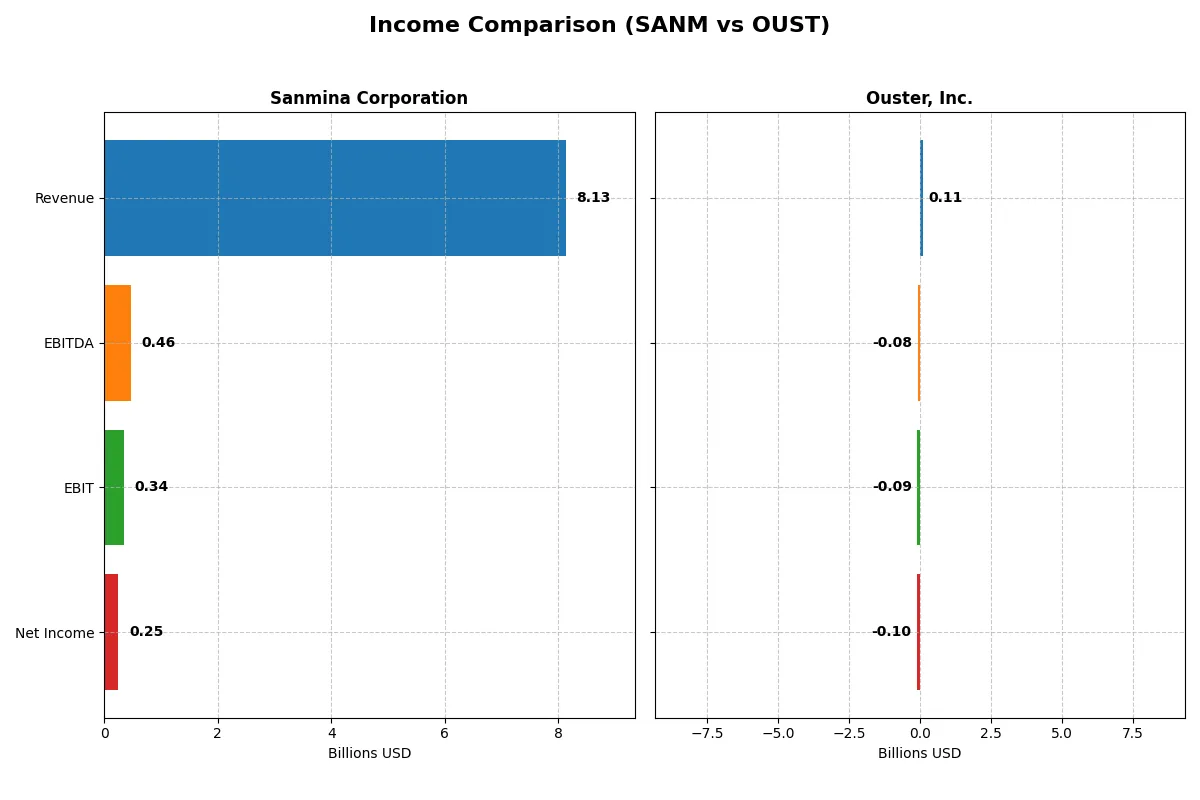
This data dissects the core profitability and scalability of both corporate engines to reveal who dominates the bottom line:
| Metric | Sanmina Corporation (SANM) | Ouster, Inc. (OUST) |
|---|---|---|
| Revenue | 8.13B | 111.1M |
| Cost of Revenue | 7.41B | 70.6M |
| Operating Expenses | 362M | 145M |
| Gross Profit | 716M | 40.5M |
| EBITDA | 463M | -79.9M |
| EBIT | 344M | -94.7M |
| Interest Expense | 4.3M | 1.8M |
| Net Income | 246M | -97.0M |
| EPS | 4.56 | -2.08 |
| Fiscal Year | 2025 | 2024 |
Income Statement Analysis: The Bottom-Line Duel
This income statement comparison reveals the true efficiency and profitability momentum driving each company’s financial engine.
Sanmina Corporation Analysis
Sanmina’s revenue rose steadily to 8.13B in 2025, showing 7.4% growth over the prior year. Net income softened slightly to 246M, reflecting a modest 3.03% net margin. Gross margin holds steady at 8.81%, while EBIT margin dipped slightly to 4.23%. Despite stable profitability, operating expenses rose in line with revenue, tempering EBIT growth.
Ouster, Inc. Analysis
Ouster’s revenue surged 33.4% to 111M in 2024, reflecting rapid expansion from a smaller base. Gross margin impresses at 36.4%, but EBIT margin stays deeply negative at -85.2%, driven by high R&D and operating costs. Net losses narrowed to 97M with an improving net margin trend. The company shows strong top-line momentum but struggles to convert growth into profits.
Margin Stability vs. Growth Surge
Sanmina delivers consistent revenue scale with stable but modest margins, while Ouster exhibits explosive growth paired with significant losses. Sanmina’s fundamental strength lies in steady profitability and controlled interest expense. Ouster’s profile appeals to growth-focused investors willing to tolerate ongoing losses for rapid expansion potential. The choice depends on risk tolerance and investment horizon.
Financial Ratios Comparison
These vital ratios act as a diagnostic tool to expose underlying fiscal health, valuation premiums, and capital efficiency for the companies compared below:
| Ratios | Sanmina Corporation (SANM) | Ouster, Inc. (OUST) |
|---|---|---|
| ROE | 10.4% | -53.6% |
| ROIC | 9.0% | -50.8% |
| P/E | 25.6 | -5.9 |
| P/B | 2.67 | 3.15 |
| Current Ratio | 1.72 | 2.80 |
| Quick Ratio | 1.02 | 2.59 |
| D/E | 0.17 | 0.11 |
| Debt-to-Assets | 6.7% | 7.3% |
| Interest Coverage | 82.5 | -57.1 |
| Asset Turnover | 1.39 | 0.40 |
| Fixed Asset Turnover | 11.9 | 4.54 |
| Payout ratio | 0 | 0 |
| Dividend yield | 0 | 0 |
| Fiscal Year | 2025 | 2024 |
Efficiency & Valuation Duel: The Vital Signs
Ratios act as a company’s DNA, unveiling operational strengths and hidden risks that shape investor confidence and valuation integrity.
Sanmina Corporation
Sanmina posts a modest ROE of 10.45% with a net margin of 3.03%, signaling moderate profitability. Its P/E ratio at 25.59 suggests the stock trades at a slight premium. The firm maintains a strong current ratio of 1.72 and favors stability with no dividend payout, opting to reinvest in steady operational cash flow and capital efficiency.
Ouster, Inc.
Ouster exhibits negative profitability metrics, including a -53.64% ROE and an -87.35% net margin, indicating operational challenges. Despite a favorable negative P/E reflecting losses, its valuation remains stretched with a PB of 3.15. The company supports liquidity with a current ratio of 2.8 but returns no dividends, heavily investing in R&D and growth to build future capacity.
Premium Valuation vs. Operational Safety
Sanmina offers a balanced profile with steady returns and solid liquidity, albeit at a modest valuation premium. Ouster’s metrics reveal high risk with ongoing losses and stretched valuation despite strong liquidity. Risk-tolerant investors seeking growth may lean toward Ouster, while those prioritizing stability fit Sanmina better.
Which one offers the Superior Shareholder Reward?
Sanmina Corporation (SANM) and Ouster, Inc. (OUST) both eschew dividends, focusing on reinvestment and buybacks. SANM delivers a robust free cash flow of 8.6/share and maintains zero dividend payout, channeling cash into steady buyback programs. OUST suffers heavy losses and negative free cash flow, with no buyback activity. SANM’s disciplined capital allocation, positive cash flow, and steady buybacks offer a far more sustainable and attractive shareholder reward in 2026. I clearly favor SANM for superior total return potential.
Comparative Score Analysis: The Strategic Profile
The radar chart reveals the fundamental DNA and trade-offs of Sanmina Corporation and Ouster, Inc., highlighting their distinct financial strengths and vulnerabilities:
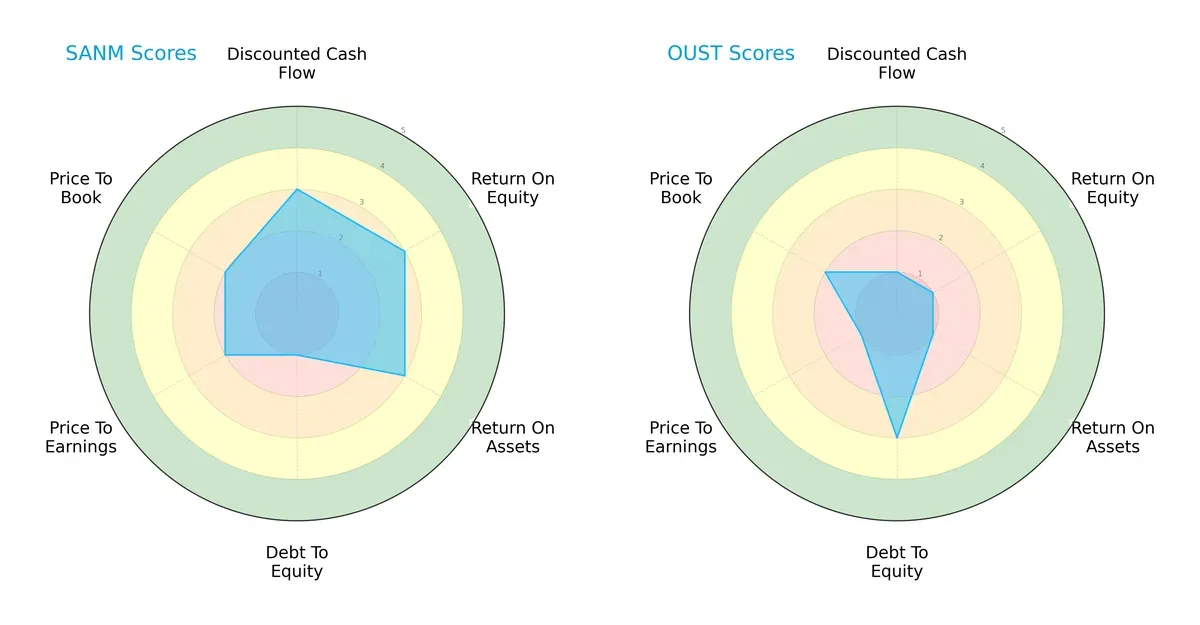
Sanmina shows a balanced profile with moderate scores in DCF, ROE, and ROA, but suffers from a very unfavorable debt-to-equity score. Ouster relies heavily on a strong debt-to-equity score but lags significantly in profitability and valuation metrics. Sanmina’s diversified strengths offer a more stable investment base.
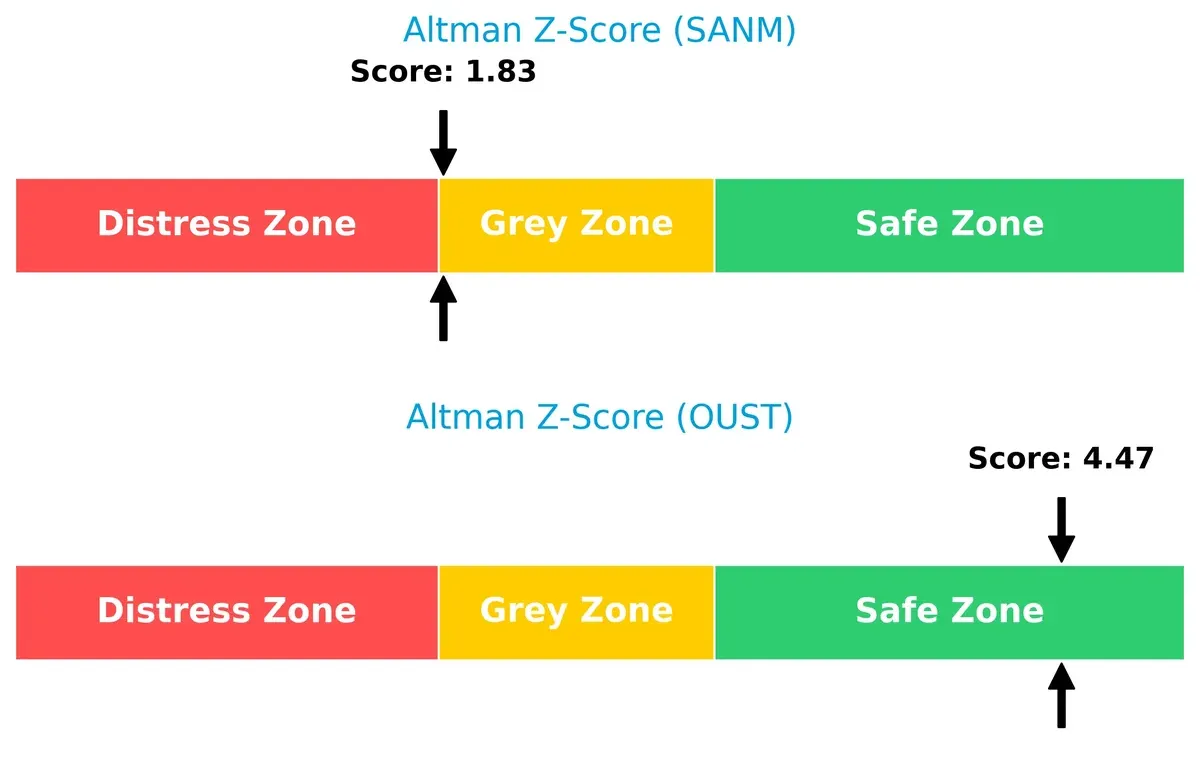
Bankruptcy Risk: Solvency Showdown
Ouster’s Altman Z-Score of 4.47 places it firmly in the safe zone, signaling strong solvency. Sanmina’s 1.83, in the grey zone, indicates moderate bankruptcy risk under current market pressures:
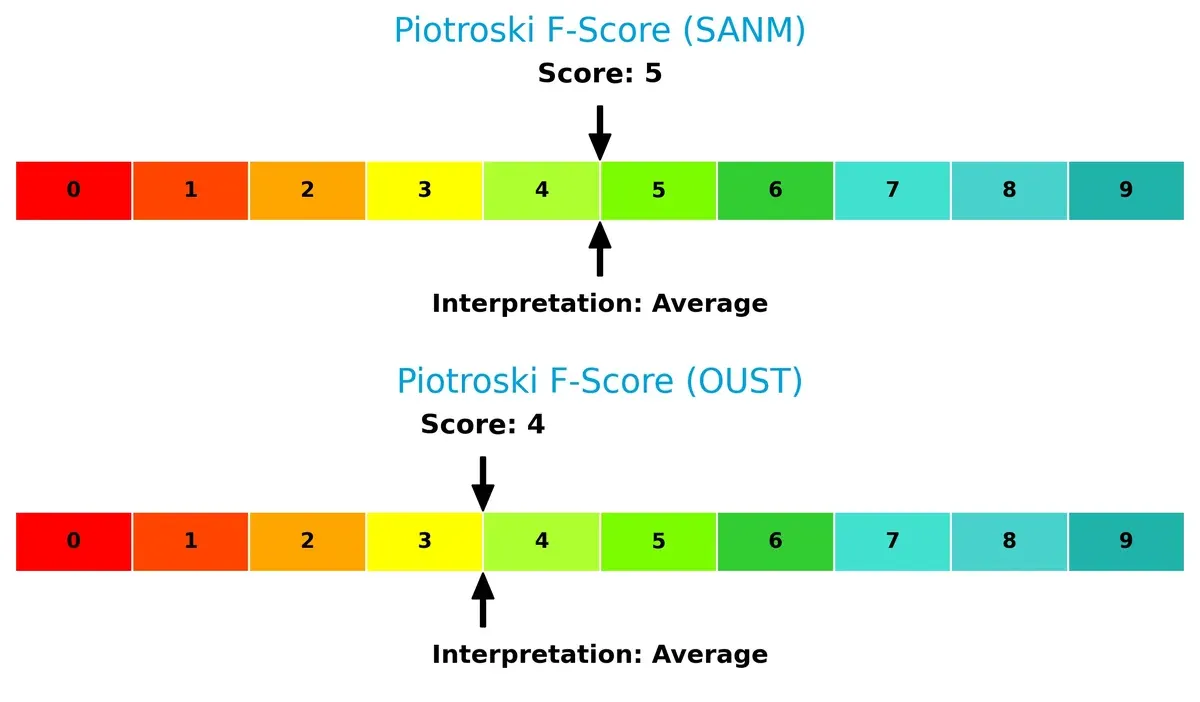
Financial Health: Quality of Operations
Sanmina and Ouster have average Piotroski F-Scores of 5 and 4, respectively. Both companies show moderate financial health, but neither demonstrates peak operational quality. Investors should watch for internal metric red flags:
How are the two companies positioned?
This section dissects the operational DNA of Sanmina and Ouster by comparing their revenue distribution and internal dynamics. The goal is to confront their economic moats to identify which model offers the most resilient, sustainable competitive advantage today.
Revenue Segmentation: The Strategic Mix
This comparison dissects how Sanmina Corporation and Ouster, Inc. diversify their income streams and where their primary sector bets lie:
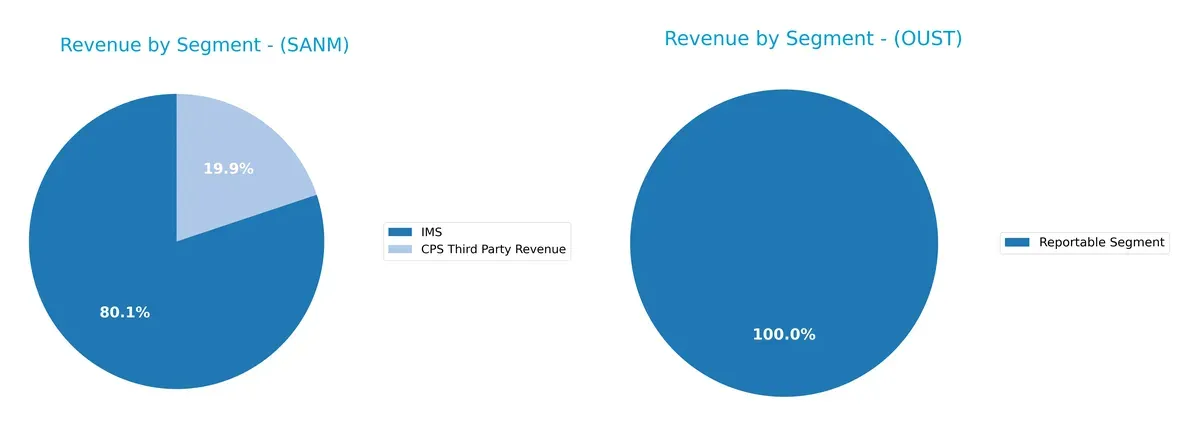
Sanmina anchors revenue in two clear segments: IMS at $6.5B and CPS Third Party at $1.6B in 2025, showing a balanced yet IMS-dominant mix. Ouster reports a single $111M segment, signaling heavy reliance on one revenue source. Sanmina’s diversified profile mitigates concentration risk and benefits from ecosystem lock-in, while Ouster’s narrow focus increases vulnerability but may reflect targeted innovation.
Strengths and Weaknesses Comparison
This table compares the Strengths and Weaknesses of Sanmina Corporation and Ouster, Inc.:
Sanmina Strengths
- Diversified product segments with IMS and CPS revenues over 8B USD
- Favorable liquidity ratios with current ratio 1.72 and quick ratio 1.02
- Low leverage with debt-to-assets at 6.73%
- Strong asset turnover at 1.39 and fixed asset turnover at 11.91
- Solid global presence across Americas, Asia Pacific, and EMEA with multi-billion revenues
Ouster Strengths
- Favorable liquidity ratios with current ratio 2.8 and quick ratio 2.59
- Low leverage with debt-to-assets at 7.33%
- Favorable PE ratio despite negative earnings
- Growing geographic presence in Americas, Asia Pacific, and EMEA with 111M revenue in 2024
- Fixed asset turnover at 4.54 indicating efficient use of fixed assets
Sanmina Weaknesses
- Low net margin at 3.03% flagged unfavorable
- PE ratio high at 25.59, reflecting valuation concerns
- No dividend yield
- Neutral ROE and ROIC near WACC suggesting limited capital return advantage
Ouster Weaknesses
- Large negative net margin at -87.35% and negative ROE and ROIC
- High WACC at 17.33% indicating expensive capital
- Negative interest coverage ratio -51.94 signals financial stress
- Low asset turnover at 0.4 suggests weak operational efficiency
- No dividend yield and unfavorable PB ratio at 3.15
Sanmina shows financial stability with favorable liquidity and turnover metrics but faces profitability challenges and valuation risks. Ouster struggles with losses and capital cost but benefits from strong liquidity and asset usage efficiency. These profiles imply divergent strategic priorities in managing growth and financial health.
The Moat Duel: Analyzing Competitive Defensibility
A durable structural moat shields long-term profits from relentless competition and market shifts. Let’s dissect how these two firms defend their turf:
Sanmina Corporation: Operational Scale & Diversification Moat
Sanmina leverages scale and diversified manufacturing solutions, stabilizing margins around 8.8% gross and 4.2% EBIT. Its broad client base across industrial and aerospace softens cyclicality risks. Yet, declining ROIC signals mounting pressure on capital efficiency in 2026.
Ouster, Inc.: Innovation-Driven Technological Moat
Ouster banks on cutting-edge digital lidar sensors, boasting a sharp 36.4% gross margin amid rapid 33% revenue growth. Unlike Sanmina, Ouster’s growth stems from tech innovation, though negative net margins and value destruction caution on profitability sustainability. ROIC trends show improving capital returns.
Verdict: Scale & Diversification vs. Innovation Momentum
Sanmina’s moat is wider due to operational scale and diversified markets, but its eroding ROIC weakens defense. Ouster’s deeper moat lies in innovation, with improving profitability signals. For 2026, Ouster appears better equipped to grow profitably, while Sanmina faces capital efficiency headwinds.
Which stock offers better returns?
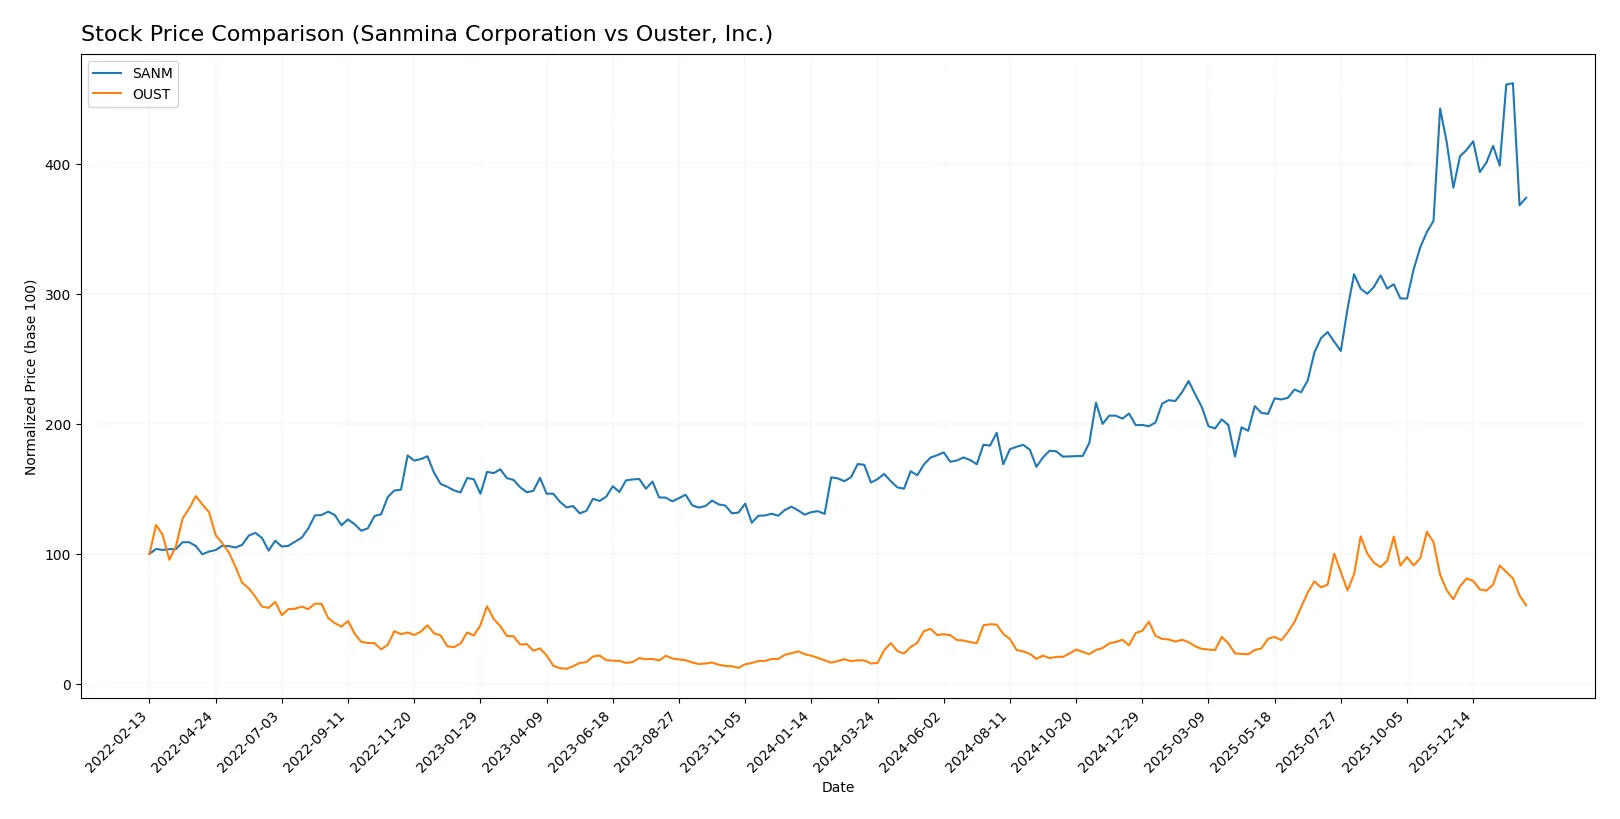
The past year reveals stark contrasts in price gains and trading dynamics between Sanmina Corporation and Ouster, Inc., highlighting significant growth followed by recent downturns.
Trend Comparison
Sanmina Corporation’s stock rose 141.45% over the past 12 months, showing a bullish trend with decelerating momentum. The price ranged from 57.79 to 177.83, with heightened volatility (std dev 32.12).
Ouster, Inc. gained 283.35% in the same period, also bullish but decelerating. Price moved between 4.82 and 35.8, with lower volatility (std dev 8.53), indicating steadier gains.
Comparing trends, Ouster clearly outperformed Sanmina in market return despite both showing recent declines. Ouster delivered the highest returns over the full year analyzed.
Target Prices
Analysts present a clear target price consensus for Sanmina Corporation and Ouster, Inc.
| Company | Target Low | Target High | Consensus |
|---|---|---|---|
| Sanmina Corporation | 200 | 200 | 200 |
| Ouster, Inc. | 33 | 39 | 36.67 |
Sanmina’s target price at $200 suggests a 39% upside from the current $144, indicating strong confidence. Ouster’s target consensus near $37 implies a potential doubling from $18.39, reflecting bullish analyst sentiment despite recent volatility.

Don’t Let Luck Decide Your Entry Point
Optimize your entry points with our advanced ProRealTime indicators. You’ll get efficient buy signals with precise price targets for maximum performance. Start outperforming now!
How do institutions grade them?
Sanmina Corporation Grades
The following table summarizes recent grades assigned to Sanmina Corporation by reputable firms.
| Grading Company | Action | New Grade | Date |
|---|---|---|---|
| Argus Research | Maintain | Buy | 2026-01-28 |
| B of A Securities | Maintain | Neutral | 2025-07-11 |
| B of A Securities | Maintain | Neutral | 2025-06-09 |
| B of A Securities | Upgrade | Neutral | 2025-01-29 |
| Craig-Hallum | Maintain | Hold | 2024-11-05 |
Ouster, Inc. Grades
Here is the recent grade history for Ouster, Inc. from recognized grading companies.
| Grading Company | Action | New Grade | Date |
|---|---|---|---|
| Cantor Fitzgerald | Upgrade | Overweight | 2025-11-07 |
| Cantor Fitzgerald | Upgrade | Overweight | 2025-11-06 |
| WestPark Capital | Maintain | Buy | 2025-11-05 |
| Rosenblatt | Maintain | Buy | 2025-11-05 |
| WestPark Capital | Upgrade | Buy | 2025-08-13 |
Which company has the best grades?
Ouster, Inc. consistently receives higher action grades, including multiple “Buy” and “Overweight” ratings. Sanmina shows more conservative “Neutral” and “Hold” grades. Investors might view Ouster’s stronger grades as reflecting greater bullish sentiment.
Risks specific to each company
The following categories identify the critical pressure points and systemic threats facing both firms in the 2026 market environment:
1. Market & Competition
Sanmina Corporation
- Established player in integrated manufacturing with diversified industrial clients; faces intense competition in hardware and supply chain innovation.
Ouster, Inc.
- Emerging lidar technology firm with niche products; highly volatile market with fierce competition from well-funded rivals and rapid tech obsolescence.
2. Capital Structure & Debt
Sanmina Corporation
- Low debt-to-equity ratio (0.17) and strong interest coverage (80x) indicate prudent leverage and financial stability.
Ouster, Inc.
- Low debt-to-equity (0.11) but negative interest coverage signals operational losses and risk of financial distress despite conservative borrowing.
3. Stock Volatility
Sanmina Corporation
- Beta near 1.03 suggests market-level volatility; stock range shows moderate price fluctuations.
Ouster, Inc.
- High beta of 2.9 indicates extreme price swings, reflecting speculative investor sentiment and business uncertainty.
4. Regulatory & Legal
Sanmina Corporation
- Operating in regulated aerospace and defense sectors; compliance demands can increase costs but also create barriers to entry.
Ouster, Inc.
- Faces evolving regulations on autonomous vehicle sensors and data privacy, increasing compliance risk and potential litigation exposure.
5. Supply Chain & Operations
Sanmina Corporation
- Global manufacturing footprint benefits from integrated supply chain but vulnerable to geopolitical disruptions and component shortages.
Ouster, Inc.
- Smaller scale and reliance on specialized components heightens operational risks and supplier dependency concerns.
6. ESG & Climate Transition
Sanmina Corporation
- Moderate ESG risk profile; manufacturing emissions and resource use require ongoing mitigation efforts aligned with industry standards.
Ouster, Inc.
- Growing focus on sustainable tech but faces challenges in scaling production with low carbon footprint and social responsibility metrics.
7. Geopolitical Exposure
Sanmina Corporation
- Significant US and global exposure with risks from trade tensions and tariffs affecting supply chains and contracts.
Ouster, Inc.
- Primarily US-based with limited international sales; geopolitical risks are less pronounced but still present in supply sourcing.
Which company shows a better risk-adjusted profile?
Sanmina’s key risk lies in market competition and moderate profitability pressures despite stable capital structure and liquidity. Ouster’s core risk is severe financial weakness and stock volatility amid nascent market challenges. Sanmina’s relatively stable Altman Z-score in the grey zone contrasts with Ouster’s safe-zone bankruptcy metric but poor profitability metrics. Sanmina shows a better risk-adjusted profile given its diversified revenue, stronger financial ratios, and lower stock volatility. The steep net margin loss (-87%) at Ouster combined with a 2.9 beta highlights extreme operational and market risks, justifying caution.
Final Verdict: Which stock to choose?
Sanmina Corporation’s superpower lies in its operational efficiency and robust balance sheet. It generates consistent free cash flow and maintains a solid current ratio, signaling liquidity strength. The key point of vigilance is its slightly declining profitability and value creation, which might challenge long-term returns. Sanmina fits well in portfolios seeking steady industrial exposure with moderate growth potential.
Ouster, Inc. commands a strategic moat through rapid revenue growth fueled by innovative lidar technology and expanding market presence. Its safety profile is weaker than Sanmina’s, reflected in negative profitability metrics and cash flow challenges. However, Ouster’s improving ROIC trend suggests emerging value creation potential. It suits investors targeting high-growth, higher-risk opportunities with a longer time horizon.
If you prioritize operational stability and steady cash generation, Sanmina is the compelling choice due to its efficient capital use and financial resilience. However, if you seek aggressive growth and can tolerate volatility, Ouster offers better upside potential driven by innovation and accelerating profitability. Each stock caters to distinct investor profiles, emphasizing the trade-off between risk and growth.
Disclaimer: Investment carries a risk of loss of initial capital. The past performance is not a reliable indicator of future results. Be sure to understand risks before making an investment decision.
Go Further
I encourage you to read the complete analyses of Sanmina Corporation and Ouster, Inc. to enhance your investment decisions: