In the rapidly evolving lidar technology sector, Ouster, Inc. (OUST) and MicroVision, Inc. (MVIS) stand out as key players pushing the boundaries of innovation. Both specialize in advanced sensor hardware for autonomous vehicles and robotics, yet their approaches and market footprints differ significantly. This comparison will help investors understand which company offers the most compelling opportunity in this competitive and high-growth industry. Let’s explore which stock deserves a place in your portfolio.
Table of contents
Companies Overview
I will begin the comparison between Ouster and MicroVision by providing an overview of these two companies and their main differences.
Ouster Overview
Ouster, Inc. specializes in designing and manufacturing high-resolution digital lidar sensors and enabling software that provide 3D vision capabilities to machinery, vehicles, robots, and fixed infrastructure. Based in San Francisco, the company offers products including scanning sensors and solid-state flash sensors, positioning itself as a technology hardware player with a market cap of 1.4B USD and 292 employees.
MicroVision Overview
MicroVision, Inc., headquartered in Redmond, Washington, develops lidar sensors mainly for automotive safety and autonomous driving. It also focuses on micro-display concepts for augmented reality headsets and interactive display modules for smart devices. Founded in 1993, the company has a market cap of 272M USD and employs 185 people, operating within the hardware and technology sectors.
Key similarities and differences
Both Ouster and MicroVision operate in the technology hardware industry, focusing on lidar sensor technologies. While Ouster emphasizes high-resolution digital sensors for a broad range of applications including infrastructure and robotics, MicroVision targets automotive safety and AR display technologies. Ouster’s market cap and employee count are significantly larger, and its products include solid-state sensors, whereas MicroVision offers diverse display solutions alongside its lidar technology.
Income Statement Comparison
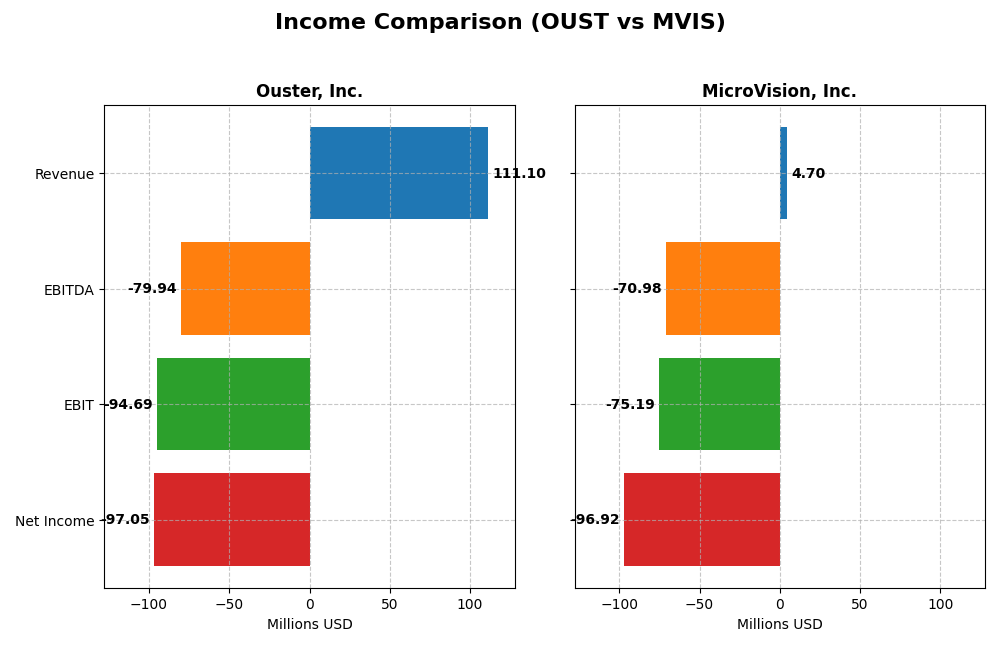
This table presents a side-by-side comparison of key income statement metrics for Ouster, Inc. and MicroVision, Inc. for the fiscal year 2024.
| Metric | Ouster, Inc. (OUST) | MicroVision, Inc. (MVIS) |
|---|---|---|
| Market Cap | 1.40B | 272M |
| Revenue | 111.1M | 4.7M |
| EBITDA | -79.9M | -71.0M |
| EBIT | -94.7M | -75.2M |
| Net Income | -97.0M | -96.9M |
| EPS | -2.08 | -0.46 |
| Fiscal Year | 2024 | 2024 |
Income Statement Interpretations
Ouster, Inc.
Ouster, Inc. shows a strong upward trend in revenue, growing 487.7% over 2020–2024 with a 33.4% increase in 2024 alone. Net income remains negative but improved by 9.12% overall and 80.6% year-over-year. Gross margin at 36.4% is favorable, while EBIT and net margins are negative but improving, reflecting better operational efficiency in the recent year.
MicroVision, Inc.
MicroVision, Inc. experienced modest revenue growth of 52% over the period, but 2024 revenue declined by 35.3%. Net income deteriorated sharply, down over 600% overall, with a negative net margin of -2063.8%. Gross margin and EBIT margin are deeply negative, and interest expenses are high. Despite a slight EBIT improvement in 2024, overall profitability remains weak and margins have worsened.
Which one has the stronger fundamentals?
Based on income statement analysis, Ouster, Inc. exhibits stronger fundamentals with consistent revenue growth, improving margins, and favorable profitability trends despite ongoing losses. MicroVision, Inc. shows significant margin pressure, declining revenue recently, and worsening net losses, indicating weaker income statement health. Thus, Ouster demonstrates a more favorable income statement profile relative to MicroVision.
Financial Ratios Comparison
The table below presents a side-by-side comparison of key financial ratios for Ouster, Inc. (OUST) and MicroVision, Inc. (MVIS) based on their most recent fiscal year data ending 2024.
| Ratios | Ouster, Inc. (OUST) | MicroVision, Inc. (MVIS) |
|---|---|---|
| ROE | -53.6% | -198.7% |
| ROIC | -50.8% | -83.7% |
| P/E | -5.87 | -2.83 |
| P/B | 3.15 | 5.63 |
| Current Ratio | 2.80 | 1.79 |
| Quick Ratio | 2.59 | 1.74 |
| D/E (Debt to Equity) | 0.11 | 1.06 |
| Debt-to-Assets | 7.33% | 42.6% |
| Interest Coverage | -57.1 | -19.2 |
| Asset Turnover | 0.40 | 0.039 |
| Fixed Asset Turnover | 4.54 | 0.20 |
| Payout ratio | 0 | 0 |
| Dividend yield | 0% | 0% |
Interpretation of the Ratios
Ouster, Inc.
Ouster’s financial ratios present a mixed picture with 43% favorable and 57% unfavorable metrics. Strengths include a solid current ratio of 2.8 and low debt-to-equity of 0.11, indicating good liquidity and manageable leverage. However, negative returns on equity (-53.64%) and capital (-50.84%), coupled with a high weighted average cost of capital (17.7%), raise concerns. The company does not pay dividends, likely reflecting ongoing reinvestment in R&D and growth initiatives.
MicroVision, Inc.
MicroVision shows weaker financial ratios overall, with only 21% favorable and 71% unfavorable indicators. Its current ratio at 1.79 and quick ratio at 1.74 suggest adequate short-term liquidity, but high debt-to-equity at 1.06 signals leverage risks. The company’s negative net margin (-2063.78%) and poor returns highlight operational challenges. Like Ouster, MicroVision does not distribute dividends, which may be due to its high research and development spending and growth focus.
Which one has the best ratios?
Between the two, Ouster demonstrates relatively stronger liquidity, lower leverage, and better asset utilization compared to MicroVision, despite both companies facing substantial profitability challenges. Ouster’s higher proportion of favorable ratios and more conservative debt profile provide a comparatively better financial position, while MicroVision’s metrics suggest higher risk and operational strain in the current fiscal year.
Strategic Positioning
This section compares the strategic positioning of Ouster and MicroVision, focusing on market position, key segments, and exposure to technological disruption:
Ouster, Inc.
- Mid-sized market cap $1.4B, faces high beta and competitive pressure in lidar hardware.
- Focuses on high-resolution digital lidar sensors and software for vehicles, machinery, and infrastructure.
- Develops scanning and solid-state flash lidar technologies, exposed to rapid innovation risks in lidar hardware.
MicroVision, Inc.
- Smaller market cap $271M, moderate beta, competes in niche lidar and display markets.
- Develops lidar for automotive safety, AR headsets, and display modules, diversifying product applications.
- Uses laser beam scanning and MEMS technology, potentially disrupting through AR and consumer lidar markets.
Ouster, Inc. vs MicroVision, Inc. Positioning
Ouster emphasizes a concentrated focus on high-resolution lidar sensors for industrial and vehicle applications, benefiting from a clear market segment but facing high competition. MicroVision adopts a more diversified approach, spanning lidar, AR, and display technologies, which spreads risk but may dilute focus.
Which has the best competitive advantage?
Both companies are slightly unfavorable on MOAT evaluation, shedding value but showing growing ROIC trends. Ouster’s larger scale and product focus contrast with MicroVision’s diversified technology, neither currently demonstrating a strong sustainable competitive advantage.
Stock Comparison
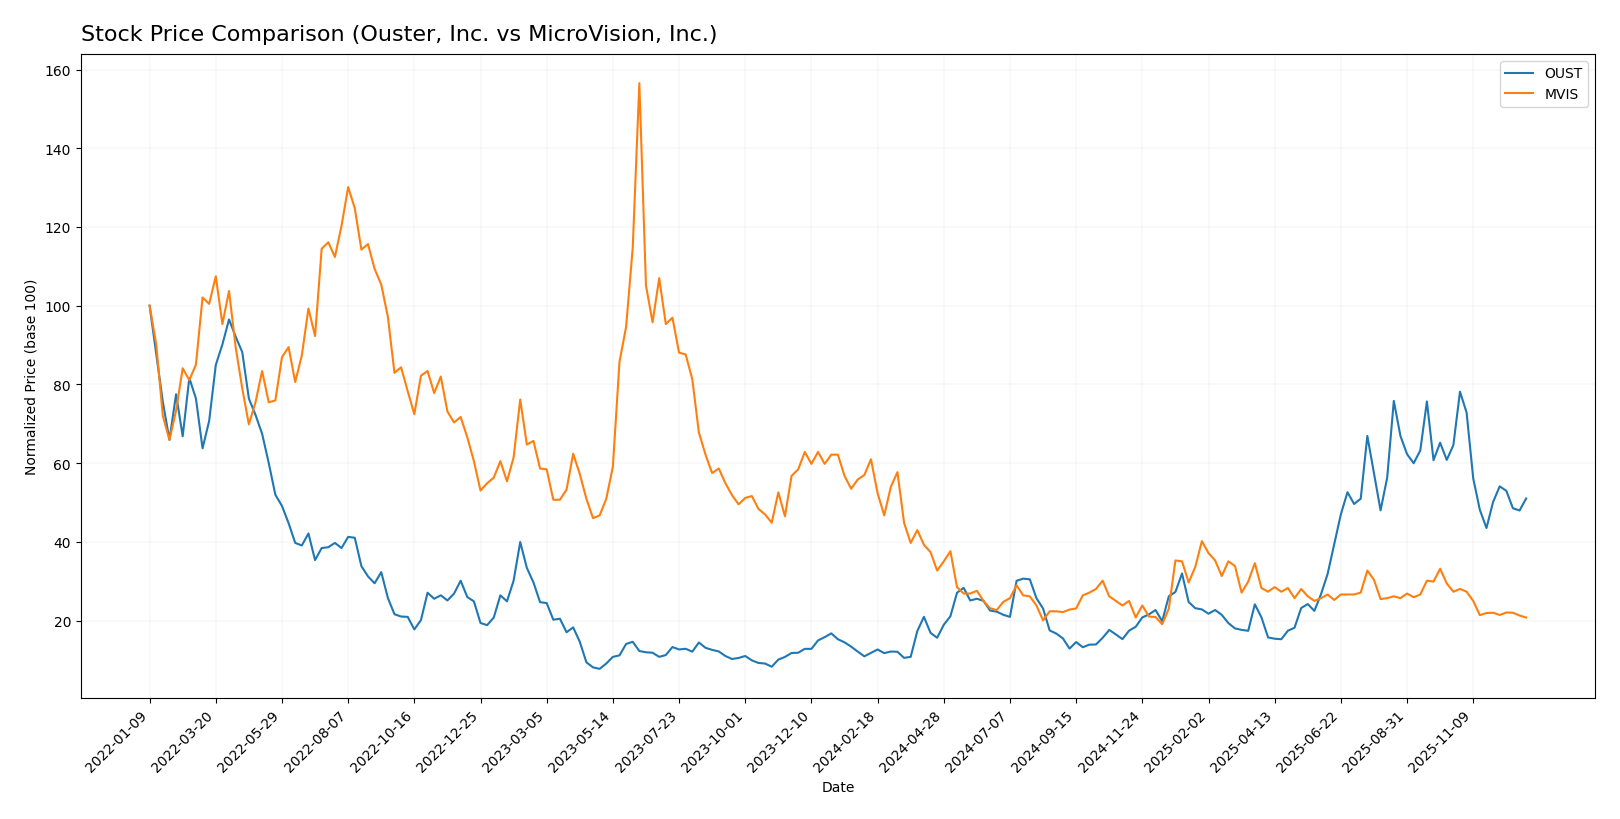
The stock price movements of Ouster, Inc. (OUST) and MicroVision, Inc. (MVIS) over the past 12 months highlight contrasting trajectories, with OUST showing significant growth despite recent pullbacks, while MVIS has experienced sustained declines.
Trend Analysis
Ouster, Inc. (OUST) exhibited a strong bullish trend over the past year with a 332.78% increase in price, though recent months show a 20.99% decline and deceleration in momentum, alongside notable volatility (8.51 std deviation). The stock reached a high of 35.8 and a low of 4.82 during this period.
MicroVision, Inc. (MVIS) displayed a bearish trend with a 65.91% price decline over the last 12 months, continuing with a 23.96% drop recently. The trend decelerated with low volatility (0.34 std deviation), and the stock fluctuated between 0.82 and 2.61.
Comparing both stocks, OUST delivered the highest market performance with a substantial positive return, while MVIS faced significant declines, marking a divergent trend between the two over the analyzed period.
Target Prices
The consensus target prices for Ouster, Inc. and MicroVision, Inc. show promising potential upside from current levels.
| Company | Target High | Target Low | Consensus |
|---|---|---|---|
| Ouster, Inc. | 39 | 33 | 36.67 |
| MicroVision, Inc. | 5 | 5 | 5 |
Analysts expect Ouster’s stock to rise significantly from $23.37 to around $36.67 on average, indicating strong growth potential. MicroVision’s consensus target of $5 also suggests substantial upside from its current $0.89 price.
Analyst Opinions Comparison
This section compares analysts’ ratings and grades for Ouster, Inc. and MicroVision, Inc.:
Rating Comparison
OUST Rating
- Rating: Both companies hold a C- rating.
- Discounted Cash Flow Score: Rated 1, very unfavorable, indicating poor valuation prospects.
- ROE Score: Both have a score of 1, very unfavorable, showing inefficient profit generation from equity.
- ROA Score: Both companies scored 1, very unfavorable, reflecting weak asset utilization.
- Debt To Equity Score: OUST scored 3, moderate risk, indicating a middling financial leverage.
- Overall Score: Both firms received an overall score of 1, very unfavorable, signaling overall weak financial health.
MVIS Rating
- Rating: Both companies hold a C- rating.
- Discounted Cash Flow Score: Rated 1, very unfavorable, indicating poor valuation prospects.
- ROE Score: Both have a score of 1, very unfavorable, showing inefficient profit generation from equity.
- ROA Score: Both companies scored 1, very unfavorable, reflecting weak asset utilization.
- Debt To Equity Score: MVIS scored 2, moderate risk, indicating a slightly stronger balance sheet.
- Overall Score: Both firms received an overall score of 1, very unfavorable, signaling overall weak financial health.
Which one is the best rated?
Both Ouster, Inc. and MicroVision, Inc. share identical overall ratings and most financial scores, except for Debt To Equity where OUST’s score is slightly higher at 3 versus MVIS’s 2. This suggests a marginally higher financial leverage risk for OUST, but overall, they are similarly rated.
Scores Comparison
Here is a comparison of the Altman Z-Score and Piotroski Score for Ouster and MicroVision:
Ouster Scores
- Altman Z-Score: 3.66, indicating the safe zone
- Piotroski Score: 4, considered average
MicroVision Scores
- Altman Z-Score: -6.63, indicating distress zone
- Piotroski Score: 1, considered very weak
Which company has the best scores?
Ouster’s Altman Z-Score places it firmly in the safe zone, while MicroVision is in distress. Ouster’s Piotroski Score is average, compared to MicroVision’s very weak score, showing stronger financial health for Ouster based on provided data.
Grades Comparison
Here is a detailed comparison of the recent grades assigned to Ouster, Inc. and MicroVision, Inc.:
Ouster, Inc. Grades
The following table summarizes recent grades from reputable grading companies for Ouster, Inc.:
| Grading Company | Action | New Grade | Date |
|---|---|---|---|
| Cantor Fitzgerald | Upgrade | Overweight | 2025-11-07 |
| Cantor Fitzgerald | Upgrade | Overweight | 2025-11-06 |
| WestPark Capital | Maintain | Buy | 2025-11-05 |
| Rosenblatt | Maintain | Buy | 2025-11-05 |
| WestPark Capital | Upgrade | Buy | 2025-08-13 |
| Oppenheimer | Maintain | Outperform | 2025-07-16 |
| WestPark Capital | Downgrade | Hold | 2025-06-12 |
| WestPark Capital | Upgrade | Buy | 2025-05-09 |
| Rosenblatt | Maintain | Buy | 2025-03-21 |
| Cantor Fitzgerald | Maintain | Overweight | 2025-03-21 |
Ouster, Inc. shows a positive trend with multiple upgrades to “Buy” and “Overweight” grades, reflecting growing confidence from several established grading firms.
MicroVision, Inc. Grades
The following table summarizes recent grades from reputable grading companies for MicroVision, Inc.:
| Grading Company | Action | New Grade | Date |
|---|---|---|---|
| D. Boral Capital | Maintain | Buy | 2025-12-16 |
| D. Boral Capital | Maintain | Buy | 2025-11-12 |
| WestPark Capital | Maintain | Buy | 2025-10-21 |
| WestPark Capital | Maintain | Buy | 2025-09-05 |
| D. Boral Capital | Maintain | Buy | 2025-09-02 |
| WestPark Capital | Maintain | Buy | 2025-08-27 |
| D. Boral Capital | Maintain | Buy | 2025-08-11 |
| D. Boral Capital | Maintain | Buy | 2025-05-21 |
| D. Boral Capital | Maintain | Buy | 2025-05-13 |
| WestPark Capital | Maintain | Buy | 2025-03-27 |
MicroVision, Inc. has consistently maintained “Buy” ratings from its grading companies, indicating steady endorsement without recent upgrades or downgrades.
Which company has the best grades?
Ouster, Inc. has received a stronger mix of upgrades and higher-grade ratings such as “Overweight” and “Outperform,” suggesting an improving outlook. MicroVision, Inc. maintains a consistent “Buy” rating without change. Investors may interpret Ouster’s positive revisions as a signal of potential growth, while MicroVision’s steady ratings imply stability.
Strengths and Weaknesses
Below is a summary table comparing key strengths and weaknesses of Ouster, Inc. (OUST) and MicroVision, Inc. (MVIS) based on the most recent data available.
| Criterion | Ouster, Inc. (OUST) | MicroVision, Inc. (MVIS) |
|---|---|---|
| Diversification | Primarily product-focused with $111.1M revenue in 2024; limited service segment | Mixed revenue streams including product ($4.1M), license/royalty ($0.475M), and contract revenue ($0.1M) in 2024 |
| Profitability | Negative net margin (-87.35%), ROIC -50.84%, but improving ROIC trend (+65%) | Severely negative net margin (-2063.78%), ROIC -83.73%, slight ROIC improvement (+21%) |
| Innovation | Focused on lidar technology; moderate asset turnover (0.4) and strong fixed asset turnover (4.54) | Innovation-driven with licenses and royalties, but low asset turnover (0.04) and fixed asset turnover (0.2) |
| Global presence | Not explicitly detailed but implied by sizeable revenue | Not explicitly detailed; smaller scale revenue and higher debt ratio |
| Market Share | Established with $111M segment revenue; low debt (7.33% debt-to-assets) | Smaller revenue base and higher debt-to-assets (42.62%), indicating weaker market position |
Key takeaways: Both companies face profitability challenges with negative margins and ROIC below WACC, signaling value destruction. However, Ouster shows stronger revenue figures, better financial health, and a more favorable trend in ROIC, indicating potential for improvement. MicroVision’s heavy losses and high leverage suggest higher risk despite some ROIC growth. Investors should weigh these factors carefully, prioritizing risk management.
Risk Analysis
Below is a comparative risk analysis table for Ouster, Inc. (OUST) and MicroVision, Inc. (MVIS) based on the most recent 2024 data:
| Metric | Ouster, Inc. (OUST) | MicroVision, Inc. (MVIS) |
|---|---|---|
| Market Risk | High beta (2.993) indicates high volatility | Moderate beta (1.557), moderate volatility |
| Debt level | Low debt-to-equity ratio (0.11), favorable | High debt-to-equity ratio (1.06), unfavorable |
| Regulatory Risk | Moderate – tech hardware sector exposure | Moderate – automotive & AR applications exposure |
| Operational Risk | Negative net margin (-87.35%), operational losses | Very high negative margin (-2063.78%), severe operational losses |
| Environmental Risk | Standard for hardware manufacturing | Standard for hardware manufacturing |
| Geopolitical Risk | US-based, moderate geopolitical exposure | US-based, moderate geopolitical exposure |
The most impactful and likely risks are operational losses and high market volatility. MVIS faces severe operational challenges and financial distress, reflected in its extremely negative margins and weak financial scores, while OUST shows high volatility but stronger balance sheet metrics. Both companies carry moderate regulatory and geopolitical risks typical of advanced hardware tech firms.
Which Stock to Choose?
Ouster, Inc. (OUST) shows a favorable income statement with 33.41% revenue growth in 2024 and improving profitability despite negative returns on equity and assets. Its financial ratios are mixed, with 42.86% favorable metrics and low debt levels, but some operational inefficiencies. The rating is very favorable, supported by a safe Altman Z-score and average Piotroski score, indicating moderate financial stability.
MicroVision, Inc. (MVIS) presents an unfavorable income statement marked by declining revenue and negative margins, with a 35.31% revenue drop in 2024 and weak profitability ratios. Its financial ratios are largely unfavorable at 71.43%, including higher debt and poor asset turnover. The rating is very favorable as well, yet Altman Z-score signals distress and a very weak Piotroski score, reflecting financial fragility.
Considering ratings and overall financial health, OUST might appear more suitable for investors prioritizing financial stability and growth potential, while MVIS could be interpreted as riskier, potentially aligning with risk-tolerant profiles interested in speculative opportunities given its valuation metrics. Both companies are currently shedding value but show signs of improving profitability.
Disclaimer: Investment carries a risk of loss of initial capital. The past performance is not a reliable indicator of future results. Be sure to understand risks before making an investment decision.
Go Further
I encourage you to read the complete analyses of Ouster, Inc. and MicroVision, Inc. to enhance your investment decisions: