Home > Comparison > Industrials > OTIS vs XYL
The strategic rivalry between Otis Worldwide Corporation and Xylem Inc. shapes the industrial machinery sector’s future. Otis operates as a capital-intensive manufacturer and service provider of elevators and escalators. In contrast, Xylem focuses on engineered water solutions and smart infrastructure technologies. This analysis pits Otis’s steady service model against Xylem’s innovation-driven growth, aiming to identify which trajectory offers superior risk-adjusted returns for a diversified portfolio.
Table of contents
Companies Overview
Otis Worldwide Corporation and Xylem Inc. are pivotal players in the industrial machinery sector with distinct market focuses.
Otis Worldwide Corporation: Leader in Vertical Transportation Solutions
Otis dominates the elevator and escalator market, generating revenue by designing, manufacturing, installing, and servicing these systems globally. Its core business blends new equipment sales with a vast service network of 34,000 mechanics, focusing strategically in 2026 on modernization and maintenance to enhance recurring revenue streams.
Xylem Inc.: Innovator in Water Technology
Xylem excels in water infrastructure and treatment solutions, earning revenue through engineered products for water transport, filtration, and smart measurement technologies. Its competitive advantage lies in diversified segments including Water Infrastructure and Measurement & Control, with a 2026 focus on expanding digital solutions like cloud-based analytics and remote monitoring.
Strategic Collision: Similarities & Divergences
Both companies operate in industrial machinery but diverge sharply in business philosophy—Otis builds a service-heavy closed ecosystem around vertical transport, while Xylem pursues an open, technology-driven approach to water management. Their primary battleground is infrastructure modernization, yet Otis leans on mechanical service scale and Xylem on digital innovation. This contrast defines their distinct investment profiles: steady service cash flows versus growth-oriented tech integration.
Income Statement Comparison
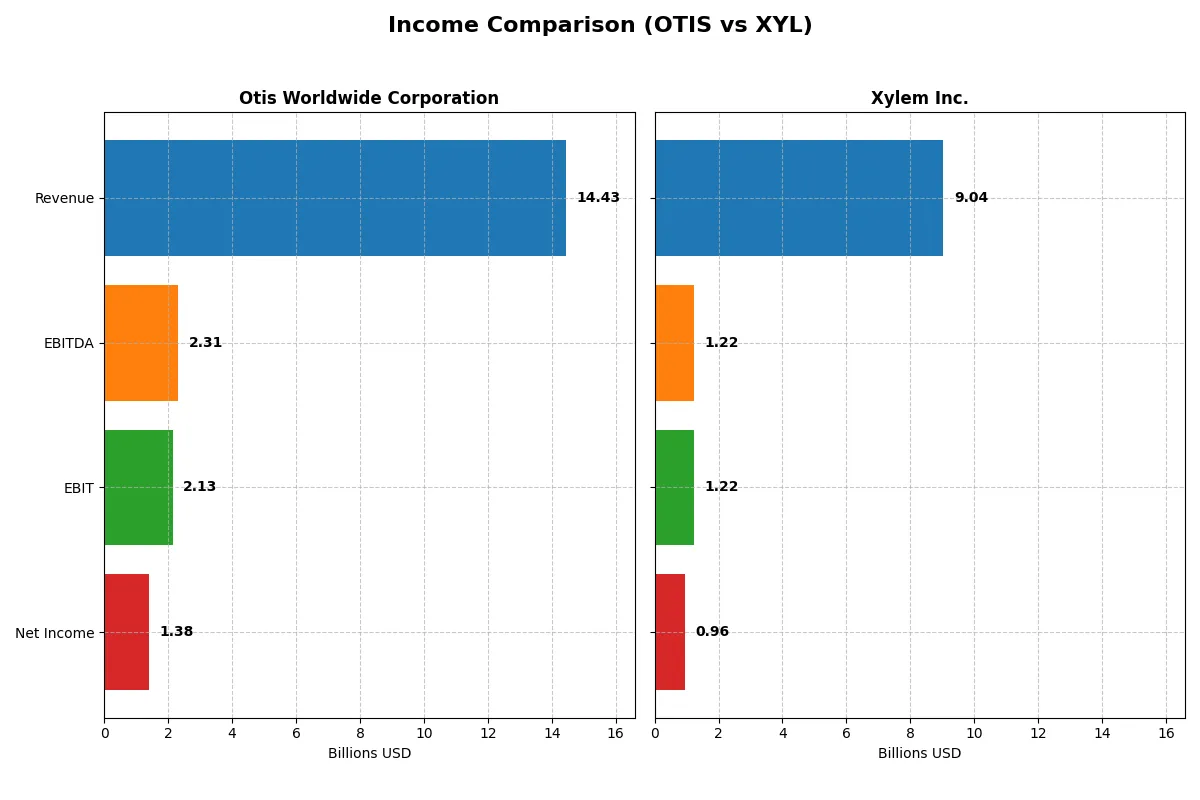
This data dissects the core profitability and scalability of both corporate engines to reveal who dominates the bottom line:
| Metric | Otis Worldwide Corporation (OTIS) | Xylem Inc. (XYL) |
|---|---|---|
| Revenue | 14.4B | 9.0B |
| Cost of Revenue | 10.1B | 5.6B |
| Operating Expenses | 2.24B | 2.25B |
| Gross Profit | 4.37B | 3.48B |
| EBITDA | 2.31B | 1.22B |
| EBIT | 2.13B | 1.22B |
| Interest Expense | 196M | 29M |
| Net Income | 1.38B | 957M |
| EPS | 3.53 | 3.93 |
| Fiscal Year | 2025 | 2025 |
Income Statement Analysis: The Bottom-Line Duel
This income statement comparison reveals how efficiently Otis Worldwide and Xylem convert sales into profits amid shifting market dynamics.
Otis Worldwide Corporation Analysis
Otis’s revenue grew modestly from 14.3B in 2024 to 14.4B in 2025, indicating stagnation in top-line expansion. Gross margin holds steady around 30.3%, while net margin slipped to 9.6%, reflecting tighter bottom-line control. Despite a 4% EBIT increase, net income declined by nearly 16.9%, signaling margin pressure and cost management challenges in 2025.
Xylem Inc. Analysis
Xylem posted stronger revenue momentum, rising 5.5% to 9.0B in 2025, with gross margin expanding to 38.5%. EBIT improved by 8.1%, and net margin edged up to 10.6%, underscoring growing operational efficiency. Net income surged 7.4%, buoyed by disciplined expense control and robust top-line growth, marking a solid profitability trajectory.
Margin Discipline vs. Growth Momentum
Xylem outpaces Otis in revenue growth and margin expansion, delivering superior net income gains and EPS growth. Otis demonstrates resilient gross margin but struggles with net margin contraction and softer income growth. For investors, Xylem’s profile offers stronger earnings momentum and margin improvement, aligning better with growth-oriented portfolios.
Financial Ratios Comparison
These vital ratios act as a diagnostic tool to expose the underlying fiscal health, valuation premiums, and capital efficiency of the companies compared below:
| Ratios | Otis Worldwide Corporation (OTIS) | Xylem Inc. (XYL) |
|---|---|---|
| ROE | -25.7% (2025) | 8.3% (2025) |
| ROIC | 39.6% (2025) | 6.4% (2025) |
| P/E | 24.8 (2025) | 34.6 (2025) |
| P/B | -6.4 (2025) | 2.9 (2025) |
| Current Ratio | 0.85 (2025) | 1.63 (2025) |
| Quick Ratio | 0.77 (2025) | 1.28 (2025) |
| D/E (Debt-to-Equity) | -1.62 (2025) | 0.17 (2025) |
| Debt-to-Assets | 82.1% (2025) | 11.0% (2025) |
| Interest Coverage | 10.9 (2025) | 42.2 (2025) |
| Asset Turnover | 1.35 (2025) | 0.51 (2025) |
| Fixed Asset Turnover | 11.13 (2025) | 7.80 (2025) |
| Payout ratio | 46.7% (2025) | 40.9% (2025) |
| Dividend yield | 1.88% (2025) | 1.18% (2025) |
| Fiscal Year | 2025 | 2025 |
Efficiency & Valuation Duel: The Vital Signs
Financial ratios act as the company’s DNA, revealing operational strengths and hidden risks essential for informed investment decisions.
Otis Worldwide Corporation
Otis shows mixed profitability, with a robust 39.6% ROIC contrasting a negative -25.7% ROE, suggesting uneven shareholder returns. Its P/E of 24.85 signals a fairly valued stock. The 1.88% dividend yield offers steady payouts, balancing reinvestment in R&D at about 1.05% of revenue, reflecting disciplined capital allocation despite some liquidity concerns.
Xylem Inc.
Xylem posts a favorable 10.6% net margin but a modest 6.4% ROIC, paired with an elevated P/E of 34.64, indicating a stretched valuation. It maintains a strong liquidity position with current and quick ratios above 1.2. Dividend yield stands at 1.18%, complemented by higher R&D spend at roughly 2.5% of revenue, signaling growth focus amid efficient debt management.
Balanced Strength vs. Growth Premium
Otis offers a sturdier capital return profile with a more attractive dividend but faces liquidity red flags. Xylem commands a premium valuation underpinned by growth investments and solid liquidity. Investors prioritizing income and capital efficiency may prefer Otis, while those seeking growth and balance might lean toward Xylem.
Which one offers the Superior Shareholder Reward?
I compare Otis Worldwide Corporation (OTIS) and Xylem Inc. (XYL) focusing on dividends, payout ratios, and buybacks. Otis yields 1.88% with a 46.7% payout, supported by free cash flow coverage near 90%. Xylem yields 1.18% with a 40.9% payout but shows lower free cash flow coverage at 73%. Both reinvest retained earnings, yet Otis maintains steadier dividend growth and a more conservative payout. Buyback intensity is less visible but Otis’s stronger FCF suggests more sustainable repurchases. I find Otis offers a superior total return profile for 2026 investors due to its balanced distribution and cash flow discipline.
Comparative Score Analysis: The Strategic Profile
The radar chart reveals the fundamental DNA and trade-offs of Otis Worldwide Corporation and Xylem Inc., highlighting their core financial strengths and weaknesses:
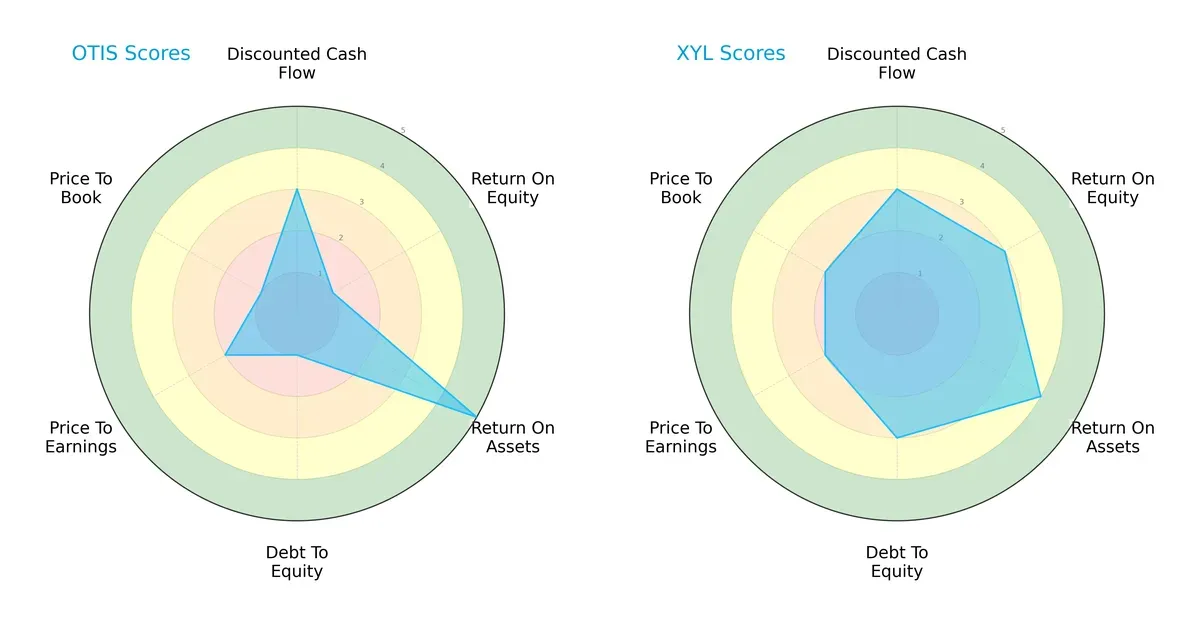
Xylem delivers a more balanced financial profile with moderate scores across ROE, ROA, debt-to-equity, and valuation metrics. Otis leans heavily on asset efficiency (ROA score 5) but struggles with equity returns (ROE score 1) and financial leverage (debt-to-equity score 1). Xylem’s moderate debt management and valuation scores suggest steadier capital allocation, while Otis’s profile signals reliance on operational efficiency amid leverage concerns.
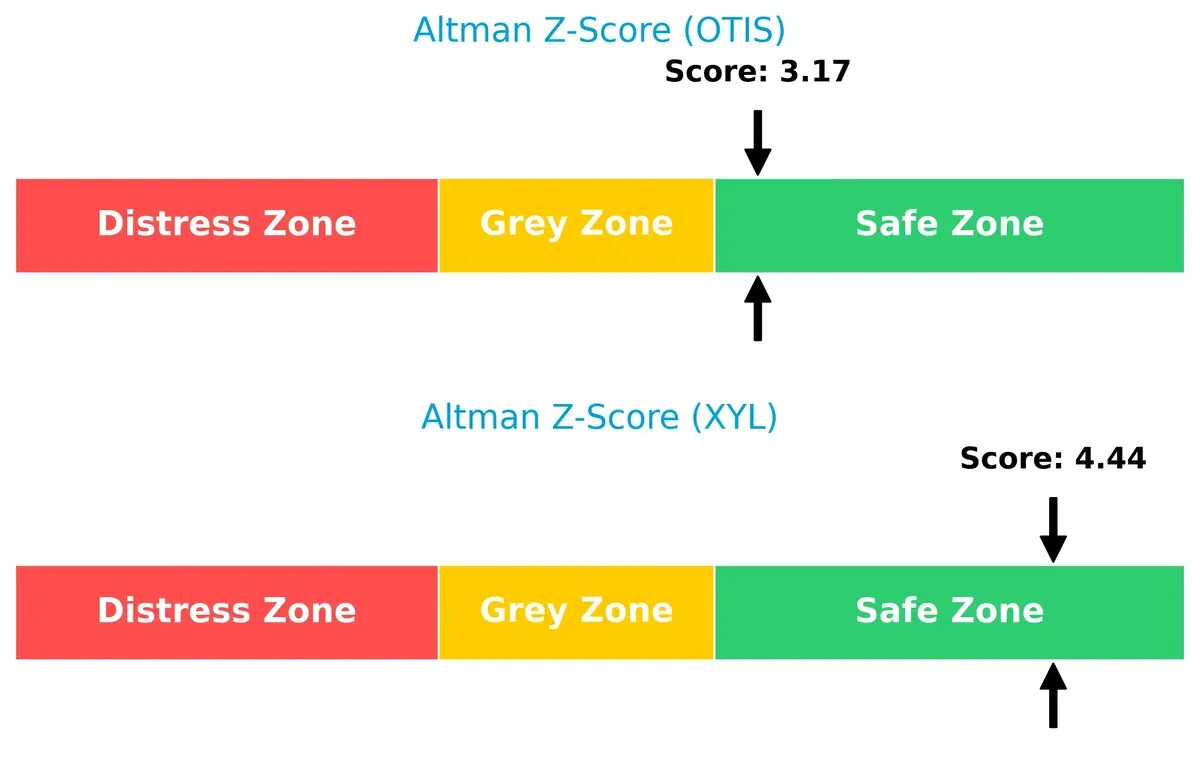
Bankruptcy Risk: Solvency Showdown
Xylem’s Altman Z-Score (4.44) outpaces Otis’s 3.17, placing both safely above distress thresholds but indicating Xylem’s stronger buffer against financial distress in turbulent cycles:
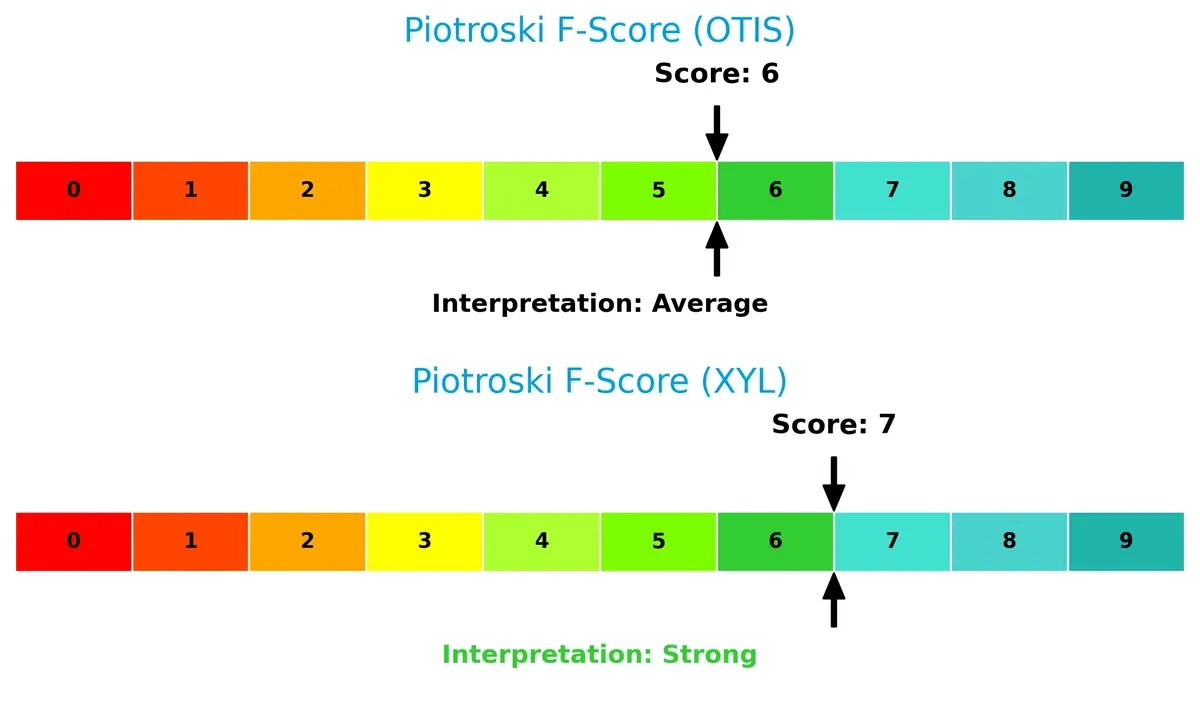
Financial Health: Quality of Operations
Xylem’s Piotroski F-Score of 7 surpasses Otis’s 6, reflecting superior internal financial health and fewer red flags in profitability, liquidity, and operational efficiency:
How are the two companies positioned?
This section dissects Otis and Xylem’s operational DNA by comparing their revenue distribution and internal dynamics. The goal is to confront their economic moats to reveal which model offers the most resilient, sustainable advantage today.
Revenue Segmentation: The Strategic Mix
This comparison dissects how Otis Worldwide Corporation and Xylem Inc. diversify their income streams and reveals where their primary sector bets lie:
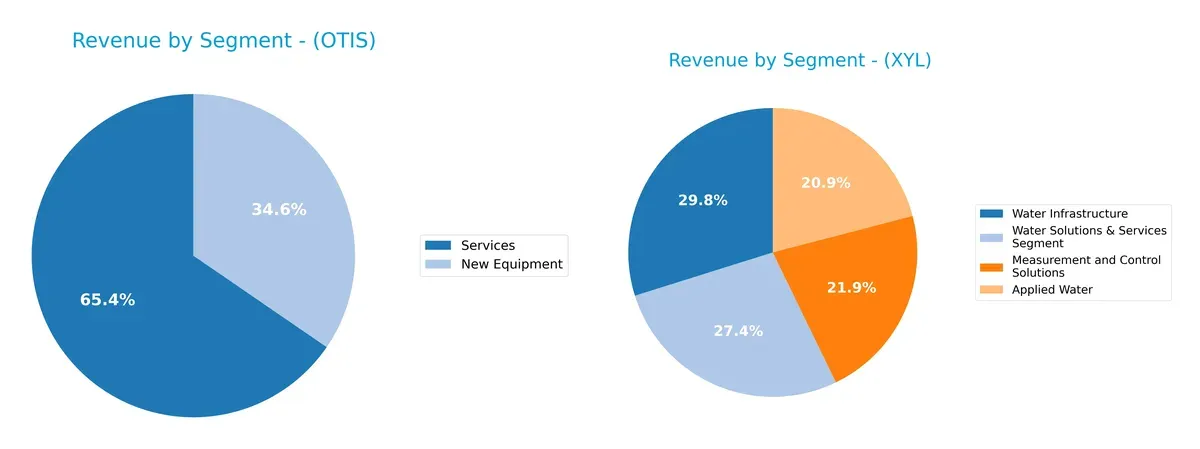
Otis leans heavily on Services with $9.44B, nearly doubling its New Equipment at $4.99B in 2025, showcasing a stable, recurring revenue base. Xylem diversifies across Water Infrastructure ($2.56B), Water Solutions & Services ($2.34B), Applied Water ($1.79B), and Measurement and Control Solutions ($1.87B), reflecting a balanced portfolio. Otis’s focus on services anchors ecosystem lock-in, while Xylem’s spread reduces concentration risk and captures multiple water market niches.
Strengths and Weaknesses Comparison
This table compares the strengths and weaknesses of Otis and Xylem based on diversification, profitability, financials, innovation, global presence, and market share:
Otis Strengths
- Strong service revenue base at $9.4B
- High ROIC of 39.6% indicating efficient capital use
- Favorable asset and fixed asset turnover ratios
- Solid interest coverage at 10.9x
- Diverse geographic presence including China and US markets
Xylem Strengths
- Favorable net margin at 10.6%
- Strong current and quick ratios indicating liquidity
- Low debt-to-assets at 11.0%
- High interest coverage at 42.2x
- Diverse product segments across water solutions
- Significant US revenue at $4.9B
Otis Weaknesses
- Negative ROE at -25.7%, signaling shareholder return issues
- Low current ratio of 0.85 and quick ratio of 0.77, indicating liquidity concerns
- High debt to assets at 82.1%
- Negative price-to-book ratio suggesting market valuation issues
- PE ratio neutral but not compelling
Xylem Weaknesses
- ROE moderate at 8.3% but flagged unfavorable
- PE ratio high at 34.6, indicating possible overvaluation
- ROIC only neutral at 6.4%
- Asset turnover relatively low at 0.51
Overall, Otis shows strengths in capital efficiency and asset utilization but faces liquidity and leverage challenges. Xylem presents healthier liquidity and debt metrics with solid margins but contends with valuation concerns and moderate capital returns. Both companies demonstrate slightly favorable financial conditions, requiring strategic focus on their respective weaknesses to enhance shareholder value.
The Moat Duel: Analyzing Competitive Defensibility
A structural moat alone protects long-term profits from relentless competition erosion. Let’s dissect how Otis and Xylem defend their turf:
Otis Worldwide Corporation: Service Network Switching Costs
Otis leverages extensive service mechanics and branch networks, creating high switching costs. This moat sustains 30% gross margins and growing ROIC in 2026, reinforcing margin stability despite modest revenue growth.
Xylem Inc.: Innovation-Driven Intangible Assets
Xylem’s moat stems from advanced water tech and smart analytics, fueling strong revenue growth and 38% gross margins. Yet, declining ROIC signals potential value destruction, raising questions on sustaining its innovation edge.
Verdict: Service Network Switching Costs vs. Innovation Intangibles
Otis boasts a wider, growing moat with robust ROIC well above WACC, signaling durable value creation. Xylem’s innovation is impressive but hampered by falling returns. Otis is better poised to defend its market share long term.
Which stock offers better returns?
The past year reveals contrasting momentum: Otis Worldwide Corporation’s stock fell sharply, while Xylem Inc. showed a mild decline with heightened volatility.
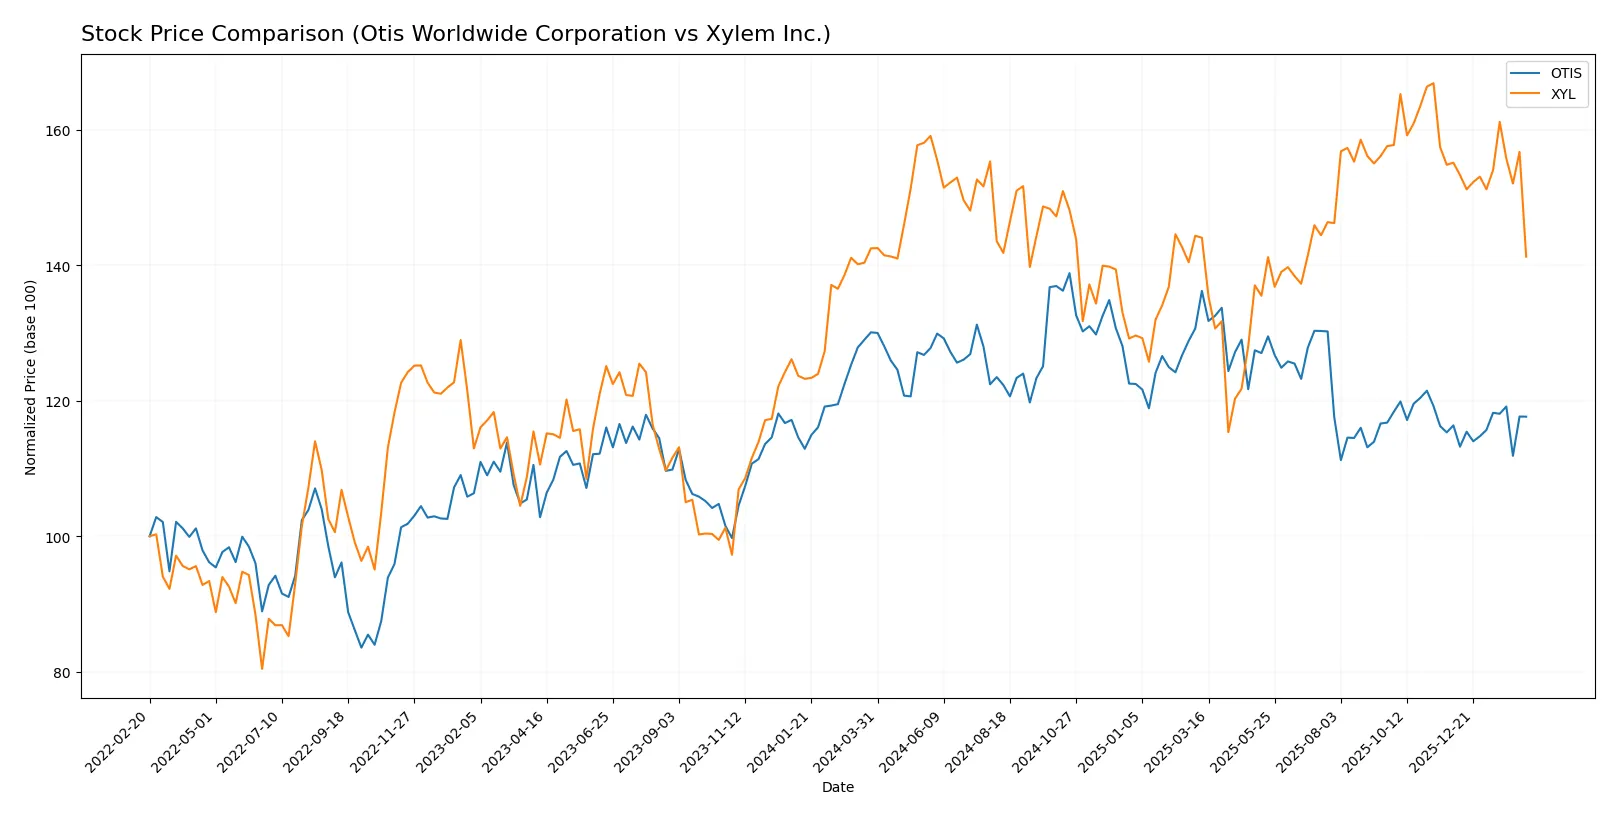
Trend Comparison
Otis Worldwide Corporation’s stock declined 9.57% over the past year, marking a bearish trend with accelerating downward momentum and a standard deviation of 4.89. The price ranged between 106.01 and 84.93.
Xylem Inc.’s stock fell 0.87% over the same period, also bearish but with decelerating decline. It displayed higher volatility (std dev 9.59) and traded between 151.31 and 104.6.
Otis’s steeper decline contrasts with Xylem’s milder loss, making Xylem the stronger performer in relative market terms over the last year.
Target Prices
Analysts present a constructive consensus on target prices for Otis Worldwide Corporation and Xylem Inc.
| Company | Target Low | Target High | Consensus |
|---|---|---|---|
| Otis Worldwide Corporation | 92 | 109 | 97.75 |
| Xylem Inc. | 138 | 176 | 162.67 |
The consensus target for Otis suggests modest upside from the current 89.83 USD price. Xylem’s target consensus at 162.67 USD indicates significant potential above its current 128.09 USD share price.

Don’t Let Luck Decide Your Entry Point
Optimize your entry points with our advanced ProRealTime indicators. You’ll get efficient buy signals with precise price targets for maximum performance. Start outperforming now!
How do institutions grade them?
Here is a summary of the most recent grades provided by major financial institutions for both companies:
Otis Worldwide Corporation Grades
The table below shows recent institutional ratings for Otis Worldwide Corporation:
| Grading Company | Action | New Grade | Date |
|---|---|---|---|
| JP Morgan | Maintain | Overweight | 2026-01-16 |
| Wells Fargo | Maintain | Equal Weight | 2025-12-15 |
| Barclays | Maintain | Underweight | 2025-10-30 |
Xylem Inc. Grades
The table below shows recent institutional ratings for Xylem Inc.:
| Grading Company | Action | New Grade | Date |
|---|---|---|---|
| Citigroup | Maintain | Buy | 2026-02-11 |
| Stifel | Maintain | Buy | 2026-02-11 |
| RBC Capital | Maintain | Outperform | 2026-02-11 |
Which company has the best grades?
Xylem Inc. consistently receives higher ratings such as “Buy” and “Outperform” from multiple firms. Otis shows more mixed grades, including “Overweight” and “Underweight.” These differences may influence investor confidence and portfolio positioning.
Risks specific to each company
The following categories identify the critical pressure points and systemic threats facing Otis Worldwide Corporation and Xylem Inc. in the 2026 market environment:
1. Market & Competition
Otis Worldwide Corporation
- Faces intense competition in elevators and escalators with pressure on margins from innovation demands.
Xylem Inc.
- Competes in water technology with diverse product lines but faces rising competition in smart water solutions.
2. Capital Structure & Debt
Otis Worldwide Corporation
- High debt-to-assets ratio (82%) signals leverage risk despite strong interest coverage.
Xylem Inc.
- Low leverage (11% debt-to-assets) supports financial flexibility and lower default risk.
3. Stock Volatility
Otis Worldwide Corporation
- Beta near 1.0 indicates market-level volatility, with recent price decline raising caution.
Xylem Inc.
- Beta above 1.1 implies slightly higher volatility but recent price gains show investor confidence.
4. Regulatory & Legal
Otis Worldwide Corporation
- Subject to building codes and safety regulations globally, with evolving standards in infrastructure.
Xylem Inc.
- Faces environmental regulations and compliance risks tied to water treatment and sustainability laws.
5. Supply Chain & Operations
Otis Worldwide Corporation
- Large service network (34K mechanics) aids operational resilience but exposes to labor cost inflation.
Xylem Inc.
- Global supply chain for complex water tech products vulnerable to component shortages and logistics delays.
6. ESG & Climate Transition
Otis Worldwide Corporation
- Moderate ESG risks, with modernization services improving energy efficiency but emissions remain a challenge.
Xylem Inc.
- Strong ESG positioning due to water conservation technologies and climate-aligned solutions.
7. Geopolitical Exposure
Otis Worldwide Corporation
- Significant international exposure including China, faces geopolitical trade tensions impacting projects.
Xylem Inc.
- Global footprint with exposure to regulatory shifts and trade barriers, notably in Europe and Asia.
Which company shows a better risk-adjusted profile?
Otis’s highest risk is its heavy leverage, posing financial strain despite operational strengths. Xylem’s main concern lies in competitive pressure and valuation premiums. Xylem’s stronger balance sheet and ESG focus yield a better risk-adjusted profile. Otis’s high debt-to-assets ratio (82%) contrasts sharply with Xylem’s modest 11%, underscoring my concern over Otis’s financial vulnerability.
Final Verdict: Which stock to choose?
Otis Worldwide Corporation’s superpower lies in its exceptional capital efficiency, consistently generating returns well above its cost of capital. Its competitive moat is reinforced by a growing ROIC, signaling sustainable value creation. The main point of vigilance is its stretched liquidity position, which could pressure short-term flexibility. Otis suits portfolios focused on resilient, value-driven growth.
Xylem Inc. boasts a strategic moat rooted in strong liquidity and conservative leverage, providing a safety cushion that outpaces Otis. Its recurring revenue streams and steady operating cash flow underpin stability. Yet, its declining ROIC trend warns of weakening profitability, demanding cautious monitoring. Xylem fits well within balanced portfolios seeking moderate growth with a safety tilt.
If you prioritize efficient capital deployment and long-term value creation, Otis outshines due to its robust moat and improving profitability. However, if you seek stronger balance sheet safety and a more conservative risk profile, Xylem offers better stability despite its challenges in capital efficiency. Both present intriguing but distinct scenarios based on investor risk tolerance.
Disclaimer: Investment carries a risk of loss of initial capital. The past performance is not a reliable indicator of future results. Be sure to understand risks before making an investment decision.
Go Further
I encourage you to read the complete analyses of Otis Worldwide Corporation and Xylem Inc. to enhance your investment decisions: