Home > Comparison > Industrials > SYM vs OTIS
The strategic rivalry between Symbotic Inc. and Otis Worldwide Corporation shapes the future of industrial machinery. Symbotic focuses on cutting-edge warehouse automation, driving efficiency in retail logistics. Otis, a legacy elevator and escalator manufacturer, excels in installation and long-term service. This analysis probes their contrasting models—tech-driven innovation versus established infrastructure—and assesses which offers the superior risk-adjusted return for a diversified portfolio navigating industrial sector dynamics.
Table of contents
Companies Overview
Symbotic and Otis Worldwide represent key players in the industrial machinery sector, shaping automation and infrastructure globally.
Symbotic Inc.: Warehouse Automation Innovator
Symbotic leads in automation technology, specializing in robotics for U.S. retailers and wholesalers. Its core revenue engine is the Symbotic System, a full-service warehouse automation solution that cuts costs and boosts inventory efficiency. In 2026, Symbotic focuses strategically on expanding its technological edge to enhance supply chain productivity.
Otis Worldwide Corporation: Elevator and Escalator Pioneer
Otis dominates the elevator and escalator industry, generating revenue through new equipment sales and extensive maintenance services worldwide. Its strategic focus in 2026 centers on scaling service operations with a network of 34,000 mechanics and modernization projects to upgrade existing infrastructure.
Strategic Collision: Similarities & Divergences
Symbotic and Otis both excel in industrial machinery but diverge in business models: Symbotic drives innovation in automated logistics, while Otis emphasizes physical infrastructure upkeep. Their primary battleground lies in operational efficiency—warehousing versus vertical transportation. This contrast defines distinct investment profiles: tech-driven growth versus stable, service-based cash flow.
Income Statement Comparison
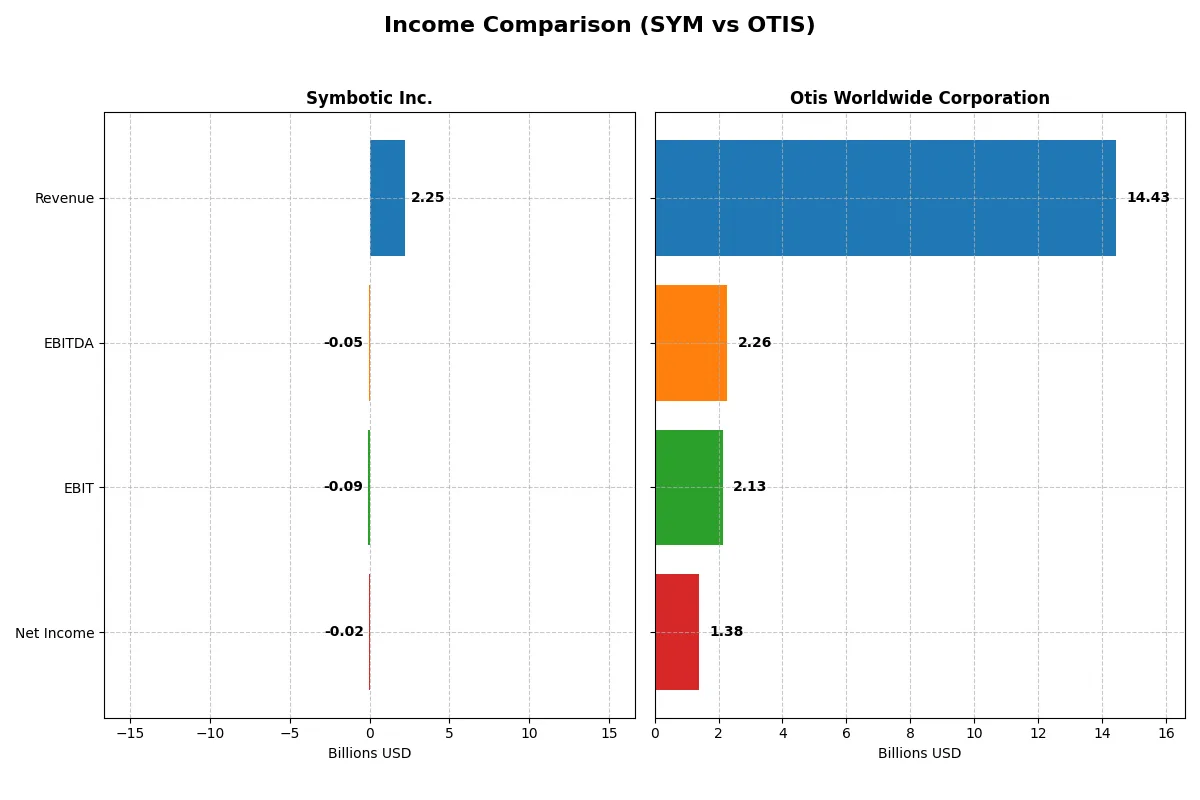
The following data dissects the core profitability and scalability of both corporate engines to reveal who dominates the bottom line:
| Metric | Symbotic Inc. (SYM) | Otis Worldwide Corporation (OTIS) |
|---|---|---|
| Revenue | 2.25B | 14.43B |
| Cost of Revenue | 1.82B | 10.04B |
| Operating Expenses | 538M | 2.20B |
| Gross Profit | 423M | 4.40B |
| EBITDA | -48M | 2.26B |
| EBIT | -92M | 2.13B |
| Interest Expense | 0 | 196M |
| Net Income | -17M | 1.38B |
| EPS | -0.16 | 3.53 |
| Fiscal Year | 2025 | 2025 |
Income Statement Analysis: The Bottom-Line Duel
This income statement comparison reveals which company runs a more efficient and profitable corporate engine through their recent fiscal performance.
Symbotic Inc. Analysis
Symbotic’s revenue soared from 251M in 2021 to 2.25B in 2025, showing strong top-line growth. However, it consistently posts negative net income, with a slight improvement to -17M in 2025. Its gross margin hovers near 19%, but the net margin remains below zero, indicating ongoing profitability challenges despite expanding revenues.
Otis Worldwide Corporation Analysis
Otis maintains a stable revenue base around 14B, with a modest 1.2% increase from 2024 to 2025. It delivers robust profitability, posting a 9.6% net margin and 1.38B net income in 2025. Its gross margin at 30.5% and positive EBIT margin at 14.8% reflect operational efficiency and strong cost controls, sustaining healthy earnings.
Verdict: Rapid Growth Struggles vs. Steady Profitability
Symbotic impresses with rapid revenue expansion but struggles to translate this into profits, dragging margins into negative territory. Otis, by contrast, delivers consistent profitability on a much larger scale with solid margin profiles. For investors prioritizing stability and earnings quality, Otis presents the more attractive profile.
Financial Ratios Comparison
These vital ratios act as a diagnostic tool to expose the underlying fiscal health, valuation premiums, and capital efficiency of the companies compared below:
| Ratios | Symbotic Inc. (SYM) | Otis Worldwide Corp. (OTIS) |
|---|---|---|
| ROE | -7.65% | -25.67% |
| ROIC | -16.63% | 40.74% |
| P/E | -335x | 24.85x |
| P/B | 25.60 | -6.38 |
| Current Ratio | 1.08 | 0.85 |
| Quick Ratio | 0.99 | 0.77 |
| D/E | 0.14 | -1.62 |
| Debt-to-Assets | 1.32% | 82.14% |
| Interest Coverage | 0 | 11.20 |
| Asset Turnover | 0.94 | 1.35 |
| Fixed Asset Turnover | 15.92 | 11.13 |
| Payout Ratio | 0% | 46.75% |
| Dividend Yield | 0% | 1.88% |
| Fiscal Year | 2025 | 2025 |
Efficiency & Valuation Duel: The Vital Signs
Financial ratios serve as a company’s DNA, exposing hidden risks and operational efficiency that raw numbers alone cannot reveal.
Symbotic Inc.
Symbotic struggles with profitability, posting a negative ROE of -7.65% and a net margin of -0.75%, signaling operational challenges. Its P/E ratio is negative, suggesting market skepticism or earnings volatility. The company does not pay dividends, instead reinvesting heavily in R&D, which accounts for nearly 9.6% of revenue, aiming to fuel future growth.
Otis Worldwide Corporation
Otis shows solid operational efficiency with a positive net margin near 9.6% and a strong ROIC of 40.7%, reflecting value creation above its cost of capital. Its P/E ratio of 24.85 is moderate, indicating a fairly valued stock relative to earnings. Otis returns capital to shareholders through a 1.88% dividend yield, balancing income with steady operational cash flow.
Profitability Deficit vs. Operational Strength
Otis offers a more balanced risk-reward profile with clear profitability and shareholder returns. Symbotic’s negative returns and absence of dividends suggest higher risk and a growth-focused investor profile. Investors seeking operational safety may favor Otis, while those prioritizing innovation might consider Symbotic’s reinvestment strategy.
Which one offers the Superior Shareholder Reward?
Symbotic Inc. (SYM) does not pay dividends and shows no buyback activity, focusing all cash flow on reinvestment amid negative net margins. Otis Worldwide (OTIS) yields 1.6–1.9%, with a payout ratio near 37–47% and steady buybacks fueling returns. OTIS’s dividend and repurchase strategy aligns with sustainable free cash flow coverage (~90%), supporting durable shareholder value. SYM’s zero payouts and reinvestment bet hinge on eventual profitability, a riskier proposition. I find OTIS offers the superior total shareholder reward in 2026, balancing income, buybacks, and consistent cash generation.
Comparative Score Analysis: The Strategic Profile
The radar chart reveals the fundamental DNA and strategic trade-offs of Symbotic Inc. and Otis Worldwide Corporation:
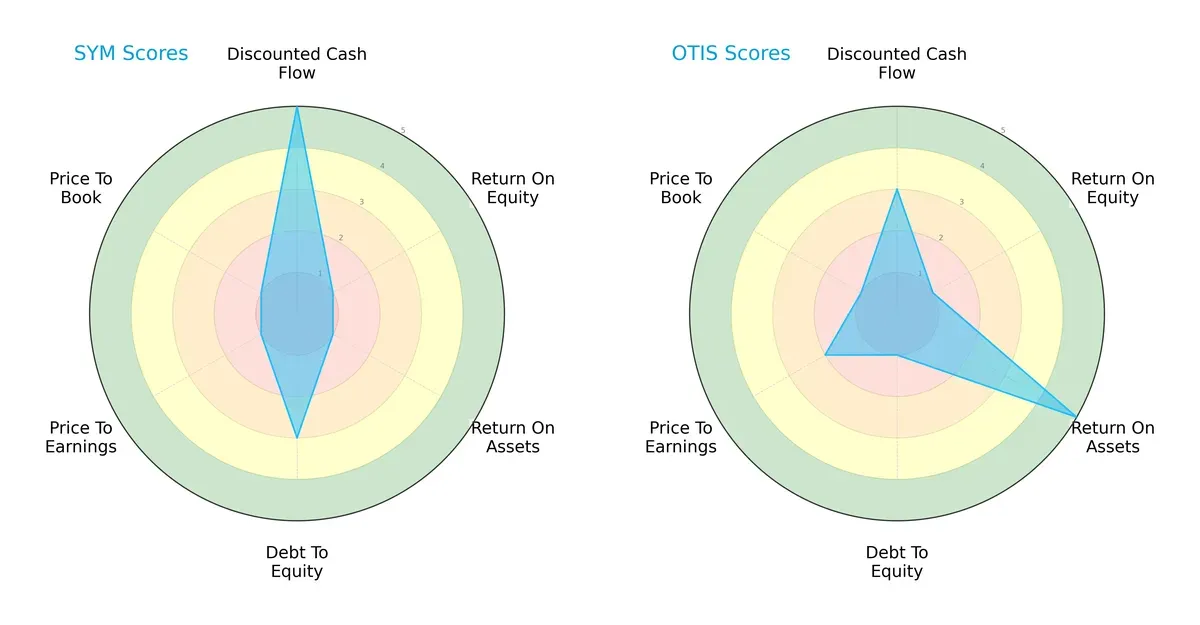
Symbotic excels in discounted cash flow with a very favorable score of 5 but struggles in profitability metrics, showing very unfavorable ROE and ROA scores of 1 each. Otis presents a more balanced profile, particularly with a very favorable ROA score of 5, despite a lower DCF score of 3. Symbotic’s moderate debt-to-equity score of 3 contrasts with Otis’s weak 1, suggesting Otis carries higher financial leverage risk. Overall, Otis relies on asset efficiency, while Symbotic depends heavily on cash flow valuation advantages.
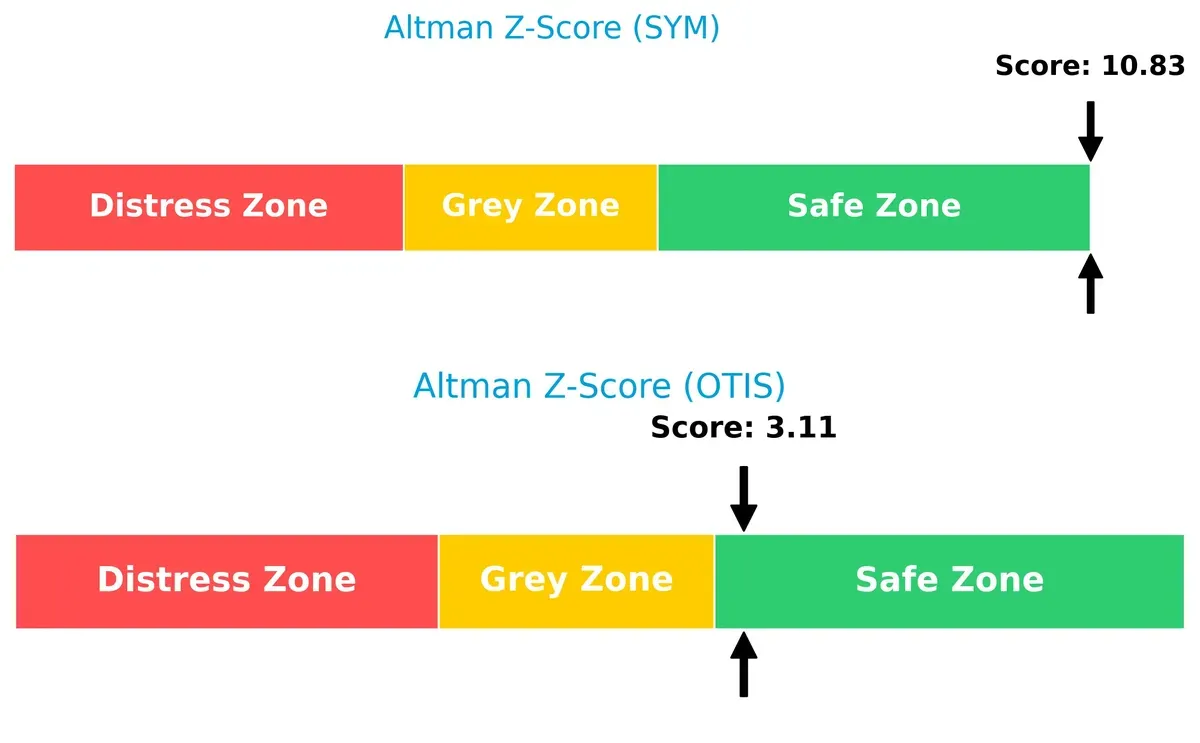
Bankruptcy Risk: Solvency Showdown
Symbotic’s Altman Z-Score of 10.83 far surpasses Otis’s 3.11, indicating a stronger solvency position for Symbotic. Both firms are in the safe zone, but Symbotic’s score signals exceptional financial stability and lower bankruptcy risk in this cycle:
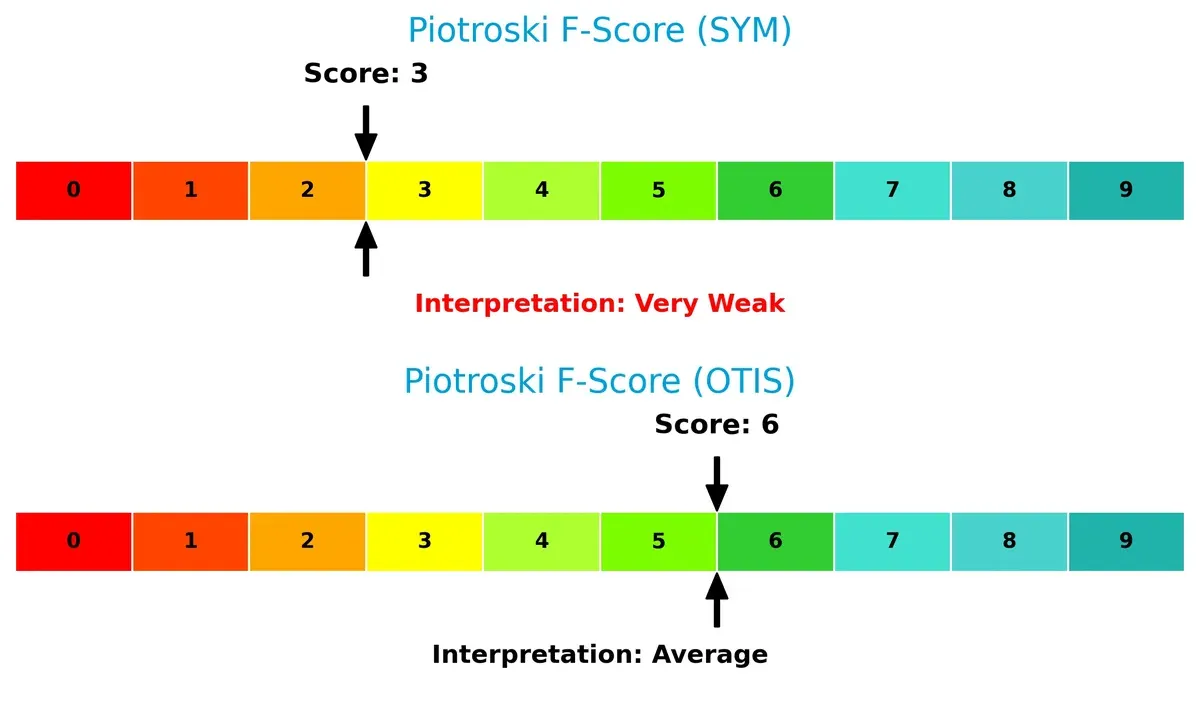
Financial Health: Quality of Operations
Symbotic’s Piotroski F-Score of 3 flags weak internal financial health, while Otis’s 6 reflects average but more robust operational quality. Symbotic’s low score raises caution on profitability and efficiency metrics:
How are the two companies positioned?
This section dissects the operational DNA of Symbotic and Otis by comparing their revenue distribution and internal dynamics. The goal is to confront their economic moats to reveal which model offers the most resilient competitive advantage today.
Revenue Segmentation: The Strategic Mix
This comparison dissects how Symbotic Inc. and Otis Worldwide diversify income streams and reveals their primary sector bets:
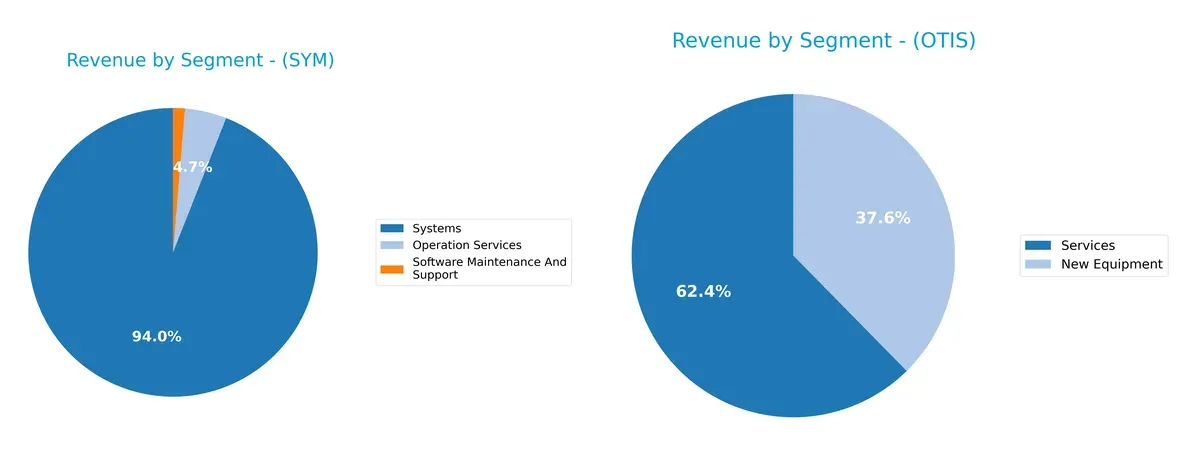
Symbotic’s revenue pivots heavily on Systems, generating $2.12B in 2025 and dwarfing its other segments. Operation Services and Software Maintenance contribute $105M and $30M, respectively, indicating a concentrated but tech-driven model. Otis splits revenue between Services ($8.9B) and New Equipment ($5.37B) in 2024, showing a balanced mix anchored in infrastructure and maintenance. Symbotic faces concentration risk, while Otis leverages ecosystem lock-in through recurring services.
Strengths and Weaknesses Comparison
This table compares the Strengths and Weaknesses of Symbotic Inc. and Otis Worldwide Corporation:
Symbotic Inc. Strengths
- Low debt-to-assets ratio at 1.32%
- Favorable fixed asset turnover of 15.92
- Slightly favorable P/E despite negative profitability
Otis Worldwide Corporation Strengths
- Strong ROIC at 40.74% exceeding WACC
- Favorable interest coverage at 10.87
- Robust asset turnover of 1.35 and global revenue diversification
Symbotic Inc. Weaknesses
- Negative net margin and ROE indicate unprofitable operations
- High P/B ratio at 25.6 signals possible overvaluation
- Zero interest coverage raises solvency concerns
Otis Worldwide Corporation Weaknesses
- Negative ROE at -25.67% despite high ROIC
- Unfavorable current and quick ratios below 1
- High debt-to-assets at 82.14% signals leverage risk
Symbotic shows financial caution with low leverage but struggles with profitability and valuation. Otis combines strong operational efficiency with high leverage and weaker equity returns, highlighting contrasting strategic challenges.
The Moat Duel: Analyzing Competitive Defensibility
A structural moat shields long-term profits from competitive erosion. It defines which company will sustain durable value creation:
Symbotic Inc.: Innovation-Driven Cost Advantage
Symbotic leverages automation technology to cut warehouse costs and improve efficiency, reflected in rapid revenue growth but negative EBIT margins. Its moat risks erosion without margin improvement in 2026.
Otis Worldwide Corporation: Service Network Dominance
Otis relies on an extensive global service network, driving stable margins and steady ROIC growth. Unlike Symbotic, Otis demonstrates value creation, with opportunities to deepen market reach via modernization services.
Automation Innovation vs. Service Network Scale
Otis boasts a wider, deeper moat with ROIC exceeding WACC by 33%, signaling sustainable competitive advantage. Symbotic’s negative ROIC trend shows value destruction, leaving Otis better positioned to defend market share.
Which stock offers better returns?
The past year shows contrasting moves: Symbotic Inc. rallies strongly but slows recently, while Otis Worldwide faces overall decline with a mild recent uptick.
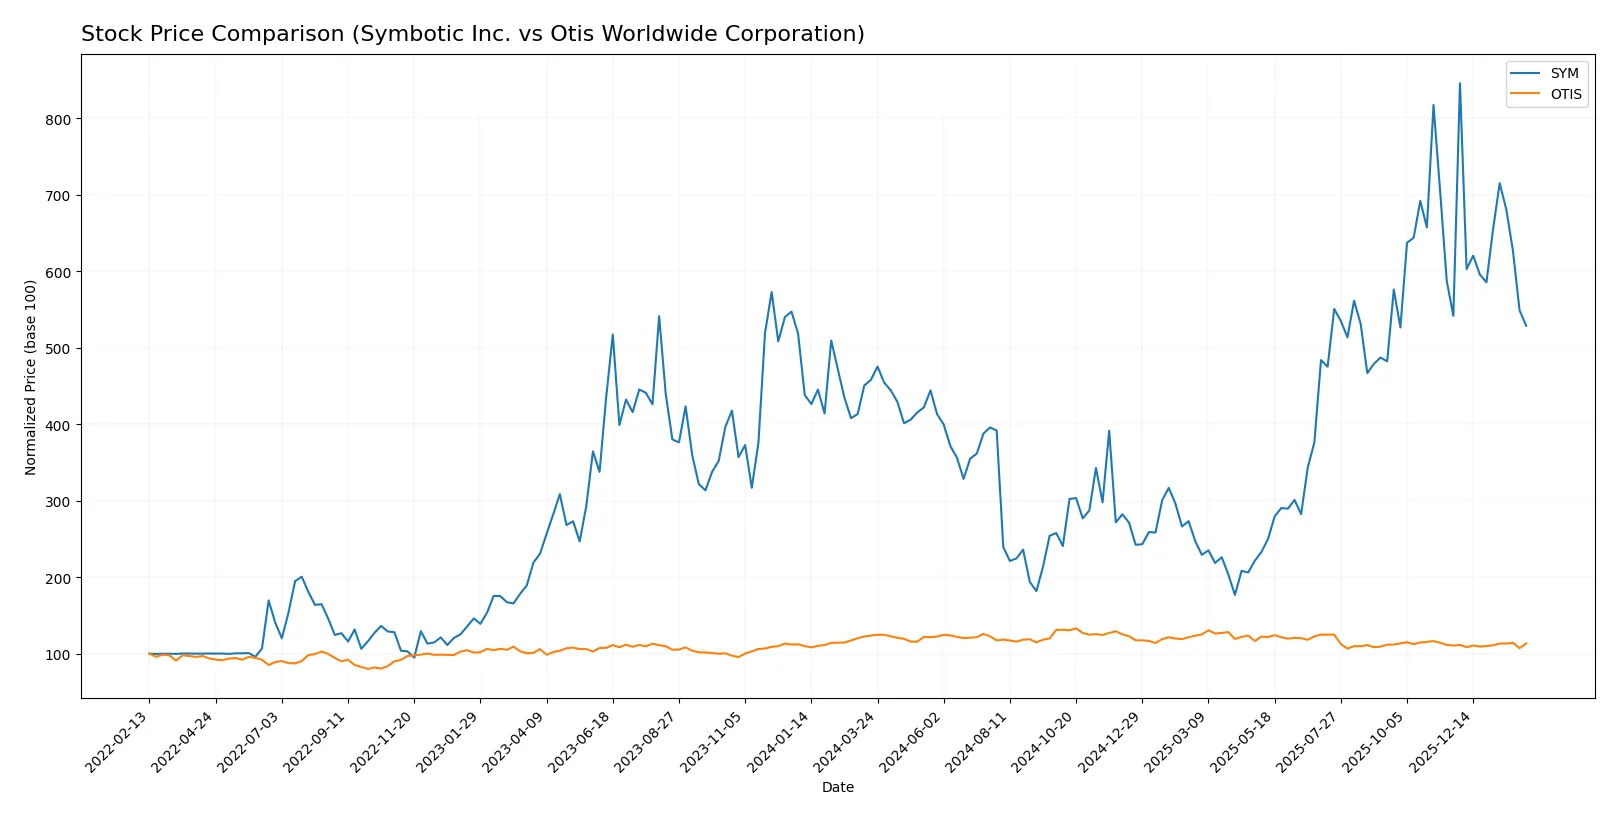
Trend Comparison
Symbotic Inc. posts a 15.42% price rise over 12 months, marking a bullish trend with decelerating momentum. Its volatility is high, peaking at 83.77 and bottoming at 17.5.
Otis Worldwide falls 8.4% over the same period, reflecting a bearish trend with accelerating decline. Volatility remains moderate, ranging between 84.93 and 106.01.
Symbotic’s bullish trend outperforms Otis’s bearish slide, delivering stronger market returns over the last year.
Target Prices
Analysts present a clear consensus on target prices for Symbotic Inc. and Otis Worldwide Corporation.
| Company | Target Low | Target High | Consensus |
|---|---|---|---|
| Symbotic Inc. | 42 | 83 | 65.56 |
| Otis Worldwide Corporation | 92 | 109 | 97.75 |
Symbotic’s target consensus at 65.56 signals upside from the current 52.2 price, suggesting growth potential despite recent volatility. Otis’s 97.75 consensus exceeds its 90.23 stock price, indicating moderate analyst optimism.

Don’t Let Luck Decide Your Entry Point
Optimize your entry points with our advanced ProRealTime indicators. You’ll get efficient buy signals with precise price targets for maximum performance. Start outperforming now!
How do institutions grade them?
Symbotic Inc. Grades
The following table summarizes recent grades assigned to Symbotic Inc. by major institutions:
| Grading Company | Action | New Grade | Date |
|---|---|---|---|
| Barclays | maintain | Underweight | 2026-01-12 |
| Goldman Sachs | downgrade | Sell | 2025-12-02 |
| Barclays | maintain | Underweight | 2025-11-26 |
| Baird | maintain | Neutral | 2025-11-26 |
| Cantor Fitzgerald | maintain | Overweight | 2025-11-25 |
| Citigroup | maintain | Buy | 2025-11-25 |
| Craig-Hallum | upgrade | Buy | 2025-11-25 |
| DA Davidson | maintain | Neutral | 2025-11-25 |
| Needham | maintain | Buy | 2025-11-25 |
| Northland Capital Markets | maintain | Outperform | 2025-11-25 |
Otis Worldwide Corporation Grades
The table below details recent institutional grades for Otis Worldwide Corporation:
| Grading Company | Action | New Grade | Date |
|---|---|---|---|
| JP Morgan | maintain | Overweight | 2026-01-16 |
| Wells Fargo | maintain | Equal Weight | 2025-12-15 |
| Barclays | maintain | Underweight | 2025-10-30 |
| JP Morgan | maintain | Overweight | 2025-10-15 |
| Wolfe Research | upgrade | Outperform | 2025-10-08 |
| Wells Fargo | maintain | Equal Weight | 2025-10-06 |
| JP Morgan | maintain | Overweight | 2025-09-18 |
| RBC Capital | maintain | Outperform | 2025-07-28 |
| Wolfe Research | upgrade | Peer Perform | 2025-07-25 |
| Wells Fargo | maintain | Equal Weight | 2025-07-24 |
Which company has the best grades?
Otis Worldwide holds generally stronger grades, with consistent Overweight and Outperform ratings. Symbotic’s grades are mixed, featuring several Underweight and Sell ratings. Investors may perceive Otis as having more favorable institutional sentiment.
Risks specific to each company
The following categories identify the critical pressure points and systemic threats facing both firms in the 2026 market environment:
1. Market & Competition
Symbotic Inc.
- Faces strong competition in warehouse automation with pressure to innovate rapidly.
Otis Worldwide Corporation
- Competes globally in elevator and escalator markets with established brand and service network.
2. Capital Structure & Debt
Symbotic Inc.
- Low debt levels with favorable debt-to-assets ratio but zero interest coverage is a red flag.
Otis Worldwide Corporation
- High debt burden indicated by debt-to-assets ratio over 80%, though interest coverage remains strong.
3. Stock Volatility
Symbotic Inc.
- High beta at 2.14 signals significant price swings and investor risk.
Otis Worldwide Corporation
- Beta near 1.01 suggests market-like volatility, more stable for risk-averse investors.
4. Regulatory & Legal
Symbotic Inc.
- Must comply with evolving automation safety and data regulations, with potential liability exposure.
Otis Worldwide Corporation
- Faces stringent safety standards and regulatory scrutiny in infrastructure projects worldwide.
5. Supply Chain & Operations
Symbotic Inc.
- Relies on advanced components; supply disruptions could delay system deployments.
Otis Worldwide Corporation
- Extensive global service network mitigates some supply risks but faces operational complexity.
6. ESG & Climate Transition
Symbotic Inc.
- Emerging focus on sustainable automation solutions could create both opportunity and compliance costs.
Otis Worldwide Corporation
- Increasing demand for energy-efficient elevators aligns with climate goals but requires capital investment.
7. Geopolitical Exposure
Symbotic Inc.
- Primarily US-focused, limiting geopolitical risk but also growth diversification.
Otis Worldwide Corporation
- Global footprint, especially in China, exposes firm to trade tensions and regulatory shifts.
Which company shows a better risk-adjusted profile?
Symbotic’s greatest risk lies in its high stock volatility combined with zero interest coverage, signaling financial vulnerability despite low debt. Otis confronts heavy leverage but benefits from stable cash flows and lower volatility. Otis’s global scale introduces geopolitical and regulatory complexity, yet its favorable ROIC (40.7%) versus WACC (7.4%) demonstrates efficient capital allocation. Recent ratio trends affirm Otis’s stronger financial footing and risk management, making it the better risk-adjusted choice for cautious investors seeking industrial exposure in 2026.
Final Verdict: Which stock to choose?
Symbotic Inc. wields a growth engine fueled by rapid revenue expansion and innovation investment. Its superpower lies in scaling technology-driven logistics solutions. However, its value destruction and declining profitability pose a cautionary flag. It suits aggressive growth portfolios willing to tolerate volatility for potential disruption payoffs.
Otis Worldwide commands a solid strategic moat through operational efficiency and service dominance in building systems. Its stable cash flow and improving return on invested capital offer better defensive qualities than Symbotic. This stock fits GARP portfolios seeking steady growth balanced with reasonable valuation and lower risk.
If you prioritize aggressive expansion and market disruption, Symbotic appears the compelling choice despite its value erosion. However, if you seek capital preservation with sustainable competitive advantage, Otis outshines by delivering consistent value creation and financial stability. Each reflects distinct investor profiles demanding careful alignment with risk tolerance and time horizon.
Disclaimer: Investment carries a risk of loss of initial capital. The past performance is not a reliable indicator of future results. Be sure to understand risks before making an investment decision.
Go Further
I encourage you to read the complete analyses of Symbotic Inc. and Otis Worldwide Corporation to enhance your investment decisions: