Home > Comparison > Industrials > ROP vs OTIS
The strategic rivalry between Roper Technologies, Inc. and Otis Worldwide Corporation shapes the current trajectory of the industrial machinery sector. Roper operates as a diversified technology-driven solutions provider, blending software and engineered products. Otis focuses on manufacturing and servicing elevators and escalators, emphasizing infrastructure and maintenance. This analysis explores their contrasting business models to identify which offers superior risk-adjusted returns for a well-diversified portfolio.
Table of contents
Companies Overview
Roper Technologies and Otis Worldwide command significant roles in the industrial machinery sector, shaping infrastructure and technology.
Roper Technologies, Inc.: Diversified Industrial Software and Solutions Leader
Roper Technologies stands out as a diversified industrial technology company with a core revenue engine driven by software and engineered product solutions. It generates income through cloud-based financial analytics, healthcare software, and precision measurement instruments. In 2026, Roper focuses strategically on expanding its software-as-a-service offerings and integrating data analytics to enhance operational efficiency across industries.
Otis Worldwide Corporation: Global Elevator and Escalator Innovator
Otis Worldwide dominates the vertical transportation market as a leading manufacturer and service provider of elevators and escalators. Its revenues arise from new equipment sales and extensive maintenance services. In 2026, the company prioritizes service network expansion and modernization projects, aiming to capitalize on urban infrastructure growth worldwide.
Strategic Collision: Similarities & Divergences
Both firms operate in industrial machinery but diverge sharply in business philosophy: Roper emphasizes a software-driven, diversified technology model, while Otis pursues a hardware-centric, service-heavy approach. Their primary battleground lies in urban infrastructure modernization, where technology integration meets traditional equipment maintenance. Investors face distinct profiles: Roper offers tech-driven growth potential; Otis provides stable, service-based cash flows.
Income Statement Comparison
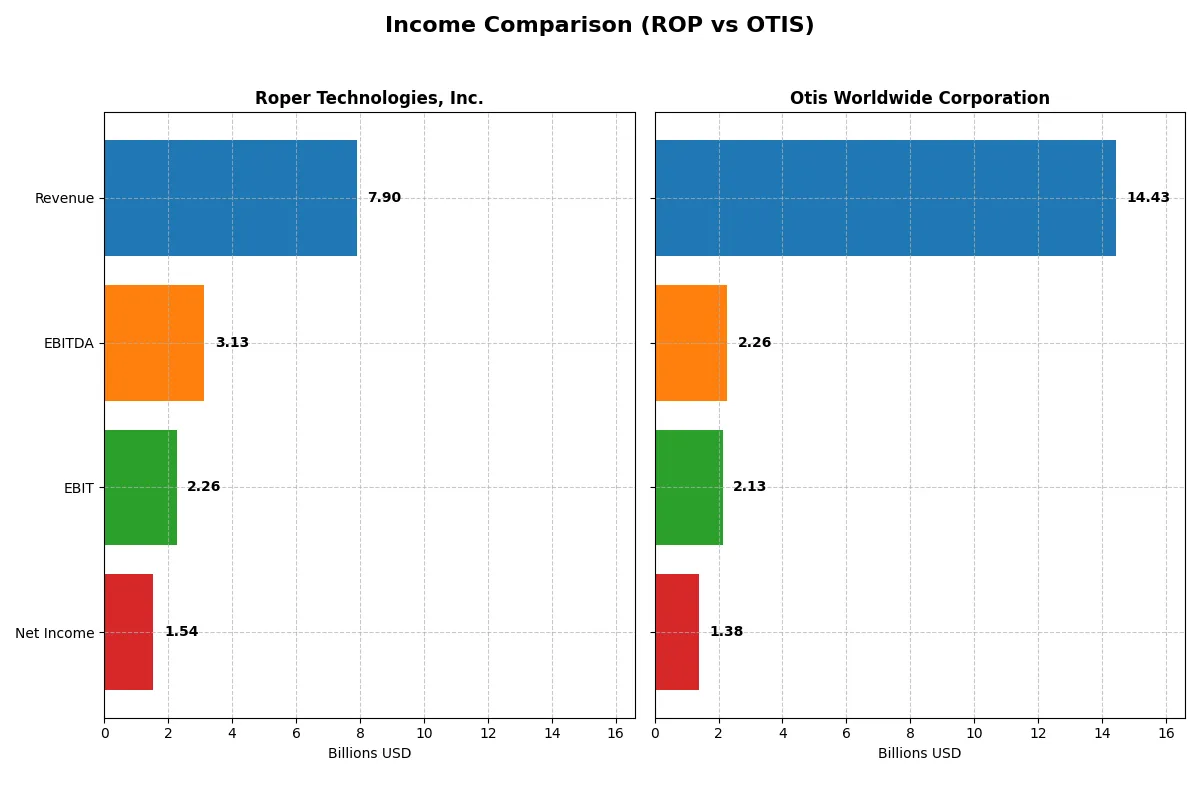
This data dissects the core profitability and scalability of both corporate engines to reveal who dominates the bottom line:
| Metric | Roper Technologies, Inc. (ROP) | Otis Worldwide Corporation (OTIS) |
|---|---|---|
| Revenue | 7.9B | 14.4B |
| Cost of Revenue | 2.43B | 10.0B |
| Operating Expenses | 3.24B | 2.20B |
| Gross Profit | 5.47B | 4.40B |
| EBITDA | 3.13B | 2.26B |
| EBIT | 2.26B | 2.13B |
| Interest Expense | 325M | 196M |
| Net Income | 1.54B | 1.38B |
| EPS | 14.31 | 3.53 |
| Fiscal Year | 2025 | 2025 |
Income Statement Analysis: The Bottom-Line Duel
This income statement comparison reveals which company operates its corporate engine with greater efficiency and financial discipline.
Roper Technologies, Inc. Analysis
Roper’s revenue climbed impressively from 4.8B in 2021 to 7.9B in 2025, marking strong growth momentum. Net income rose from 1.1B to 1.5B, supported by robust gross margins near 69%. Despite a slight dip in net margin recently, Roper sustains high operating efficiency with a stable EBIT margin above 28%.
Otis Worldwide Corporation Analysis
Otis posted steady revenue around 14B over the last five years, showing limited growth with a 1.2% rise in 2025. Net income increased moderately from 1.25B to 1.38B, but margins remain thinner, with gross margin at 30% and net margin under 10%. Otis exhibits stable profitability but slower expansion and tighter cost control.
Margin Strength vs. Revenue Scale
Roper leads in profitability, boasting superior gross and EBIT margins and a faster revenue growth rate. Otis delivers higher top-line figures but with significantly lower margins and sluggish growth. For investors prioritizing margin power and efficient earnings growth, Roper presents a stronger fundamental profile. Otis’s appeal lies more in scale than margin expansion.
Financial Ratios Comparison
These vital ratios act as a diagnostic tool to expose the underlying fiscal health, valuation premiums, and capital efficiency of the companies compared below:
| Ratios | Roper Technologies, Inc. (ROP) | Otis Worldwide Corporation (OTIS) |
|---|---|---|
| ROE | 7.7% | -25.7% |
| ROIC | 5.6% | 40.7% |
| P/E | 31.1 | 24.8 |
| P/B | 2.40 | -6.38 |
| Current Ratio | 0.52 | 0.85 |
| Quick Ratio | 0.48 | 0.77 |
| D/E (Debt-to-Equity) | 0.47 | -1.62 |
| Debt-to-Assets | 27.0% | 82.1% |
| Interest Coverage | 6.88 | 11.2 |
| Asset Turnover | 0.23 | 1.35 |
| Fixed Asset Turnover | 50.4 | 11.1 |
| Payout ratio | 23.1% | 46.7% |
| Dividend yield | 0.74% | 1.88% |
| Fiscal Year | 2025 | 2025 |
Efficiency & Valuation Duel: The Vital Signs
Financial ratios act as a company’s DNA, unveiling hidden risks and operational excellence crucial for investor scrutiny.
Roper Technologies, Inc.
Roper shows moderate profitability with a 7.7% ROE and strong 19.4% net margin, but its P/E of 31.1 signals an expensive valuation. The company balances neutral ROIC against favorable WACC, suggesting cautious capital efficiency. Dividend yield stands low at 0.74%, reflecting limited shareholder returns amid reinvestment focus.
Otis Worldwide Corporation
Otis posts a negative ROE of -25.7%, contrasting with a robust 40.7% ROIC, highlighting uneven profitability. Its P/E of 24.9 is reasonable, and a 1.88% dividend yield offers moderate shareholder income. Despite some leverage concerns, Otis displays superior asset turnover, signaling operational efficiency despite net margin neutrality.
Operational Efficiency vs. Valuation Stretch
Otis presents a better balance of operational efficiency and shareholder yield, despite its ROE headwind. Roper’s higher valuation and muted returns expose risk amid mediocre capital returns. Investors favoring strong cash flow and dividends may lean toward Otis, while those tolerating valuation premium might consider Roper’s growth potential.
Which one offers the Superior Shareholder Reward?
I compare Roper Technologies, Inc. (ROP) and Otis Worldwide Corporation (OTIS) based on their shareholder distribution strategies in 2025. ROP pays a modest 0.74% dividend yield with a conservative 23% payout ratio, backed by robust free cash flow coverage near 98%. ROP also executes strong buybacks, enhancing total shareholder return sustainably. OTIS offers a higher 1.88% yield but with a riskier 47% payout ratio and weaker dividend plus capex coverage under 2x. OTIS’s buyback activity is less intense, reflecting constrained cash flow in a highly leveraged balance sheet. Historically, ROP’s balanced dividend and aggressive buybacks align better with durable value creation. I conclude ROP delivers superior total shareholder reward, blending yield, buybacks, and sustainability more effectively than OTIS in 2026.
Comparative Score Analysis: The Strategic Profile
The radar chart reveals the fundamental DNA and strategic trade-offs of Roper Technologies and Otis Worldwide Corporation:
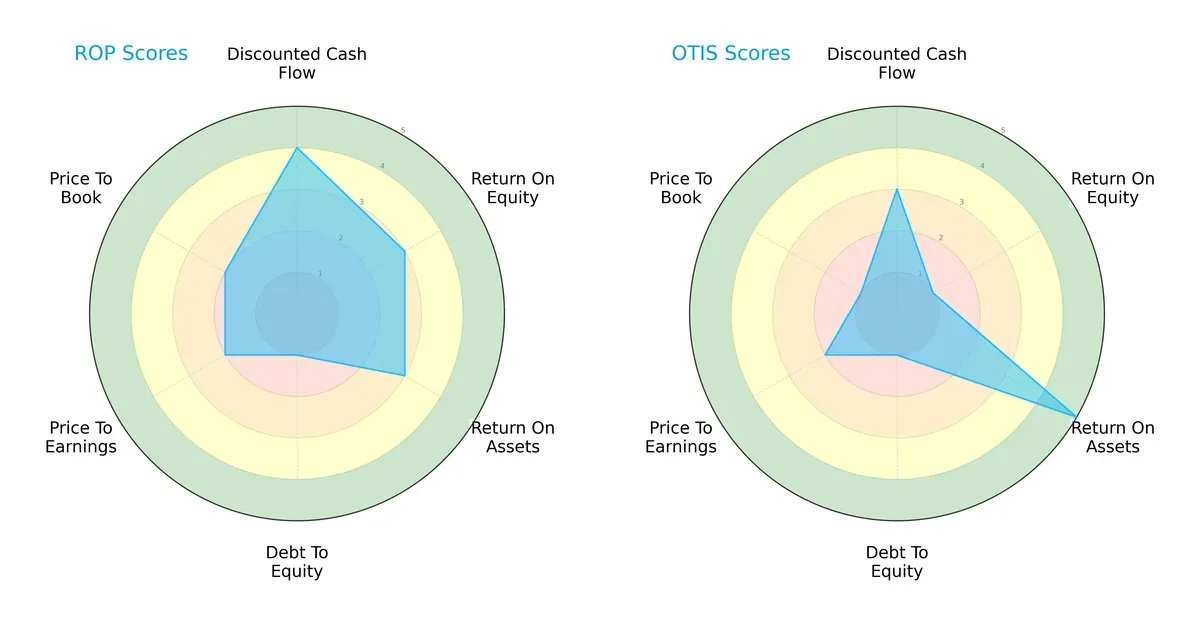
Roper shows a more balanced profile with moderate scores in ROE (3) and ROA (3), and a favorable DCF score (4). Otis relies heavily on asset efficiency, scoring very favorably in ROA (5) but suffers from low ROE (1). Both carry high financial risk, reflected in equally poor debt-to-equity scores (1). Valuation metrics (PE/PB) are moderate for Roper but weaker for Otis, indicating Roper’s more stable investment appeal.
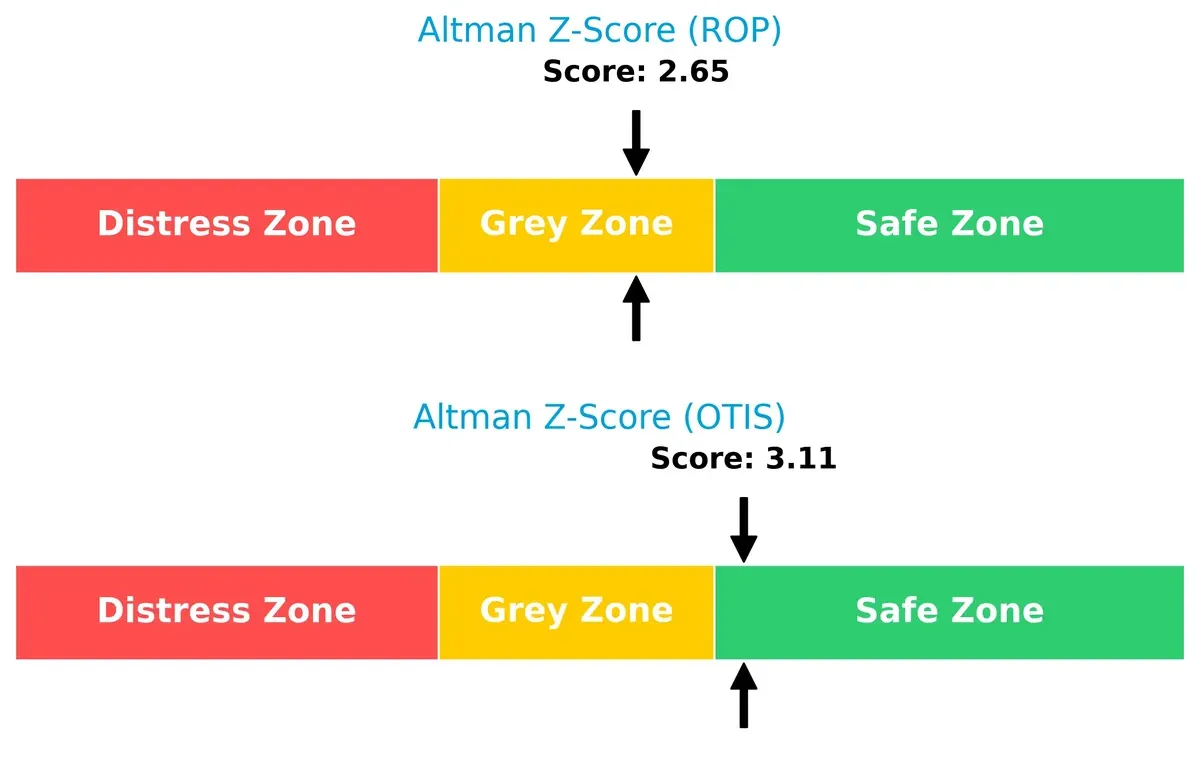
Bankruptcy Risk: Solvency Showdown
Otis’s Altman Z-Score at 3.11 places it safely above Roper’s 2.65, indicating Otis faces lower bankruptcy risk in this cycle:
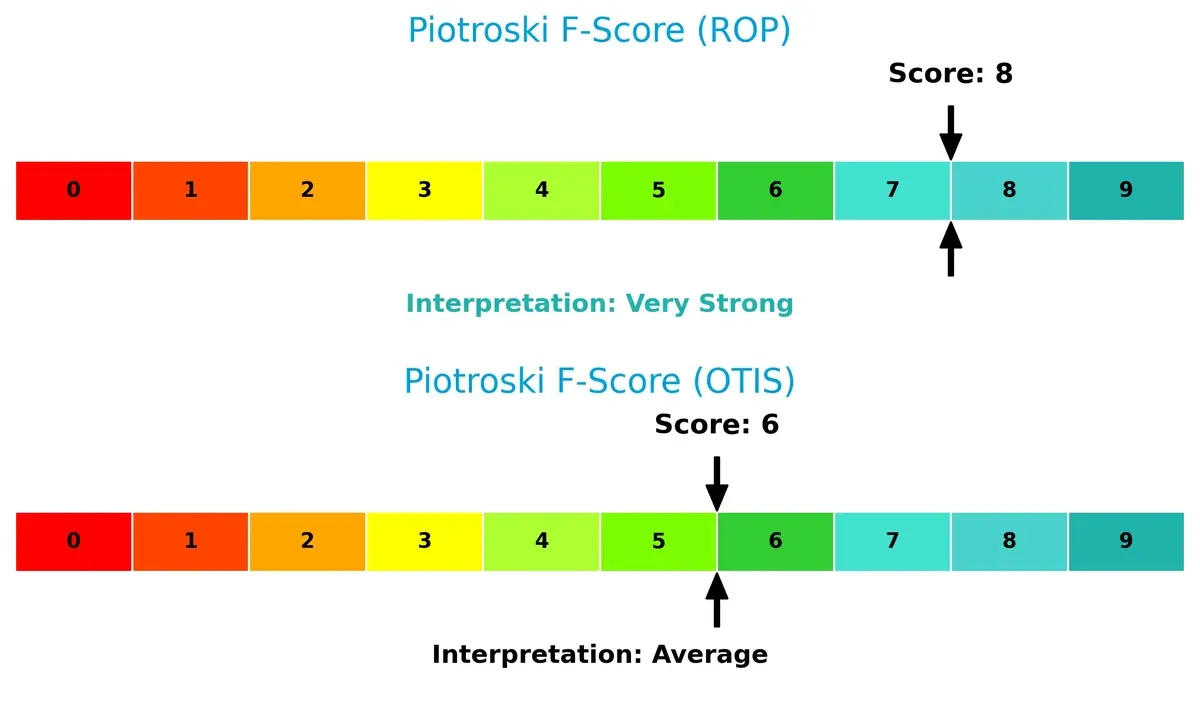
Financial Health: Quality of Operations
Roper’s Piotroski F-Score of 8 signals very strong internal financial health, outperforming Otis’s average score of 6 and highlighting Otis’s potential red flags in operational quality:
How are the two companies positioned?
This section dissects the operational DNA of ROP and OTIS by comparing their revenue distribution and internal dynamics. The goal is to confront their economic moats to identify which model offers the most resilient competitive advantage today.
Revenue Segmentation: The Strategic Mix
This visual comparison dissects how Roper Technologies and Otis Worldwide diversify their income streams and reveals where their primary sector bets lie:
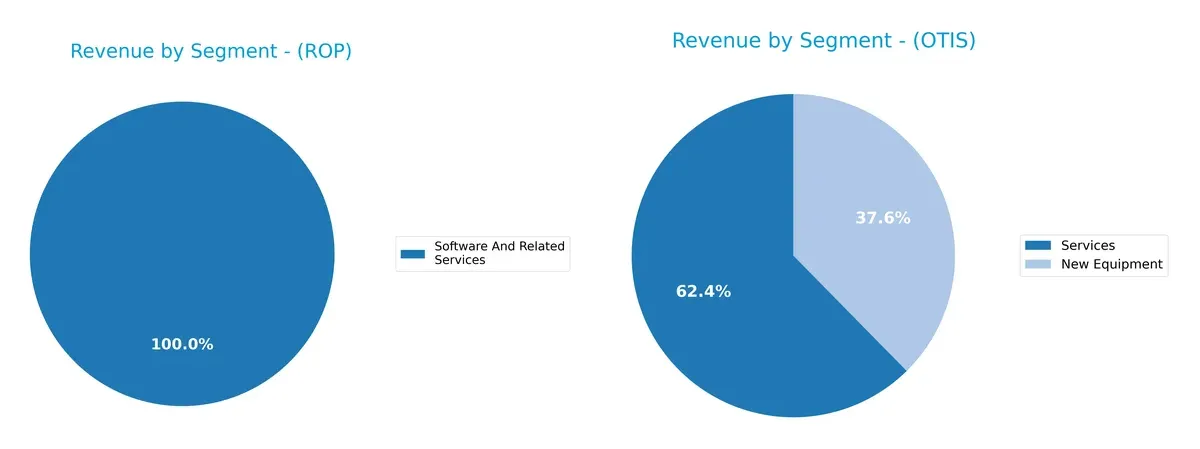
Roper’s revenue pivots heavily on Software And Related Services, reaching $10.7B in 2024, showing a concentrated tech-driven model. Otis balances $8.9B in Services with $5.4B from New Equipment, offering a more diversified industrial mix. Roper’s software dominance suggests ecosystem lock-in but also concentration risk. Otis’s split revenue anchors it in infrastructure maintenance and new installs, reducing vulnerability to sector shifts.
Strengths and Weaknesses Comparison
This table compares the Strengths and Weaknesses of Roper Technologies and Otis Worldwide Corporation:
Roper Technologies Strengths
- High net margin at 19.44%
- Favorable debt-to-assets at 26.9%
- Strong fixed asset turnover at 50.37
- Diverse software and products segments
- Solid interest coverage at 6.96
Otis Worldwide Strengths
- Very high ROIC at 40.74%
- Favorable interest coverage at 10.87
- Strong asset turnover at 1.35
- Balanced revenue from new equipment and services
- Favorable price-to-book ratio
Roper Technologies Weaknesses
- Low current and quick ratios (0.52 and 0.48)
- Unfavorable ROE at 7.73%
- Unfavorable P/E at 31.06
- Low asset turnover at 0.23
- Low dividend yield at 0.74%
Otis Worldwide Weaknesses
- Negative ROE at -25.67%
- High debt-to-assets at 82.14%
- Unfavorable current and quick ratios (0.85 and 0.77)
- Negative debt-to-equity ratio
- Moderate net margin at 9.59%
Roper shows strong profitability and asset management but faces liquidity challenges. Otis boasts excellent capital efficiency and turnover but struggles with profitability and leverage. Both companies display distinct financial profiles that impact their strategic positioning.
The Moat Duel: Analyzing Competitive Defensibility
A structural moat protects long-term profits from competition erosion. Without it, gains quickly vanish. Let’s dissect the moats of two industrial giants:
Roper Technologies, Inc.: Diversified Intangible Assets Moat
Roper’s moat stems from a broad portfolio of specialized software and engineered products. This diversity sustains high margins (28.6% EBIT) but ROIC trails WACC, signaling value destruction despite improving profitability. New digital offerings could deepen the moat if capital efficiency improves by 2026.
Otis Worldwide Corporation: Service Network and Scale Moat
Otis relies on a vast service network of 34,000 mechanics and entrenched customer relationships. Its ROIC exceeds WACC by 33%, showing strong value creation. Despite slower revenue growth, rising margins and expanding modernization services indicate a robust and widening moat.
Scale Network vs. Diversified Innovation: Who Defends Better?
Otis’s service-based moat generates superior capital returns and sustainable profits, unlike Roper’s asset-heavy model with improving but negative value creation. Otis stands better equipped to defend and grow market share through its entrenched, scalable network.
Which stock offers better returns?
Over the past year, both stocks experienced notable price declines, with Roper Technologies showing sharper losses and Otis Worldwide exhibiting signs of recent recovery amid varying trading volumes.
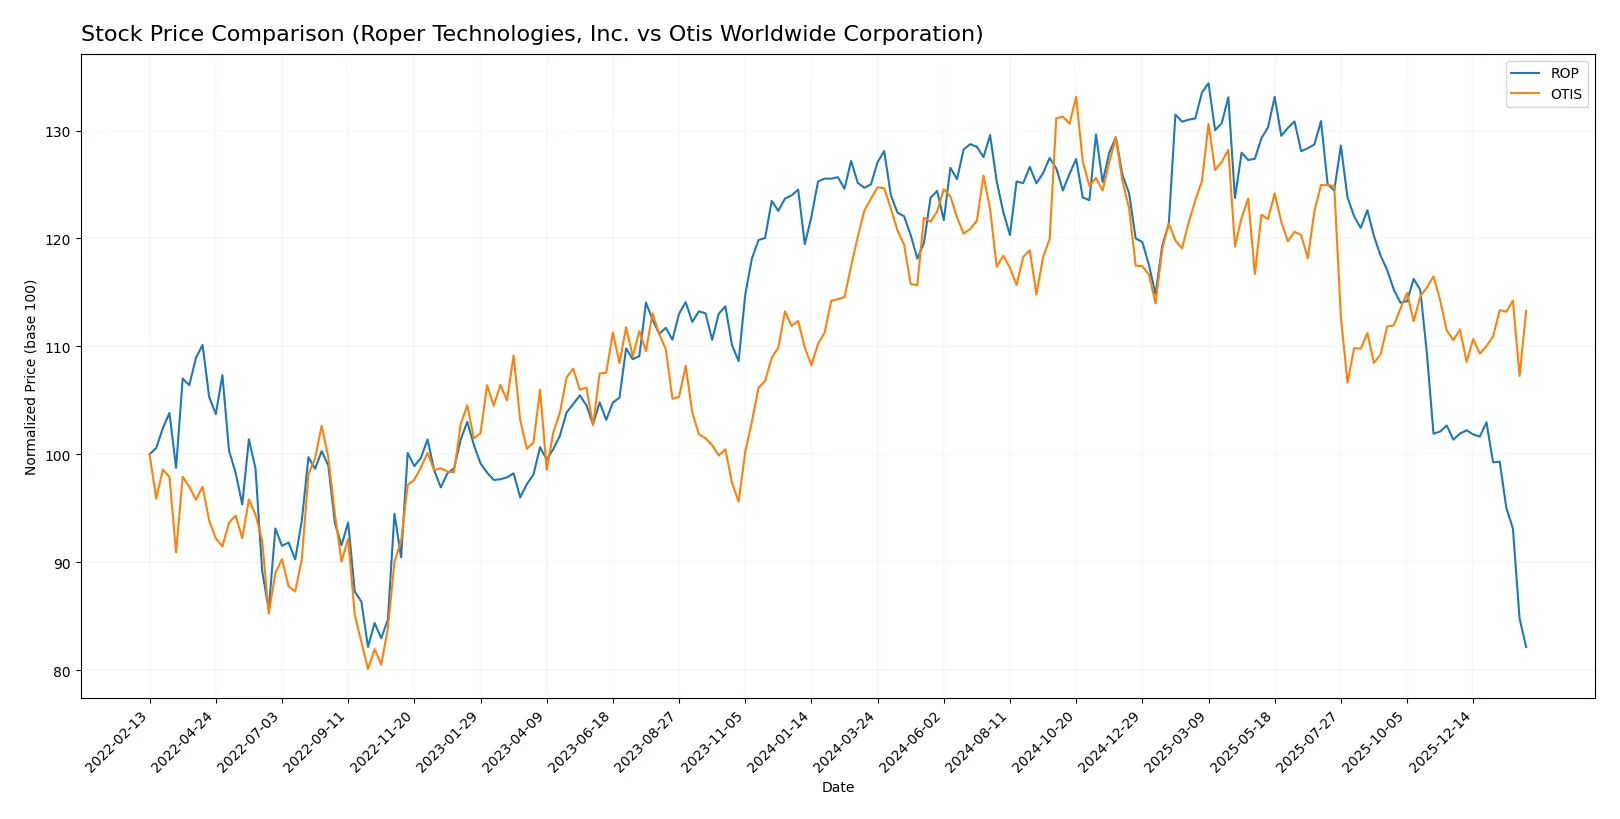
Trend Comparison
Roper Technologies suffered a 34.3% price drop over the last 12 months, marking a bearish trend with decelerating losses and high volatility between $359.6 and $588.38.
Otis Worldwide recorded an 8.4% decline over the same period, also bearish, but showing accelerating recovery recently with a slight 2.46% gain and low volatility between $84.93 and $106.01.
Comparing both, Otis Worldwide outperformed Roper Technologies, delivering a less severe overall decline and recent positive momentum.
Target Prices
Analysts show a clear consensus on target prices for Roper Technologies and Otis Worldwide.
| Company | Target Low | Target High | Consensus |
|---|---|---|---|
| Roper Technologies, Inc. | 365 | 575 | 475.5 |
| Otis Worldwide Corporation | 92 | 109 | 97.75 |
The consensus target for Roper exceeds its current price of 360 by 32%, signaling strong upside potential. Otis’s target consensus at 97.75 is 8% above its current 90, suggesting modest appreciation expectations.

Don’t Let Luck Decide Your Entry Point
Optimize your entry points with our advanced ProRealTime indicators. You’ll get efficient buy signals with precise price targets for maximum performance. Start outperforming now!
How do institutions grade them?
Roper Technologies, Inc. Grades
Here are the recent grades assigned by major financial institutions for Roper Technologies, Inc.:
| Grading Company | Action | New Grade | Date |
|---|---|---|---|
| Goldman Sachs | Maintain | Neutral | 2026-01-29 |
| Argus Research | Downgrade | Hold | 2026-01-28 |
| Mizuho | Maintain | Underperform | 2026-01-28 |
| RBC Capital | Maintain | Sector Perform | 2026-01-28 |
| Stifel | Downgrade | Hold | 2026-01-28 |
| Citigroup | Maintain | Buy | 2026-01-28 |
| JP Morgan | Maintain | Underweight | 2026-01-28 |
| Truist Securities | Maintain | Buy | 2026-01-28 |
| Barclays | Maintain | Underweight | 2026-01-28 |
| Oppenheimer | Downgrade | Perform | 2026-01-28 |
Otis Worldwide Corporation Grades
The following table summarizes the recent institutional grades for Otis Worldwide Corporation:
| Grading Company | Action | New Grade | Date |
|---|---|---|---|
| JP Morgan | Maintain | Overweight | 2026-01-16 |
| Wells Fargo | Maintain | Equal Weight | 2025-12-15 |
| Barclays | Maintain | Underweight | 2025-10-30 |
| JP Morgan | Maintain | Overweight | 2025-10-15 |
| Wolfe Research | Upgrade | Outperform | 2025-10-08 |
| Wells Fargo | Maintain | Equal Weight | 2025-10-06 |
| JP Morgan | Maintain | Overweight | 2025-09-18 |
| RBC Capital | Maintain | Outperform | 2025-07-28 |
| Wolfe Research | Upgrade | Peer Perform | 2025-07-25 |
| Wells Fargo | Maintain | Equal Weight | 2025-07-24 |
Which company has the best grades?
Otis Worldwide Corporation consistently receives more favorable ratings, including multiple “Overweight” and “Outperform” grades. Roper Technologies has several downgrades and more neutral to cautious ratings. This divergence could influence investor sentiment and portfolio positioning.
Risks specific to each company
The following categories identify critical pressure points and systemic threats facing Roper Technologies, Inc. and Otis Worldwide Corporation in the 2026 market environment:
1. Market & Competition
Roper Technologies, Inc.
- Diversified software and engineered products face intense tech innovation and industry-specific rivals.
Otis Worldwide Corporation
- Dominates elevator/escalator market but exposed to cyclical construction demand and emerging mobility tech competitors.
2. Capital Structure & Debt
Roper Technologies, Inc.
- Moderate debt-to-equity (0.47) with strong interest coverage (6.96) signals manageable leverage.
Otis Worldwide Corporation
- Very high debt-to-assets (82.14%) and negative debt-to-equity indicate precarious capital structure despite good interest coverage (10.87).
3. Stock Volatility
Roper Technologies, Inc.
- Beta below 1 (0.93) suggests lower volatility than broader market.
Otis Worldwide Corporation
- Beta around 1.01 indicates market-level volatility with potential swings tied to industry cycles.
4. Regulatory & Legal
Roper Technologies, Inc.
- Software and healthcare segments face evolving compliance standards, data privacy, and IP risks.
Otis Worldwide Corporation
- Infrastructure and safety regulations in elevators/escalators carry compliance costs and potential liability exposure.
5. Supply Chain & Operations
Roper Technologies, Inc.
- Complex global supply chain for components and software services vulnerable to disruptions.
Otis Worldwide Corporation
- Large service network and installation operations exposed to labor shortages and material cost inflation.
6. ESG & Climate Transition
Roper Technologies, Inc.
- Moderate ESG risks; innovation in energy-efficient solutions could drive future growth.
Otis Worldwide Corporation
- High focus on sustainability in building vertical transport; transition risks tied to regulatory pressures.
7. Geopolitical Exposure
Roper Technologies, Inc.
- U.S.-centric but with some international operations; moderate exposure to trade tensions.
Otis Worldwide Corporation
- Significant international footprint, especially in China; geopolitical tensions pose operational risks.
Which company shows a better risk-adjusted profile?
Roper’s most impactful risk is its weak liquidity position, with current and quick ratios below 0.6, raising short-term solvency concerns. Otis’s critical risk lies in its leveraged capital structure, with debt-to-assets above 80%, increasing financial vulnerability. Despite these, Otis’s Altman Z-score in the safe zone and robust interest coverage suggest better bankruptcy resilience. Roper’s strong Piotroski score signals operational strength but balanced by moderate solvency risk. Overall, Otis presents a slightly better risk-adjusted profile due to superior asset utilization and financial safety margins despite higher leverage.
Final Verdict: Which stock to choose?
Roper Technologies shines as a cash machine with robust operating margins and steadily growing profitability. Its efficiency in capital allocation fuels long-term growth. However, a low current ratio signals liquidity caution—a point of vigilance for risk-averse investors. It suits portfolios targeting Aggressive Growth with tolerance for short-term financial tightness.
Otis Worldwide commands a strategic moat through its strong return on invested capital well above cost of capital, reflecting a sustainable competitive advantage. Its more stable balance sheet and moderate valuation offer a safer profile compared to Roper. This makes Otis a fit for GARP investors who value steady growth combined with reasonable risk.
If you prioritize aggressive expansion and can tolerate liquidity risks, Roper outshines with its operational efficiency and growth trajectory. However, if you seek better stability and a strong economic moat backed by consistent value creation, Otis offers a compelling case despite a more conservative growth outlook. Both present distinct investment scenarios aligned with different risk appetites and strategic goals.
Disclaimer: Investment carries a risk of loss of initial capital. The past performance is not a reliable indicator of future results. Be sure to understand risks before making an investment decision.
Go Further
I encourage you to read the complete analyses of Roper Technologies, Inc. and Otis Worldwide Corporation to enhance your investment decisions: