Home > Comparison > Industrials > ROK vs OTIS
The strategic rivalry between Rockwell Automation, Inc. and Otis Worldwide Corporation shapes the industrial machinery sector’s future. Rockwell excels as a technology-driven automation solutions provider, while Otis dominates as a global elevator and escalator manufacturer with extensive service operations. This clash highlights a contrast between digital innovation and capital-intensive infrastructure leadership. This analysis will assess which company offers the superior risk-adjusted growth potential for a diversified portfolio in 2026.
Table of contents
Companies Overview
Rockwell Automation and Otis Worldwide anchor critical niches in industrial machinery with strong global footprints and innovative offerings.
Rockwell Automation, Inc.: Industrial Automation and Digital Transformation Leader
Rockwell Automation dominates industrial automation through its core business spanning Intelligent Devices, Software & Control, and Lifecycle Services. Its revenue derives from hardware, software, and consulting services for diverse sectors, including automotive and oil & gas. In 2026, the company sharpened its strategic focus on digital transformation and connected services, reinforcing its edge in Industry 4.0 solutions.
Otis Worldwide Corporation: Premier Elevator and Escalator Manufacturer and Servicer
Otis Worldwide commands the vertical transportation market by designing, manufacturing, and servicing elevators and escalators globally. Its revenue splits between New Equipment sales and ongoing Service contracts, supported by 34,000 service mechanics worldwide. In 2026, Otis prioritized expanding its maintenance network and modernization services to boost recurring revenue streams and customer retention.
Strategic Collision: Similarities & Divergences
Both companies excel in industrial machinery but diverge sharply in business models. Rockwell Automation embraces a technology-driven, open ecosystem integrating hardware and software, while Otis operates a closed infrastructure focused on long-term service contracts. Their primary battleground rests in smart building automation versus infrastructure modernization. Investors face distinct profiles: Rockwell offers digital growth potential; Otis delivers stable, service-based cash flows.
Income Statement Comparison
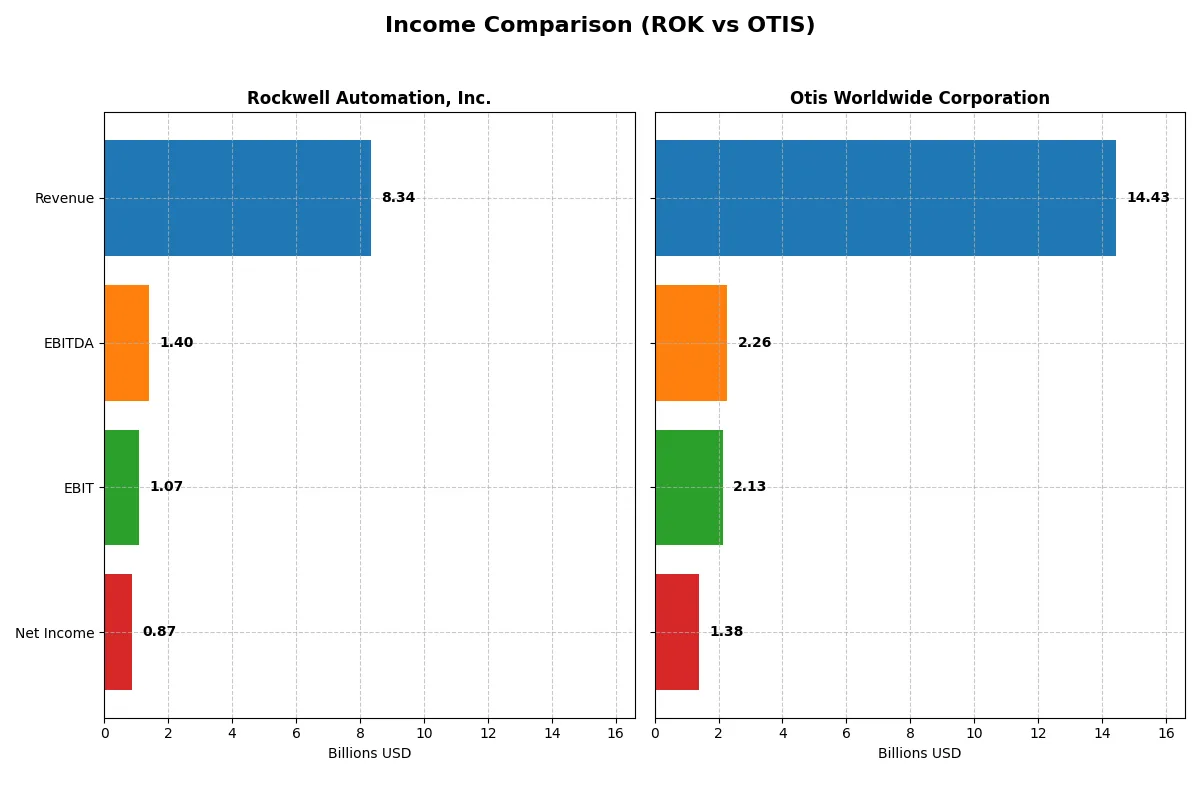
The following data dissects the core profitability and scalability of both corporate engines to reveal who dominates the bottom line:
| Metric | Rockwell Automation (ROK) | Otis Worldwide (OTIS) |
|---|---|---|
| Revenue | 8.34B | 14.43B |
| Cost of Revenue | 4.33B | 10.04B |
| Operating Expenses | 2.59B | 2.20B |
| Gross Profit | 4.02B | 4.40B |
| EBITDA | 1.40B | 2.26B |
| EBIT | 1.07B | 2.13B |
| Interest Expense | 156M | 196M |
| Net Income | 869M | 1.38B |
| EPS | 7.69 | 3.53 |
| Fiscal Year | 2025 | 2025 |
Income Statement Analysis: The Bottom-Line Duel
This income statement comparison reveals which company operates with greater efficiency and sustainable profitability.
Rockwell Automation, Inc. Analysis
Rockwell Automation’s revenue rose steadily from $7B in 2021 to $8.3B in 2025, but net income declined from $1.36B to $867M, signaling margin pressures. Its gross margin holds strong at 48.1%, yet net margin slipped to 10.4%, reflecting weaker earnings efficiency and declining EPS momentum in 2025.
Otis Worldwide Corporation Analysis
Otis’ revenue grew modestly from $14.3B in 2021 to $14.4B in 2025, while net income increased from $1.25B to $1.38B, showing improving profitability. Gross margin stands at 30.5%, lower than Rockwell’s, but Otis boasts a healthier EBIT margin at 14.8% and net margin close to 9.6%, evidencing operational stability.
Margin Strength vs. Profit Growth
Rockwell Automation leads in gross margin but suffers from declining net income and EPS, indicating margin erosion and profit challenges. Otis maintains moderate margins but delivers consistent net income growth and EPS expansion over the period. Otis’ profile appears more attractive for investors prioritizing steady profit growth and margin resilience.
Financial Ratios Comparison
These vital ratios act as a diagnostic tool to expose the underlying fiscal health, valuation premiums, and capital efficiency of the companies compared here:
| Ratios | Rockwell Automation (ROK) | Otis Worldwide (OTIS) |
|---|---|---|
| ROE | 23.8% | -25.7% |
| ROIC | 13.7% | 40.7% |
| P/E | 45.3 | 24.8 |
| P/B | 10.8 | -6.38 |
| Current Ratio | 1.14 | 0.85 |
| Quick Ratio | 0.77 | 0.77 |
| D/E | 1.00 | -1.62 |
| Debt-to-Assets | 32.5% | 82.1% |
| Interest Coverage | 9.12 | 11.2 |
| Asset Turnover | 0.74 | 1.35 |
| Fixed Asset Turnover | 6.95 | 11.13 |
| Payout ratio | 68.0% | 46.7% |
| Dividend yield | 1.50% | 1.88% |
| Fiscal Year | 2025 | 2025 |
Efficiency & Valuation Duel: The Vital Signs
Ratios act as the company’s DNA, exposing hidden risks and operational strengths that define its market stance and shareholder value.
Rockwell Automation, Inc.
Rockwell Automation shows strong profitability with a 23.78% ROE and a 10.42% net margin, indicating efficient core operations. Yet, its valuation looks stretched, with a high P/E of 45.33 and P/B of 10.78. The 1.5% dividend yield offers modest shareholder returns alongside reinvestment into R&D, balancing growth and income.
Otis Worldwide Corporation
Otis posts a solid 40.74% ROIC, signaling efficient capital deployment despite a negative -25.67% ROE, reflecting recent challenges. Its valuation appears reasonable with a P/E near 24.85 and a favorable P/B. Otis yields 1.88% in dividends, supporting shareholders amid focused reinvestment in operational improvements and growth.
Valuation Stretch vs. Capital Efficiency Balance
Rockwell Automation trades at a premium with strong profitability but stretched valuation multiples. Otis offers superior capital efficiency and a more moderate valuation, though profitability is hindered by negative ROE. Investors seeking stable returns may lean toward Rockwell; those prioritizing capital efficiency and value might prefer Otis.
Which one offers the Superior Shareholder Reward?
I see Rockwell Automation (ROK) and Otis Worldwide (OTIS) both pay dividends but differ in distribution style. ROK yields 1.5% with a high 68% payout ratio backed by strong free cash flow coverage (1.99x). OTIS offers a slightly better 1.88% yield with a lower 47% payout ratio and solid cash flow coverage (2x). ROK deploys more aggressive buybacks, enhancing total returns, while OTIS’s conservative buyback approach reflects its cautious capital allocation amid heavy leverage. I find ROK’s combined dividend and buyback strategy more sustainable and rewarding for 2026 investors seeking balanced income and growth.
Comparative Score Analysis: The Strategic Profile
The radar chart reveals the fundamental DNA and trade-offs of Rockwell Automation and Otis Worldwide, highlighting their strategic strengths and weaknesses:
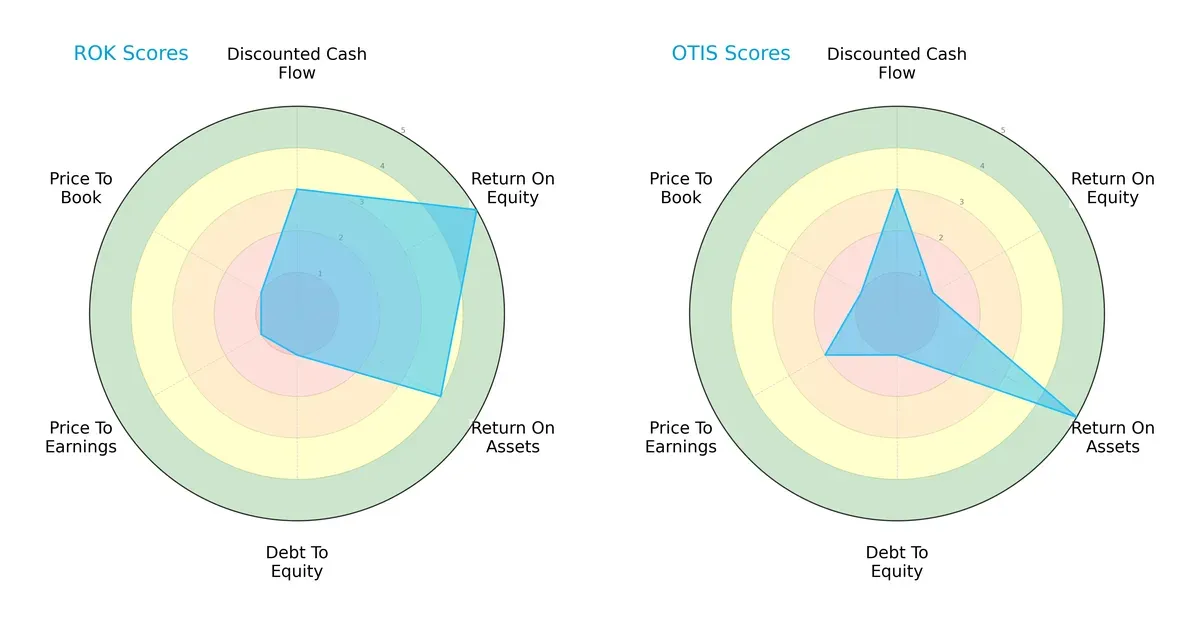
Rockwell Automation scores higher on ROE (5 vs. 1) and ROA (4 vs. 5), showing strong profitability and asset use. Otis edges slightly on asset efficiency but lags significantly in equity returns. Both firms bear heavy financial leverage risk with poor debt-to-equity scores (1 each). Valuation metrics (P/E and P/B) favor Otis modestly but remain weak overall. Rockwell’s profile is less balanced, relying heavily on operational efficiency, while Otis shows a more moderate, if less profitable, approach.
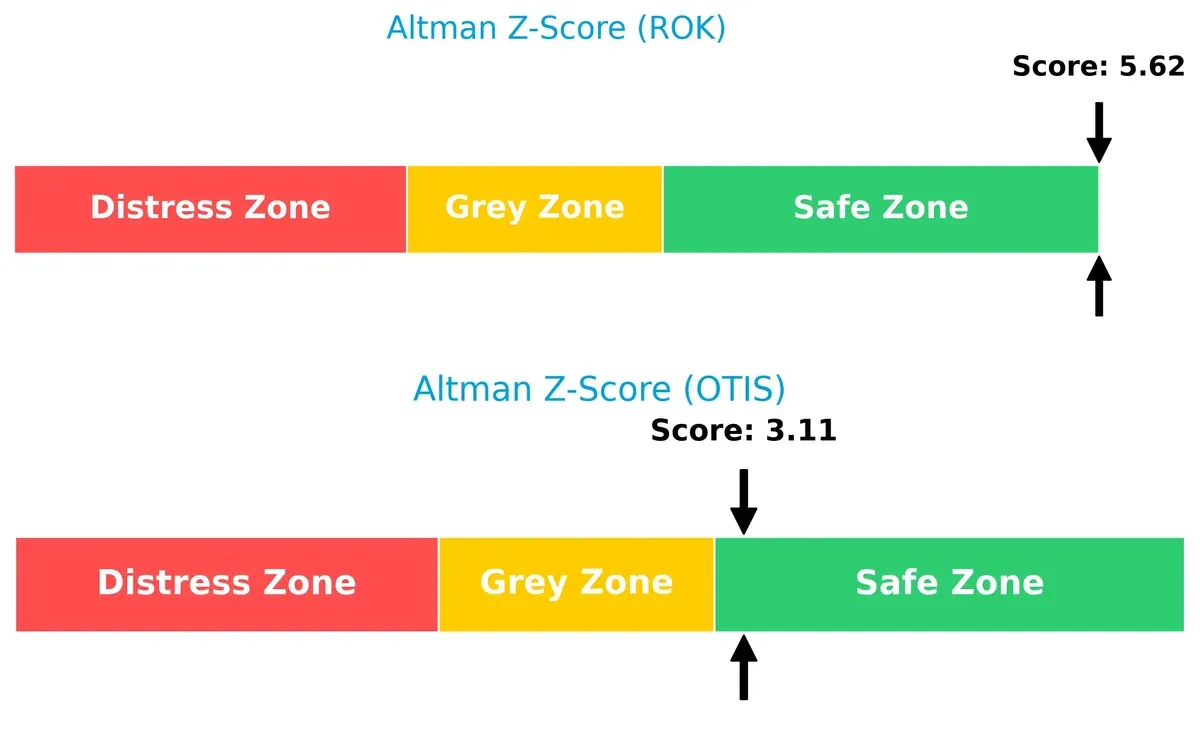
Bankruptcy Risk: Solvency Showdown
Rockwell’s Altman Z-Score of 5.62 versus Otis’s 3.11 indicates both firms reside safely above distress thresholds, but Rockwell commands a wider margin for survival in volatile cycles:
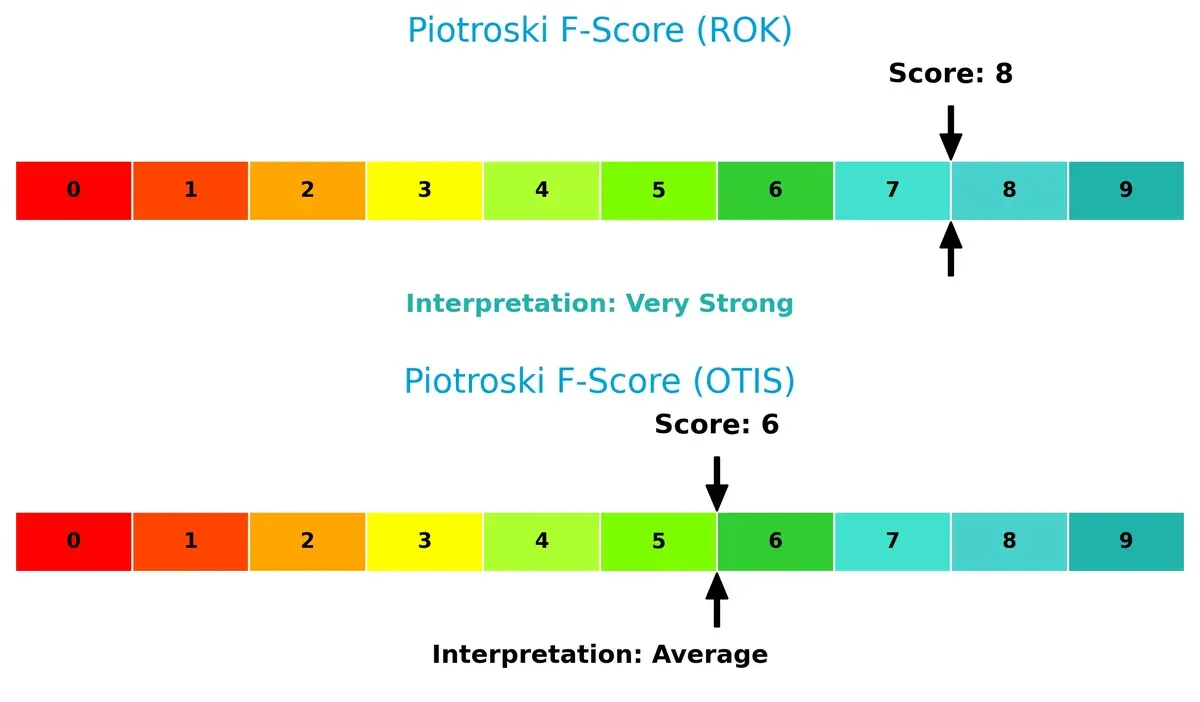
Financial Health: Quality of Operations
Rockwell’s Piotroski F-Score of 8 signals very strong financial health compared to Otis’s average score of 6. Investors should note Otis’s weaker internal metrics as potential red flags relative to Rockwell’s robust operational quality:
How are the two companies positioned?
This section dissects the operational DNA of Rockwell Automation and Otis by comparing their revenue distribution and internal dynamics. The ultimate goal is to confront their economic moats to reveal which business model delivers the most resilient competitive advantage today.
Revenue Segmentation: The Strategic Mix
This visual comparison dissects how Rockwell Automation and Otis Worldwide diversify their income streams and where their primary sector bets lie:
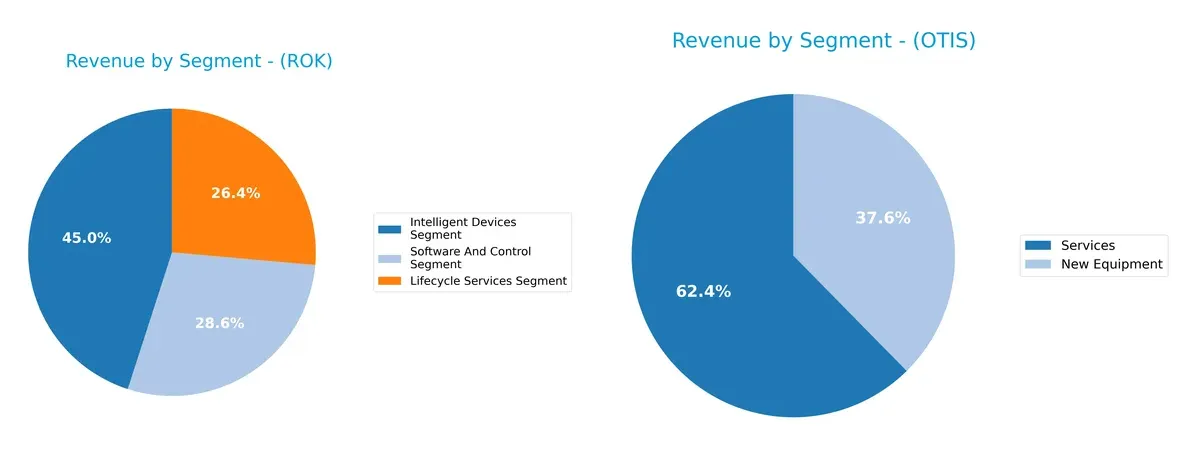
Rockwell Automation shows a balanced revenue mix with Intelligent Devices at $3.76B, Lifecycle Services at $2.20B, and Software & Control at $2.38B in 2025. Otis leans heavily on Services, generating $8.89B versus $5.37B from New Equipment in 2024. Rockwell’s diversified segments reduce concentration risk, while Otis’s service dominance anchors recurring revenue, signaling strong ecosystem lock-in in infrastructure maintenance.
Strengths and Weaknesses Comparison
This table compares the Strengths and Weaknesses of Rockwell Automation, Inc. (ROK) and Otis Worldwide Corporation (OTIS):
ROK Strengths
- Diversified revenue with Intelligent Devices, Lifecycle Services, and Software segments
- Favorable net margin of 10.42% and ROE of 23.78%
- Strong interest coverage of 6.88 and fixed asset turnover at 6.95
- Significant North American revenue base, especially in the U.S.
OTIS Strengths
- High ROIC at 40.74% exceeding WACC of 7.44%
- Favorable asset turnover metrics including 11.13 fixed asset turnover
- Strong interest coverage at 10.87
- Large revenue from Services and New Equipment
- Global presence with notable revenue from China and the U.S.
ROK Weaknesses
- Unfavorable valuation metrics: PE 45.33 and PB 10.78
- Quick ratio at 0.77 indicates liquidity pressure
- WACC higher than ROIC suggests capital cost concerns
- Moderate debt-to-assets at 32.51% with neutral leverage
OTIS Weaknesses
- Negative ROE at -25.67% signals profitability issues
- High debt-to-assets at 82.14% raises financial risk
- Low liquidity with current and quick ratios at 0.85 and 0.77
- Negative debt-to-equity ratio indicates accounting or structural concerns
Both companies exhibit slightly favorable overall financial profiles but face liquidity and valuation challenges. ROK benefits from a diversified product mix and strong profitability, while OTIS excels in capital efficiency and asset utilization despite high leverage and weak return on equity. This contrast highlights different strategic focuses and risk exposures in their financial management.
The Moat Duel: Analyzing Competitive Defensibility
A structural moat alone shields long-term profits from relentless competitive erosion in industrial machinery sectors:
Rockwell Automation, Inc.: Digital Integration Moat
Rockwell’s moat stems from intangible assets and software-driven solutions. Its high ROIC above WACC and margin stability confirm value creation. Expansion in digital transformation deepens this advantage in 2026.
Otis Worldwide Corporation: Service Network Moat
Otis relies on an extensive service network and installed base. Its ROIC far exceeds WACC, reflecting superior capital efficiency compared to Rockwell. Growth in modernization services offers strong upside potential in 2026.
Automation Software vs. Service Network: The Moat Face-Off
Otis’s wider moat, backed by a 33% ROIC premium over WACC, surpasses Rockwell’s 3% edge. Otis’s entrenched service ecosystem better defends market share against competitive threats.
Which stock offers better returns?
The past year shows Rockwell Automation’s stock surging over 52%, with accelerating gains and notable price volatility. Otis Worldwide’s shares declined 8.4%, despite recent slight recovery.
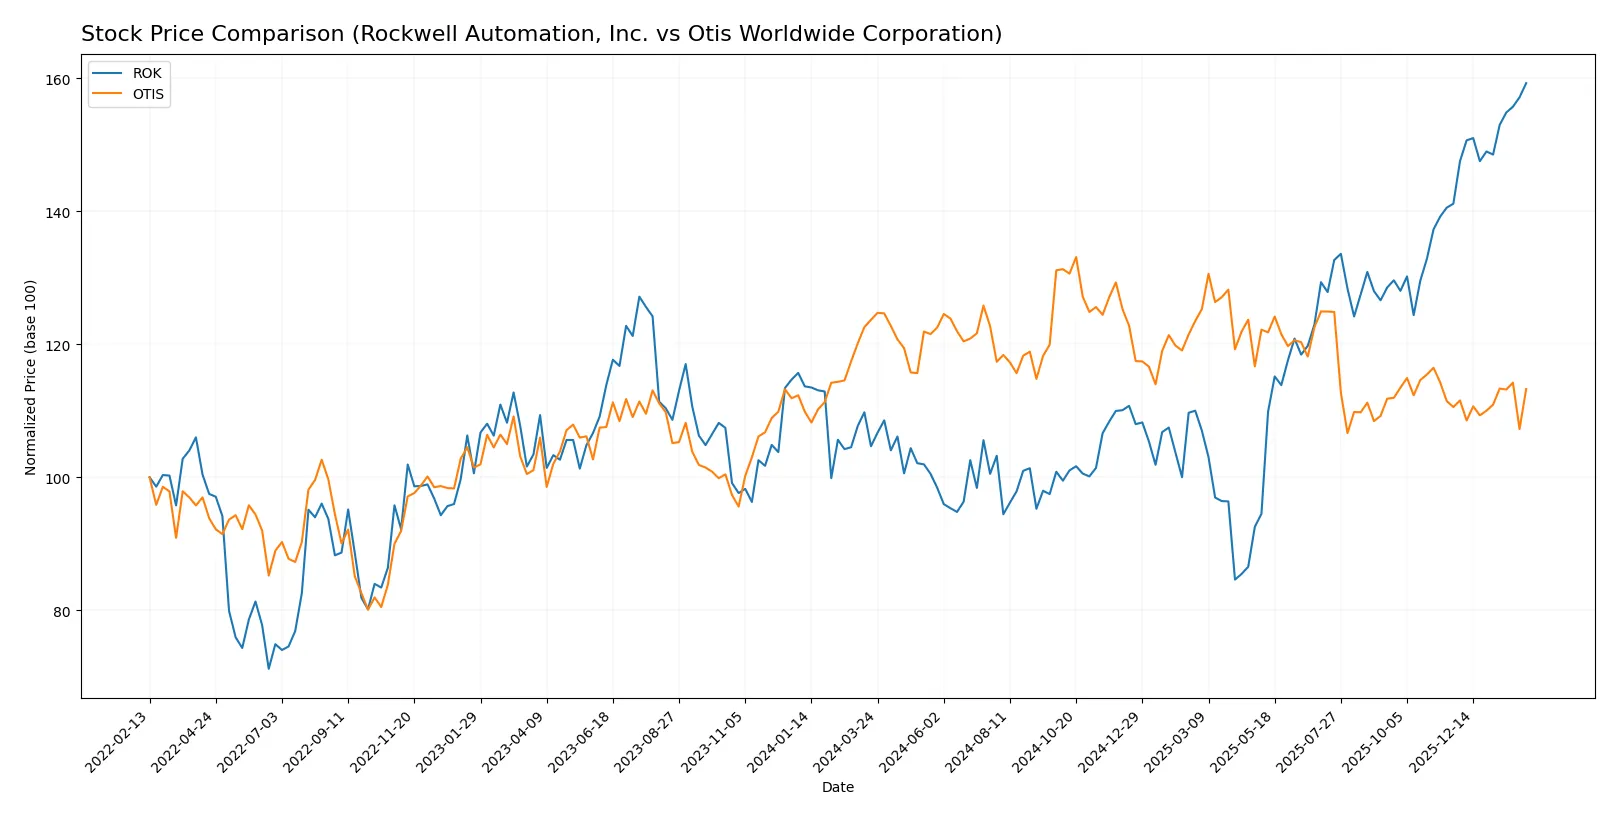
Trend Comparison
Rockwell Automation’s stock rose 52.14% over 12 months, marking a bullish trend with accelerating momentum and high volatility. The price ranged from 227.11 to 427.34.
Otis Worldwide’s shares dropped 8.4% in the same period, reflecting a bearish trend despite recent minor gains near 2.46%. Price volatility remained modest.
Rockwell Automation outperformed Otis Worldwide, delivering a significantly stronger market return and more dynamic price movement.
Target Prices
Analysts present a clear consensus on target prices for Rockwell Automation and Otis Worldwide.
| Company | Target Low | Target High | Consensus |
|---|---|---|---|
| Rockwell Automation, Inc. | 380 | 470 | 421.57 |
| Otis Worldwide Corporation | 92 | 109 | 97.75 |
The consensus target for Rockwell Automation slightly undercuts its current price of 426, suggesting moderate upside potential. Otis trades below its consensus target, indicating attractive room for price appreciation.

Don’t Let Luck Decide Your Entry Point
Optimize your entry points with our advanced ProRealTime indicators. You’ll get efficient buy signals with precise price targets for maximum performance. Start outperforming now!
How do institutions grade them?
Rockwell Automation, Inc. Grades
The following table summarizes recent institutional grades for Rockwell Automation, Inc.:
| Grading Company | Action | New Grade | Date |
|---|---|---|---|
| Oppenheimer | Downgrade | Perform | 2026-01-20 |
| JP Morgan | Maintain | Neutral | 2026-01-16 |
| Morgan Stanley | Maintain | Overweight | 2026-01-13 |
| Barclays | Maintain | Overweight | 2026-01-07 |
| Wells Fargo | Maintain | Equal Weight | 2026-01-07 |
| Goldman Sachs | Upgrade | Neutral | 2025-12-16 |
| Jefferies | Maintain | Buy | 2025-12-10 |
| Citigroup | Maintain | Buy | 2025-12-08 |
| Barclays | Maintain | Overweight | 2025-12-04 |
| Baird | Maintain | Outperform | 2025-11-21 |
Otis Worldwide Corporation Grades
The following table summarizes recent institutional grades for Otis Worldwide Corporation:
| Grading Company | Action | New Grade | Date |
|---|---|---|---|
| JP Morgan | Maintain | Overweight | 2026-01-16 |
| Wells Fargo | Maintain | Equal Weight | 2025-12-15 |
| Barclays | Maintain | Underweight | 2025-10-30 |
| JP Morgan | Maintain | Overweight | 2025-10-15 |
| Wolfe Research | Upgrade | Outperform | 2025-10-08 |
| Wells Fargo | Maintain | Equal Weight | 2025-10-06 |
| JP Morgan | Maintain | Overweight | 2025-09-18 |
| RBC Capital | Maintain | Outperform | 2025-07-28 |
| Wolfe Research | Upgrade | Peer Perform | 2025-07-25 |
| Wells Fargo | Maintain | Equal Weight | 2025-07-24 |
Which company has the best grades?
Rockwell Automation receives a broader range of “Buy” and “Outperform” ratings with some recent downgrades. Otis shows consistent “Overweight” and “Equal Weight” grades, with fewer high buy ratings. Investors may interpret Rockwell’s mixed grades as higher volatility in analyst sentiment.
Risks specific to each company
The following categories identify critical pressure points and systemic threats facing Rockwell Automation, Inc. and Otis Worldwide Corporation in the 2026 market environment:
1. Market & Competition
Rockwell Automation, Inc.
- Faces intense competition in industrial automation with pressure to innovate in digital transformation.
Otis Worldwide Corporation
- Operates in mature elevator/escalator markets; faces competitive pricing and modernization demand challenges.
2. Capital Structure & Debt
Rockwell Automation, Inc.
- Maintains neutral debt levels with debt-to-assets at 32.5%, but weak debt-to-equity score signals potential financial risk.
Otis Worldwide Corporation
- Exhibits high leverage with 82.1% debt-to-assets and unfavorable debt-to-equity, raising financial stability concerns.
3. Stock Volatility
Rockwell Automation, Inc.
- Beta at 1.53 indicates higher volatility than the market, increasing investment risk.
Otis Worldwide Corporation
- Beta near 1.01 shows market-aligned volatility, offering more stable stock price behavior.
4. Regulatory & Legal
Rockwell Automation, Inc.
- Subject to industrial safety and international trade regulations; digital security compliance adds complexity.
Otis Worldwide Corporation
- Faces stringent building codes and safety regulations worldwide, with modernization services under regulatory scrutiny.
5. Supply Chain & Operations
Rockwell Automation, Inc.
- Complex supply chain for hardware/software components vulnerable to semiconductor shortages and logistics disruptions.
Otis Worldwide Corporation
- Extensive global service network demands robust supply chain; relies heavily on timely parts delivery for maintenance.
6. ESG & Climate Transition
Rockwell Automation, Inc.
- Increasing pressure to enhance energy-efficient automation and reduce carbon footprint in manufacturing.
Otis Worldwide Corporation
- Faces challenges in reducing environmental impact of elevator operations and integrating sustainable materials.
7. Geopolitical Exposure
Rockwell Automation, Inc.
- Significant international sales expose it to trade tensions and currency risks.
Otis Worldwide Corporation
- Global footprint, especially in infrastructure markets, exposes the firm to geopolitical instability and regulatory shifts.
Which company shows a better risk-adjusted profile?
Rockwell Automation’s key risk is its elevated stock volatility and weaker debt-to-equity stance, despite strong profitability metrics. Otis’s primary concern is its high leverage and negative return on equity, which strains its financial stability. I see Rockwell Automation offering a better risk-adjusted profile, supported by a very strong Piotroski score of 8 and an Altman Z-score well within the safe zone at 5.62. Otis’s Z-score of 3.11 also sits in the safe zone but with a middling Piotroski score of 6 and high debt, it carries more financial risk. The recent market volatility reflected in Rockwell’s 1.53 beta confirms risk sensitivity, yet Otis’s debt burden remains the most pressing red flag.
Final Verdict: Which stock to choose?
Rockwell Automation, Inc. (ROK) wields unmatched operational efficiency and a proven ability to create value through growing ROIC well above its cost of capital. Its main point of vigilance lies in a stretched valuation and moderate liquidity ratios. ROK suits portfolios focused on aggressive growth with a tolerance for higher multiples.
Otis Worldwide Corporation (OTIS) commands a robust strategic moat through exceptional capital efficiency and recurring revenue stability. It offers better stability than ROK but carries risks from high leverage and lower equity returns. OTIS fits well within GARP portfolios seeking steady growth at a reasonable price.
If you prioritize aggressive growth and operational excellence, Rockwell Automation outshines due to its strong value creation despite valuation risks. However, if you seek stability coupled with a solid moat and efficient capital use, Otis offers better risk-adjusted potential for growth-at-a-reasonable-price investors. Each scenario demands careful risk management aligned with your investment profile.
Disclaimer: Investment carries a risk of loss of initial capital. The past performance is not a reliable indicator of future results. Be sure to understand risks before making an investment decision.
Go Further
I encourage you to read the complete analyses of Rockwell Automation, Inc. and Otis Worldwide Corporation to enhance your investment decisions: