Home > Comparison > Industrials > OTIS vs PNR
The strategic rivalry between Otis Worldwide Corporation and Pentair plc shapes the Industrials sector’s machinery landscape. Otis operates as a capital-intensive elevator and escalator manufacturer with a vast global service network. In contrast, Pentair focuses on diversified water solutions, blending consumer and industrial fluid treatment technologies. This analysis pits Otis’s scale against Pentair’s innovation to identify which path offers a superior risk-adjusted return for a balanced portfolio.
Table of contents
Companies Overview
Otis Worldwide Corporation and Pentair plc dominate distinct niches within industrial machinery, each commanding substantial global presence.
Otis Worldwide Corporation: Elevator and Escalator Pioneer
Otis leads the elevator and escalator market, generating revenue by designing, manufacturing, and servicing vertical transportation systems. Its operations split between New Equipment sales and extensive Service contracts, supported by 34,000 mechanics worldwide. In 2026, Otis continues prioritizing service network expansion to capitalize on recurring maintenance revenues and modernization demand.
Pentair plc: Water Solutions Specialist
Pentair commands the water treatment and fluid management space, earning through Consumer Solutions and Industrial & Flow Technologies segments. It delivers pool equipment, filtration, and industrial water systems under multiple brands. In 2026, Pentair emphasizes innovation in advanced membrane filtration and integrated water management solutions to meet growing environmental regulations and infrastructure needs.
Strategic Collision: Similarities & Divergences
Both firms excel in industrial machinery but diverge sharply in focus—Otis owns a closed ecosystem in vertical mobility, while Pentair pursues open water management platforms. Their battleground centers on infrastructure modernization, yet Otis targets building interiors, Pentair external water systems. This contrast shapes distinct investment profiles: Otis offers steady service-driven cash flow; Pentair bets on technological adaptability and environmental trends.
Income Statement Comparison
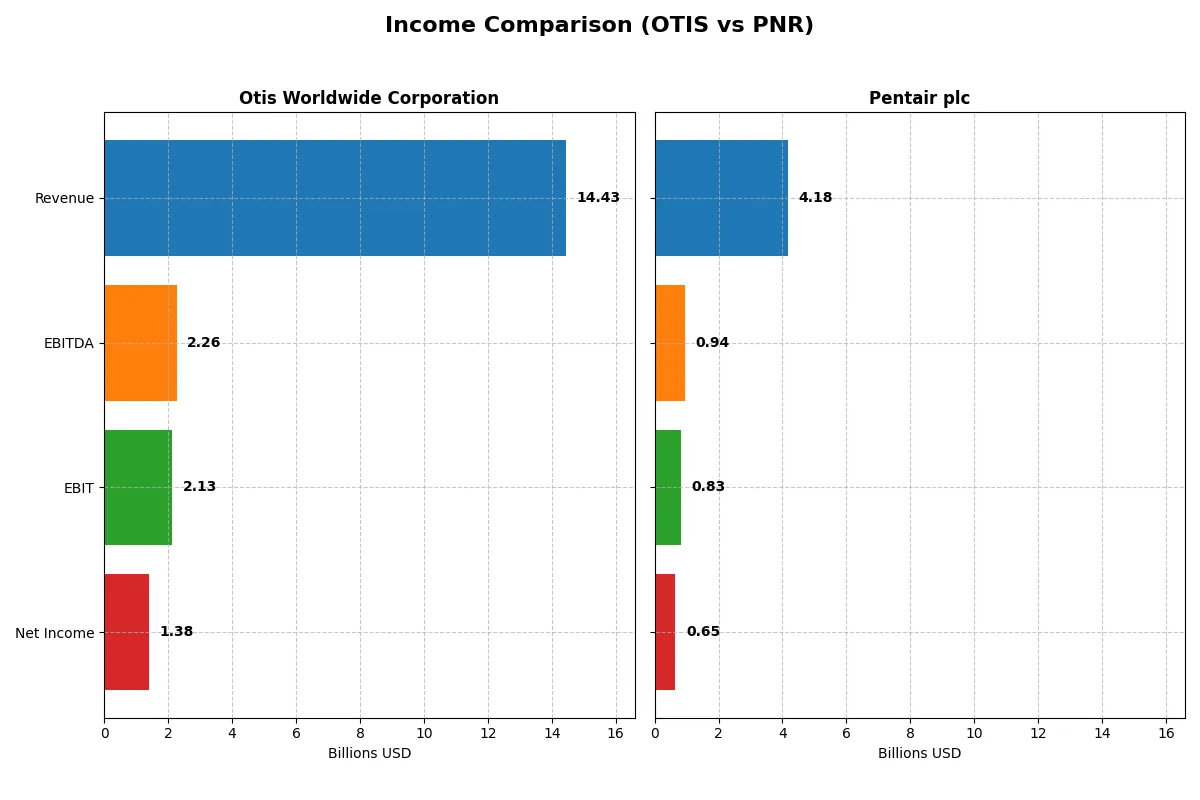
The following data dissects the core profitability and scalability of both corporate engines to reveal who dominates the bottom line:
| Metric | Otis Worldwide Corporation (OTIS) | Pentair plc (PNR) |
|---|---|---|
| Revenue | 14.43B | 4.18B |
| Cost of Revenue | 10.04B | 2.49B |
| Operating Expenses | 2.20B | 833M |
| Gross Profit | 4.40B | 1.69B |
| EBITDA | 2.26B | 944M |
| EBIT | 2.13B | 826M |
| Interest Expense | 196M | 69M |
| Net Income | 1.38B | 654M |
| EPS | 3.53 | 3.99 |
| Fiscal Year | 2025 | 2025 |
Income Statement Analysis: The Bottom-Line Duel
This income statement comparison reveals the true operational efficiency and profitability of two distinct corporate engines in 2025.
Otis Worldwide Corporation Analysis
Otis’s revenue grew modestly to $14.4B in 2025, showing limited top-line momentum. Net income slipped to $1.38B, reflecting a 9.6% net margin that remains solid but contracted year-over-year. Gross and EBIT margins hold favorably at 30.5% and 14.8%, respectively, supported by disciplined operating expenses and controlled interest costs.
Pentair plc Analysis
Pentair expanded revenue to $4.18B with a healthier 2.3% growth pace. Net income reached $654M, delivering a robust 15.7% net margin that edges higher, supported by a strong 40.5% gross margin and near 20% EBIT margin. Despite some operational expense pressure, Pentair’s efficiency gains and margin expansion signal positive earnings momentum.
Verdict: Margin Power vs. Revenue Scale
Pentair outperforms Otis on margin strength and earnings growth, boasting superior profitability ratios across the board. Otis commands larger scale but shows signs of margin compression and less agile revenue growth. For investors prioritizing margin robustness and improving earnings quality, Pentair’s profile appears more attractive in this comparison.
Financial Ratios Comparison
These vital ratios act as a diagnostic tool to expose the underlying fiscal health, valuation premiums, and capital efficiency of the companies compared below:
| Ratios | Otis Worldwide Corporation (OTIS) | Pentair plc (PNR) |
|---|---|---|
| ROE | -25.7% (2025) | 16.9% (2025) |
| ROIC | 40.7% (2025) | 12.5% (2025) |
| P/E | 24.8x (2025) | 26.1x (2025) |
| P/B | -6.4 (2025) | 4.4 (2025) |
| Current Ratio | 0.85 (2025) | 1.61 (2025) |
| Quick Ratio | 0.77 (2025) | 0.95 (2025) |
| D/E (Debt-to-Equity) | -1.62 (2025) | 0.42 (2025) |
| Debt-to-Assets | 82.1% (2025) | 23.9% (2025) |
| Interest Coverage | 11.2x (2025) | 12.4x (2025) |
| Asset Turnover | 1.35 (2025) | 0.61 (2025) |
| Fixed Asset Turnover | 11.1 (2025) | 11.1 (2025) |
| Payout Ratio | 46.7% (2025) | 25.1% (2025) |
| Dividend Yield | 1.88% (2025) | 0.96% (2025) |
| Fiscal Year | 2025 | 2025 |
Efficiency & Valuation Duel: The Vital Signs
Financial ratios serve as a company’s DNA, unveiling hidden operational strengths and potential risks that raw numbers alone cannot show.
Otis Worldwide Corporation
Otis posts a mixed profitability picture with a negative ROE at -25.7% but a strong ROIC of 40.7%, signaling efficient capital use despite shareholder losses. Its P/E ratio of 24.8 suggests a fairly valued stock. Otis returns 1.9% in dividends, balancing shareholder payout with reinvestment in R&D and growth.
Pentair plc
Pentair demonstrates robust profitability with a 16.9% ROE and a superior net margin of 15.7%. The stock appears expensive at a P/E of 26.1, and its P/B of 4.4 reflects premium valuation. Pentair offers a modest 1.0% dividend yield, signaling a cautious return approach while emphasizing growth investments.
Operational Efficiency vs. Premium Premium Valuation
Pentair exhibits stronger profitability and better liquidity ratios than Otis but trades at a premium multiple, reflecting growth expectations. Otis shows exceptional capital return but suffers from negative shareholder equity returns and low liquidity. Risk-tolerant investors may prefer Otis’s capital efficiency, while those favoring stability might lean toward Pentair.
Which one offers the Superior Shareholder Reward?
I compare Otis Worldwide Corporation (OTIS) and Pentair plc (PNR) based on their shareholder returns. Otis delivers a higher dividend yield, around 1.88%, with a payout ratio near 47%, fully covered by free cash flow (FCF). Its buyback program is modest but consistent. Pentair’s yield stands lower at about 0.96%, with a conservative payout ratio near 25%, also well covered by FCF. However, Pentair aggressively pursues share repurchases, enhancing total return. Otis’s distribution model balances dividends and buybacks sustainably, fitting its steady cash flow profile. Pentair’s lower yield but stronger buybacks offer growth potential but with slightly higher risk. I conclude Otis offers a superior total return profile in 2026 due to its balanced, sustainable shareholder reward approach.
Comparative Score Analysis: The Strategic Profile
The radar chart reveals the fundamental DNA and trade-offs of Otis Worldwide Corporation and Pentair plc, highlighting key financial strengths and weaknesses:
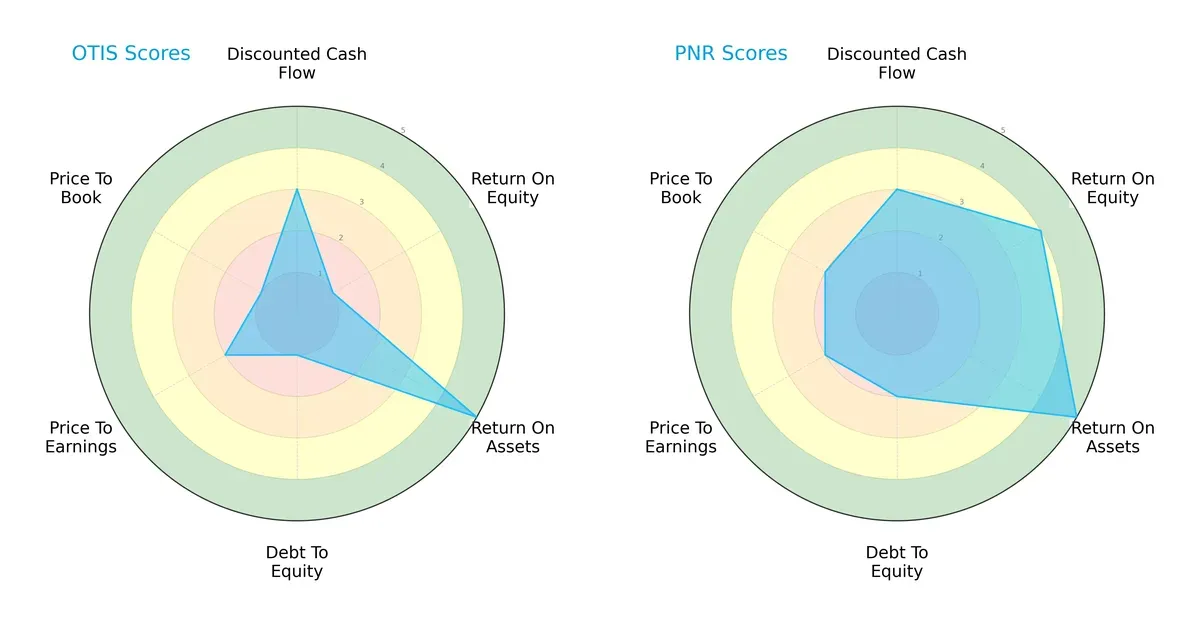
Pentair shows a more balanced profile with strong ROE (4) and moderate debt-to-equity (2), while Otis relies heavily on asset efficiency (ROA 5) but struggles with leverage (debt-to-equity 1) and profitability (ROE 1). Valuation metrics favor Pentair slightly, indicating better market pricing discipline.
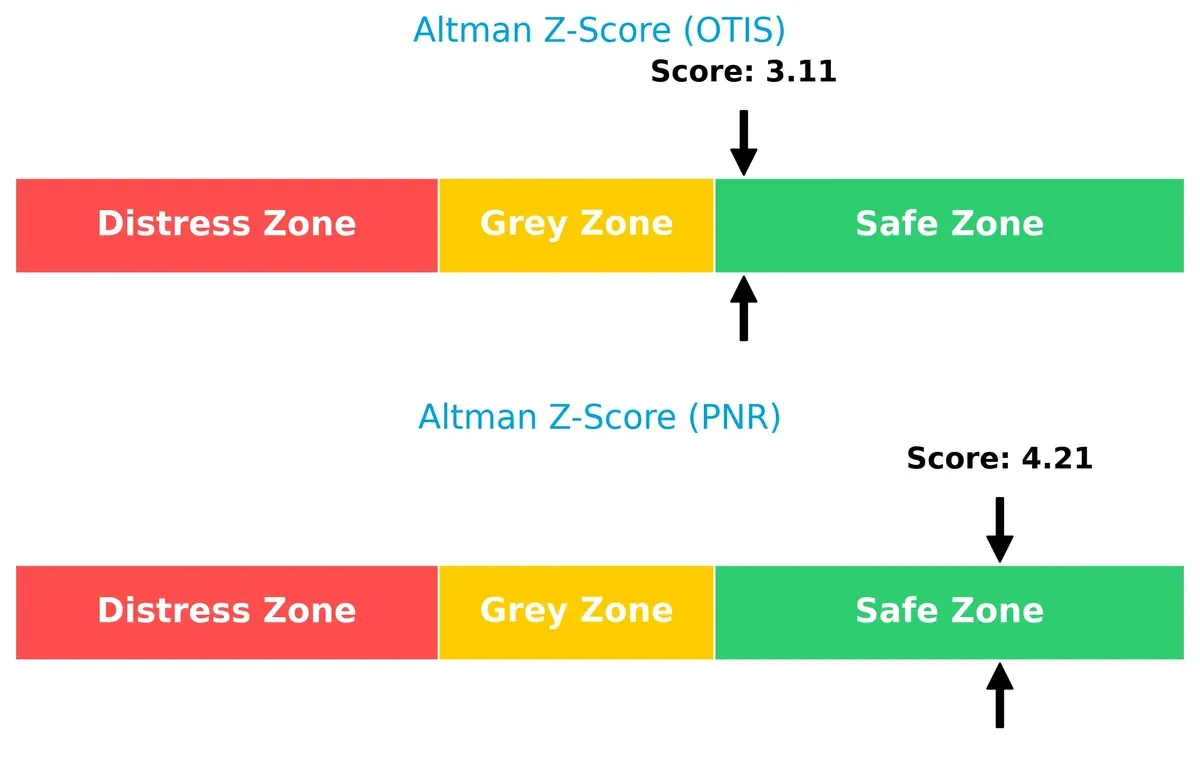
Bankruptcy Risk: Solvency Showdown
Pentair’s Altman Z-Score of 4.21 surpasses Otis’s 3.11, signaling a stronger buffer against bankruptcy risks in this market cycle:
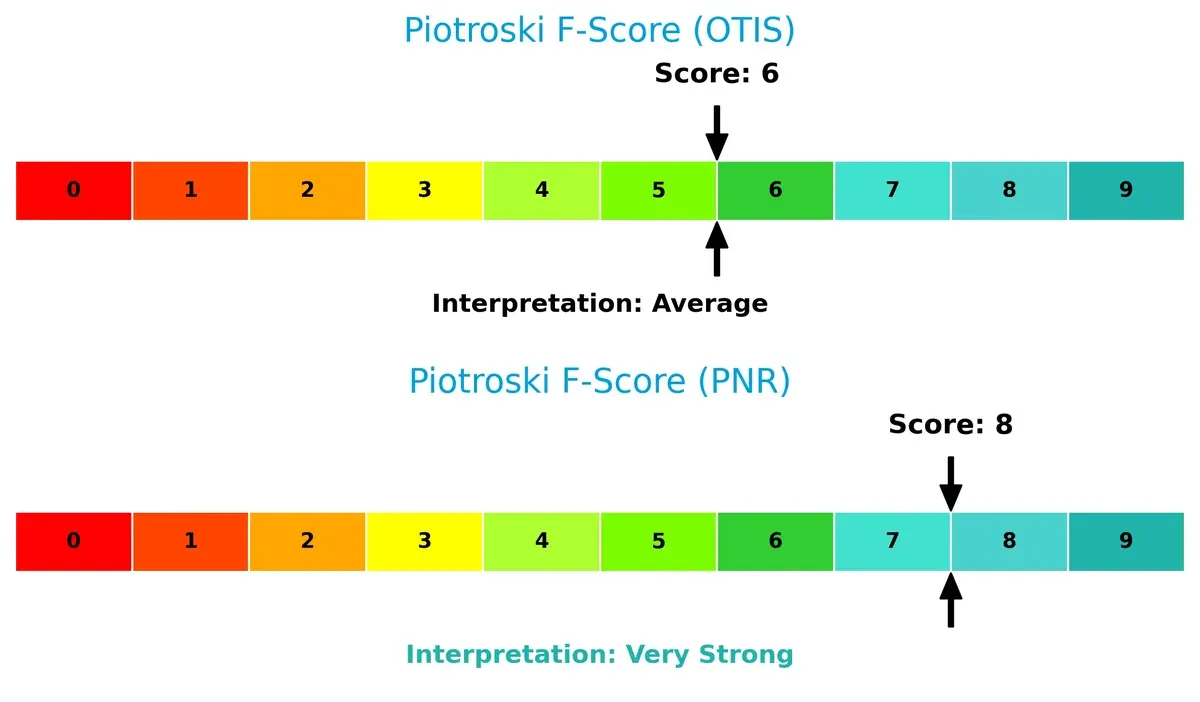
Financial Health: Quality of Operations
Pentair’s Piotroski F-Score of 8 indicates very strong financial health, outperforming Otis’s average score of 6, which raises modest internal red flags:
How are the two companies positioned?
This section dissects Otis and Pentair’s operational DNA by comparing their revenue distribution and internal dynamics. The goal is to confront their economic moats and identify which model delivers the most durable competitive advantage today.
Revenue Segmentation: The Strategic Mix
This visual comparison dissects how Otis Worldwide and Pentair diversify income streams and where their primary sector bets lie:
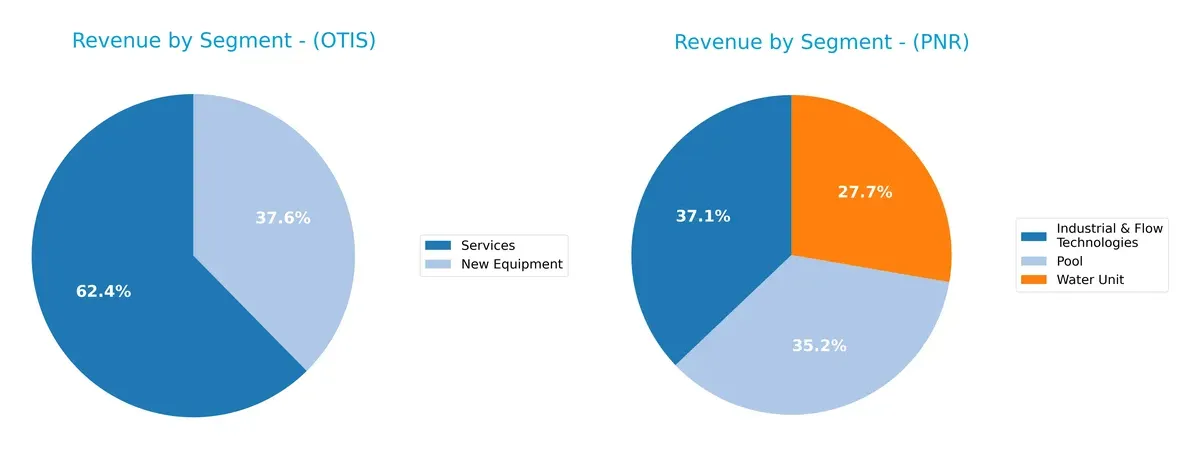
Otis anchors its revenue in two segments: Services at $8.9B and New Equipment at $5.4B, showing a balanced but concentrated mix. Pentair reveals a wider spread across Industrial & Flow Technologies ($1.5B), Pool ($1.4B), and Water Unit ($1.1B), reflecting more diversification. Otis’ focus on services supports ecosystem lock-in, whereas Pentair’s distribution mitigates concentration risk but may dilute strategic dominance.
Strengths and Weaknesses Comparison
This table compares the Strengths and Weaknesses of Otis Worldwide Corporation and Pentair plc:
Otis Strengths
- Strong services revenue of $8.9B in 2024
- High ROIC of 40.74% exceeding WACC
- Favorable asset turnover and fixed asset turnover
- Solid interest coverage ratio of 10.87
Pentair Strengths
- Higher net margin at 15.66%
- Positive ROE of 16.9% and favorable ROIC
- Strong current ratio at 1.61 indicates liquidity
- Favorable debt to assets ratio at 23.86%
- Good interest coverage at 11.9
- Diversified product segments across water and industrial markets
Otis Weaknesses
- Negative ROE at -25.67% raises concerns
- Low current ratio of 0.85 signals liquidity risk
- High debt to assets at 82.14%
- Negative price-to-book ratio
- Net margin only neutral at 9.59%
Pentair Weaknesses
- Unfavorable P/E and P/B ratios suggest valuation concerns
- Dividend yield low at 0.96%
- Asset turnover moderate at 0.61
- Quick ratio is neutral at 0.95
Otis shows operational efficiency and strong capital returns but faces liquidity and leverage risks. Pentair demonstrates superior profitability and liquidity with more balanced leverage, though its valuation metrics and dividend yield warrant caution. Each company’s profile suggests different strategic focuses on capital structure and market positioning.
The Moat Duel: Analyzing Competitive Defensibility
A structural moat is the only defense that protects long-term profits from relentless competition erosion. Let’s dissect these moats:
Otis Worldwide Corporation: Service Network and Brand Loyalty Moat
Otis leverages a vast service network and strong brand trust, reflected in a high ROIC exceeding WACC by 33%. This moat sustains margin stability despite slow revenue growth. Expansion in emerging markets and modernization services could deepen Otis’s competitive edge in 2026.
Pentair plc: Cost Advantage and Product Diversification Moat
Pentair’s moat stems from cost efficiencies and broad product lines in water solutions, delivering a solid ROIC above WACC but with a declining trend. Its stronger margin profile contrasts Otis’s slower growth. Opportunities in advanced filtration tech may disrupt markets in 2026.
Service Network vs. Cost Efficiency: Which Moat Holds Stronger?
Otis boasts a wider moat with a growing ROIC and sustainable profitability, while Pentair creates value but faces margin pressure from declining efficiency. Otis appears better equipped to defend its market share amid intensifying competition.
Which stock offers better returns?
The past 12 months show contrasting dynamics: Otis Worldwide Corporation’s stock declined overall, while Pentair plc gained significantly before recent weakness emerged.
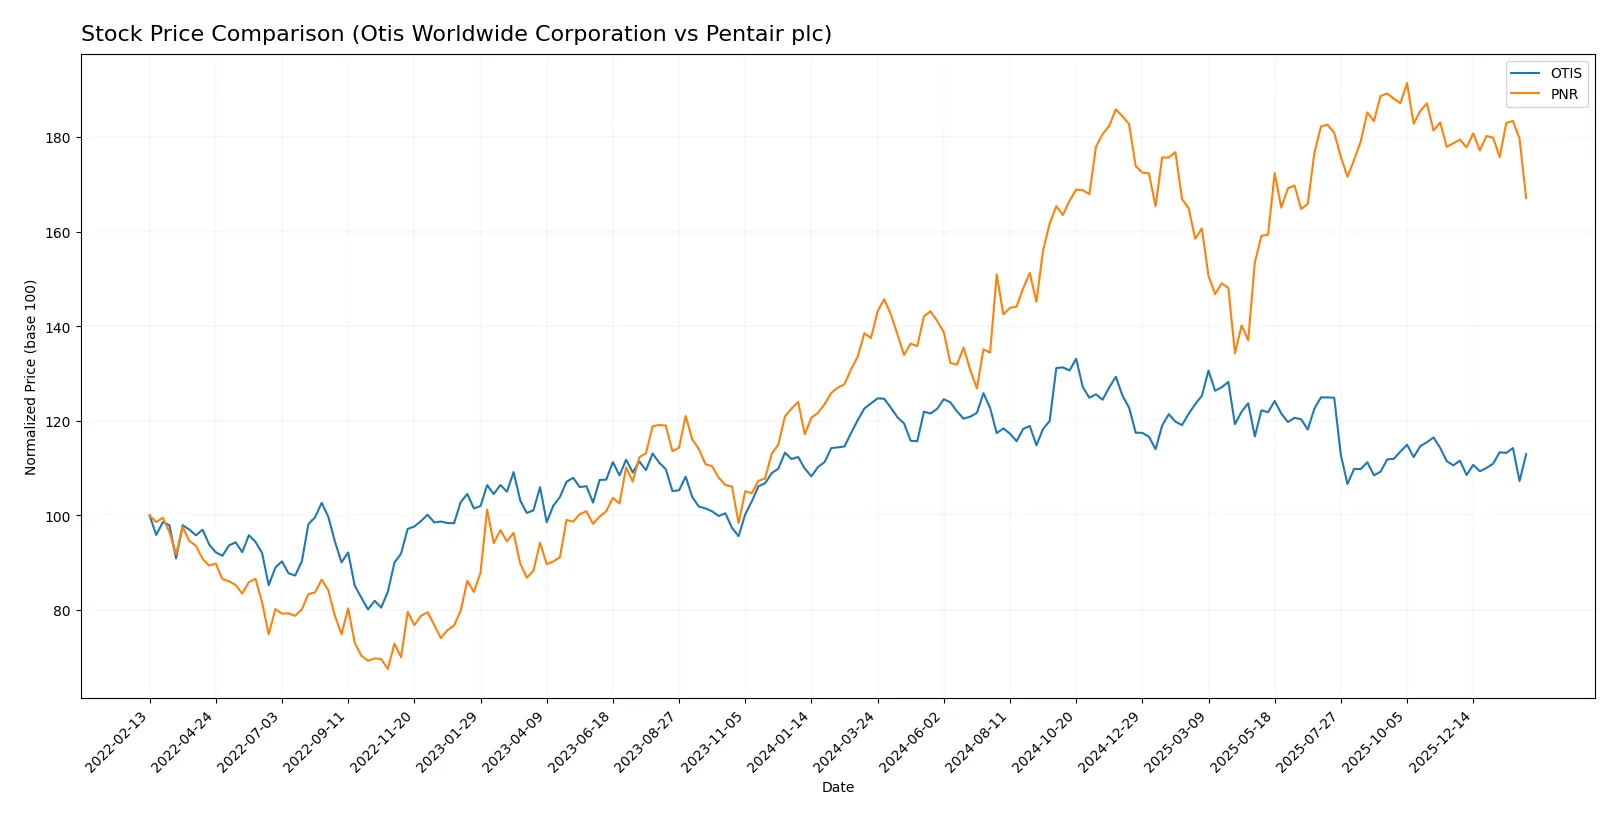
Trend Comparison
Otis Worldwide Corporation’s stock fell 8.67% over the past year, marking a bearish trend with accelerating decline. It reached a high of 106.01 and low of 84.93, with moderate volatility (std dev 4.88%).
Pentair plc’s stock gained 21.52% over the same period, reflecting a bullish but decelerating trend. It showed higher volatility (std dev 10.7%), hitting a peak of 112.23 and a trough of 74.39.
Pentair outperformed Otis overall with a positive 21.52% return versus Otis’s -8.67%. Recent trends show Otis slightly recovering and Pentair facing short-term weakness.
Target Prices
Analysts present a clear consensus on target prices for Otis Worldwide Corporation and Pentair plc, reflecting their industrial sector positioning.
| Company | Target Low | Target High | Consensus |
|---|---|---|---|
| Otis Worldwide Corporation | 92 | 109 | 97.75 |
| Pentair plc | 90 | 135 | 120 |
The consensus target for Otis is modestly above its current price of 90.05, implying limited upside. Pentair’s target consensus of 120 suggests significant appreciation potential from its current 98.15 price.

Don’t Let Luck Decide Your Entry Point
Optimize your entry points with our advanced ProRealTime indicators. You’ll get efficient buy signals with precise price targets for maximum performance. Start outperforming now!
How do institutions grade them?
Otis Worldwide Corporation Grades
The following table summarizes recent institutional grades for Otis Worldwide Corporation:
| Grading Company | Action | New Grade | Date |
|---|---|---|---|
| JP Morgan | Maintain | Overweight | 2026-01-16 |
| Wells Fargo | Maintain | Equal Weight | 2025-12-15 |
| Barclays | Maintain | Underweight | 2025-10-30 |
| JP Morgan | Maintain | Overweight | 2025-10-15 |
| Wolfe Research | Upgrade | Outperform | 2025-10-08 |
| Wells Fargo | Maintain | Equal Weight | 2025-10-06 |
| JP Morgan | Maintain | Overweight | 2025-09-18 |
| RBC Capital | Maintain | Outperform | 2025-07-28 |
| Wolfe Research | Upgrade | Peer Perform | 2025-07-25 |
| Wells Fargo | Maintain | Equal Weight | 2025-07-24 |
Pentair plc Grades
The following table summarizes recent institutional grades for Pentair plc:
| Grading Company | Action | New Grade | Date |
|---|---|---|---|
| Oppenheimer | Maintain | Outperform | 2026-02-04 |
| Citigroup | Maintain | Buy | 2026-02-04 |
| JP Morgan | Maintain | Overweight | 2026-01-16 |
| Citigroup | Maintain | Buy | 2026-01-12 |
| BNP Paribas Exane | Downgrade | Underperform | 2026-01-07 |
| TD Cowen | Downgrade | Sell | 2026-01-05 |
| Jefferies | Upgrade | Buy | 2025-12-10 |
| Barclays | Downgrade | Equal Weight | 2025-12-04 |
| Oppenheimer | Maintain | Outperform | 2025-11-20 |
| UBS | Maintain | Buy | 2025-10-22 |
Which company has the best grades?
Pentair plc shows a broader range of ratings, including multiple Buy and Outperform grades, but also some downgrades to Underperform and Sell. Otis Worldwide Corporation’s grades are more consistent, mainly in the Overweight to Equal Weight range, with fewer downgrades. Investors may interpret Otis’s steadier profile as less volatile, while Pentair’s mixed grades reflect higher analyst conviction but also increased risk.
Risks specific to each company
The following categories identify the critical pressure points and systemic threats facing both firms in the 2026 market environment:
1. Market & Competition
Otis Worldwide Corporation
- Faces intense competition in elevator services with pressure from innovation and infrastructure trends.
Pentair plc
- Competes in diverse water solutions markets, facing strong rivals in filtration and pump technology.
2. Capital Structure & Debt
Otis Worldwide Corporation
- High debt-to-assets ratio at 82.1% signals leverage risk despite strong interest coverage.
Pentair plc
- Low debt-to-assets at 23.9% reflects conservative leverage and solid financial stability.
3. Stock Volatility
Otis Worldwide Corporation
- Beta near 1.01 indicates market-level volatility, suggesting moderate risk sensitivity.
Pentair plc
- Higher beta at 1.22 implies greater price swings, increasing volatility risk for investors.
4. Regulatory & Legal
Otis Worldwide Corporation
- Subject to safety and building regulations globally, with compliance costs impacting margins.
Pentair plc
- Faces environmental and water quality regulations, which may increase operational expenses.
5. Supply Chain & Operations
Otis Worldwide Corporation
- Operates a large global service network; supply chain disruptions could affect equipment installation.
Pentair plc
- Relies on complex supply chains for diverse water product lines, vulnerable to raw material price swings.
6. ESG & Climate Transition
Otis Worldwide Corporation
- Must address energy efficiency in elevators and urban sustainability initiatives to meet ESG targets.
Pentair plc
- Water management focus aligns with climate adaptation, but faces pressure to reduce carbon footprint.
7. Geopolitical Exposure
Otis Worldwide Corporation
- Significant exposure to China and international markets risks from trade tensions.
Pentair plc
- UK-based with global reach, vulnerability to Brexit-related trade barriers and currency fluctuations.
Which company shows a better risk-adjusted profile?
Otis’s highest risk is its heavy leverage, which threatens financial flexibility despite solid operational metrics. Pentair’s key risk lies in its higher stock volatility, reflecting sensitivity to market cycles and investor sentiment. Pentair’s stronger balance sheet, higher ROE, and superior Piotroski score suggest a better risk-adjusted profile. The contrast in debt levels—Otis’s 82.1% debt-to-assets versus Pentair’s 23.9%—justifies my greater concern over Otis’s financial risk.
Final Verdict: Which stock to choose?
Otis Worldwide Corporation’s superpower lies in its exceptional capital efficiency and a robust moat, reflected in a very favorable ROIC far exceeding its WACC. However, its liquidity shortfall is a point of vigilance that could challenge operational flexibility. Otis fits well within aggressive growth portfolios seeking durable value creation.
Pentair plc commands a strategic moat through steady profitability and a strong balance sheet, underpinned by recurring revenue streams and a safer liquidity profile compared to Otis. Its slightly favorable moat and solid income growth make it an attractive choice for investors targeting growth at a reasonable price (GARP).
If you prioritize capital efficiency and long-term value creation, Otis outshines with its high and growing ROIC despite liquidity concerns. However, if you seek a safer investment with steady income growth and better liquidity, Pentair offers better stability and a compelling growth profile. Each stock suits distinct investor profiles based on risk tolerance and return expectations.
Disclaimer: Investment carries a risk of loss of initial capital. The past performance is not a reliable indicator of future results. Be sure to understand risks before making an investment decision.
Go Further
I encourage you to read the complete analyses of Otis Worldwide Corporation and Pentair plc to enhance your investment decisions: