Home > Comparison > Industrials > OTIS vs PSN
The strategic rivalry between Otis Worldwide Corporation and Parsons Corporation shapes the Industrials sector’s evolution. Otis operates as a capital-intensive machinery manufacturer specializing in elevators and escalators with a vast service network. Parsons focuses on integrated defense, intelligence, and critical infrastructure solutions, blending technology with engineering services. This analysis contrasts their differing operational models to identify which offers superior risk-adjusted returns for a diversified portfolio in today’s dynamic industrial landscape.
Table of contents
Companies Overview
Otis Worldwide Corporation and Parsons Corporation command critical roles in industrial machinery, shaping infrastructure and defense sectors globally.
Otis Worldwide Corporation: Global Elevator and Escalator Leader
Otis dominates the vertical transportation market by manufacturing, installing, and servicing elevators and escalators worldwide. Its revenue streams split between new equipment sales and extensive maintenance services. In 2026, Otis sharpened its focus on expanding its global service network, leveraging 34,000 service mechanics to reinforce its competitive moat.
Parsons Corporation: Integrated Defense and Infrastructure Solutions
Parsons specializes in delivering complex defense, intelligence, and critical infrastructure services. Its core revenues come from cybersecurity, missile defense, and smart infrastructure projects primarily for U.S. government agencies. The company emphasized technological innovation and program management in 2026 to solidify its foothold in national security and critical infrastructure markets.
Strategic Collision: Similarities & Divergences
Both companies operate in industrial machinery but serve distinct markets—Otis targets commercial and residential building infrastructure, while Parsons focuses on government defense and critical infrastructure. Their competition centers on technological integration and long-term service contracts. Otis offers a stable, service-driven model, whereas Parsons presents a growth profile tied to government spending and innovation cycles.
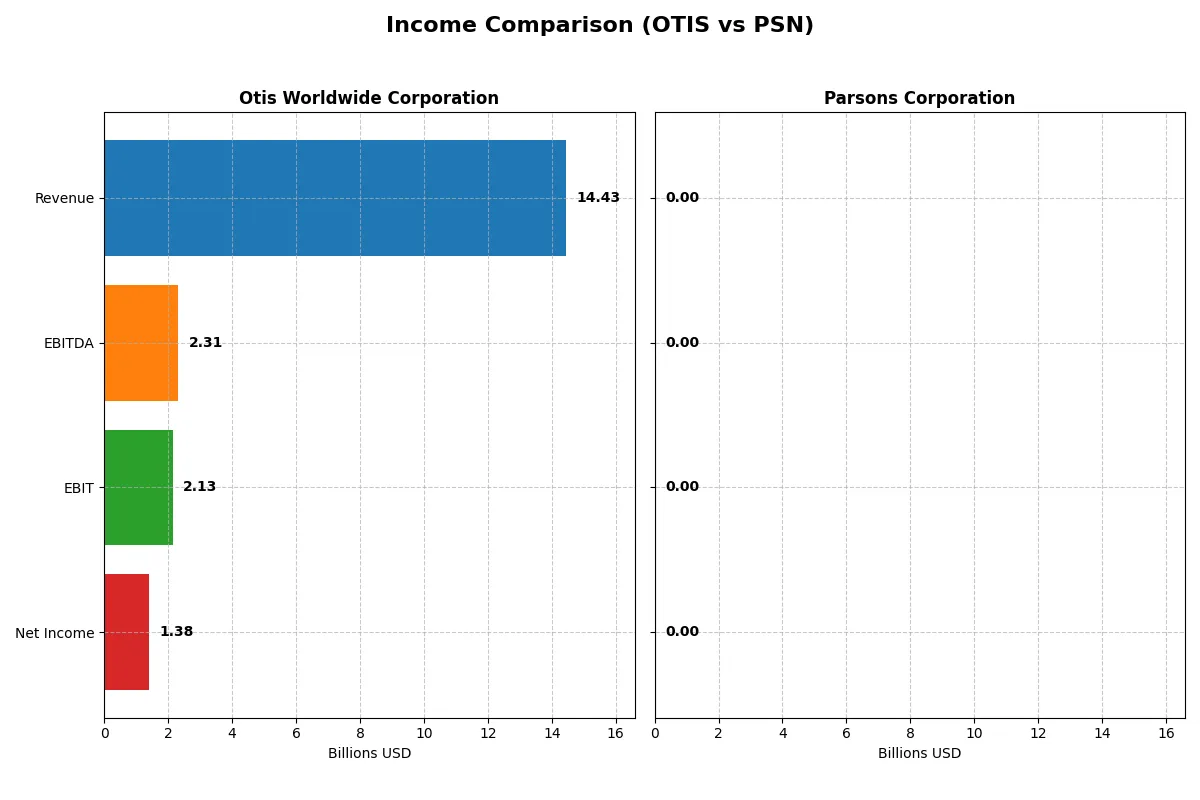
Income Statement Comparison
The following data dissects the core profitability and scalability of both corporate engines to reveal who dominates the bottom line:
| Metric | Otis Worldwide Corporation (OTIS) | Parsons Corporation (PSN) |
|---|---|---|
| Revenue | 14.4B | 100K |
| Cost of Revenue | 10.1B | 0 |
| Operating Expenses | 2.24B | 16K |
| Gross Profit | 4.37B | 0 |
| EBITDA | 2.31B | 6.6K |
| EBIT | 2.13B | 0 |
| Interest Expense | 196M | -800 |
| Net Income | 1.38B | 3.8K |
| EPS | 3.53 | 0 |
| Fiscal Year | 2025 | 2025 |
Income Statement Analysis: The Bottom-Line Duel
This income statement comparison reveals which company converts sales into profits more efficiently over recent years.
Otis Worldwide Corporation Analysis
Otis shows stable revenue around $14.4B in 2025, with net income fluctuating but generally growing to $1.38B. Its gross margin remains healthy at 30.3%, and net margin at 9.6% signals disciplined cost control. Despite modest revenue growth of 1.2% in 2025, Otis maintains solid operating efficiency and a favorable earnings trajectory.
Parsons Corporation Analysis
Parsons plummeted from $6.75B revenue in 2024 to only $100K in 2025, wiping out gross profit and EBIT margins. Net income fell dramatically to near zero but held a slight positive net margin of 3.8%. The collapse in scale overshadows its minimal profitability, marking a severe deterioration in operating performance and growth.
Scale Stability vs. Collapse in Earnings Power
Otis clearly outperforms Parsons in both scale and margin sustainability. Otis’s consistent $14B+ revenue base and double-digit operating margins highlight a resilient business model. Parsons’s drastic revenue loss and near-zero earnings erode investor confidence. For those valuing stable, efficient earnings, Otis’s profile remains far more attractive.
Financial Ratios Comparison
These vital ratios act as a diagnostic tool to expose the underlying fiscal health, valuation premiums, and capital efficiency of the companies compared below:
| Ratios | Otis Worldwide Corporation (OTIS) | Parsons Corporation (PSN) |
|---|---|---|
| ROE | -25.7% | 0.00014% |
| ROIC | 39.6% | 0.00015% |
| P/E | 24.8 | 0 |
| P/B | -6.38 | 0 |
| Current Ratio | 0.85 | 1.75 |
| Quick Ratio | 0.77 | 1.75 |
| D/E | -1.62 | 0.52 |
| Debt-to-Assets | 82.1% | 23.9% |
| Interest Coverage | 10.9 | -8.25 |
| Asset Turnover | 1.35 | 0.000017 |
| Fixed Asset Turnover | 11.13 | 0.00036 |
| Payout ratio | 46.7% | 0% |
| Dividend yield | 1.88% | 0% |
| Fiscal Year | 2025 | 2025 |
Efficiency & Valuation Duel: The Vital Signs
Financial ratios are a company’s DNA, uncovering hidden risks and operational strengths essential for investment decisions.
Otis Worldwide Corporation
Otis shows a strong return on invested capital at 39.6%, signaling efficient capital use despite a negative ROE near -25.7%. Its P/E ratio of 24.85 indicates a fairly valued stock. Otis offers a 1.88% dividend yield, balancing shareholder returns with moderate reinvestment in R&D.
Parsons Corporation
Parsons reveals weak profitability with a near-zero ROE and ROIC, reflecting operational challenges. Its valuation metrics are skewed by zero or undefined P/E and P/B ratios. The firm maintains a solid current ratio of 1.75 but does not pay dividends, focusing instead on preserving liquidity and stabilizing operations.
Operational Efficiency vs. Profitability Challenge
Otis demonstrates superior profitability and balanced valuation, while Parsons struggles with returns despite a stronger liquidity position. Investors seeking operational efficiency and steady dividends might lean toward Otis, whereas Parsons fits those prioritizing liquidity and turnaround potential.
Which one offers the Superior Shareholder Reward?
I see Otis Worldwide provides a 1.88% dividend yield with a moderate 47% payout ratio, backed by strong free cash flow coverage (~90%). Otis also executes steady buybacks, enhancing total returns. Parsons pays no dividends but reinvests heavily in growth and acquisitions, with no buybacks reported. Otis’s balanced, sustainable distribution model outpaces Parsons’s reinvestment gamble. For 2026, I favor Otis for superior shareholder reward through reliable income and value return.
Comparative Score Analysis: The Strategic Profile
The radar chart reveals the fundamental DNA and trade-offs of Otis Worldwide Corporation and Parsons Corporation, highlighting their core financial strengths and vulnerabilities:
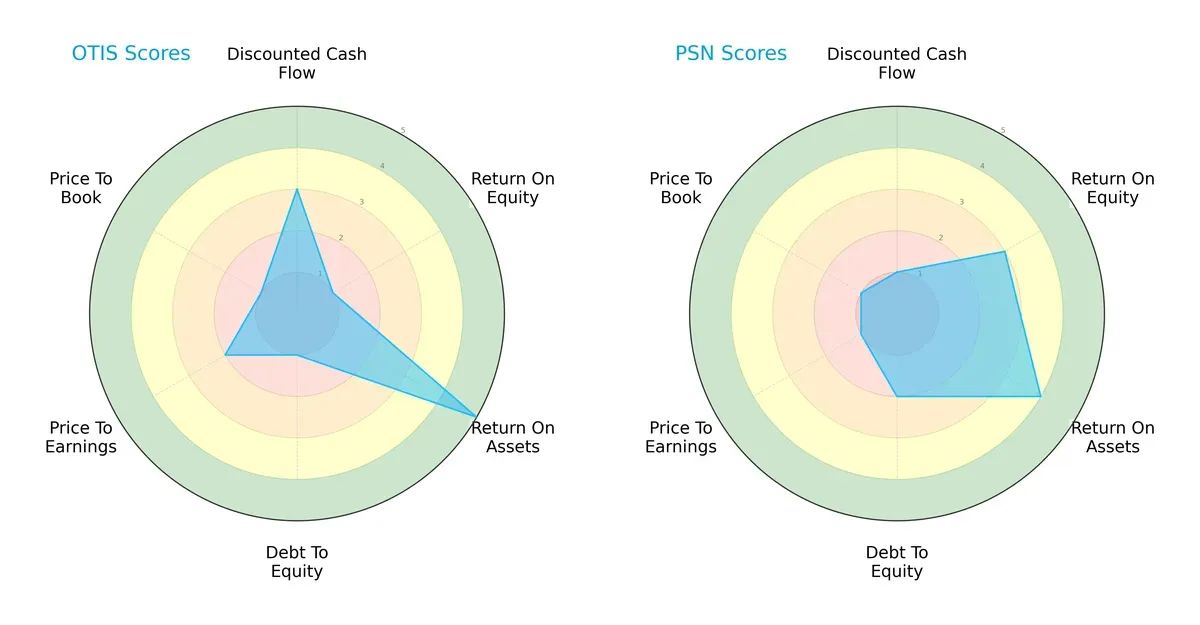
Otis leads in discounted cash flow (3 vs. 1) and return on assets (5 vs. 4), indicating stronger cash generation and asset efficiency. Parsons shows a better return on equity (3 vs. 1) and slightly better debt-to-equity management (2 vs. 1), reflecting a more balanced capital structure. Both firms struggle with valuation metrics, scoring low on price-to-earnings and price-to-book. Otis’s profile leans heavily on asset utilization, while Parsons has a more diversified financial base.
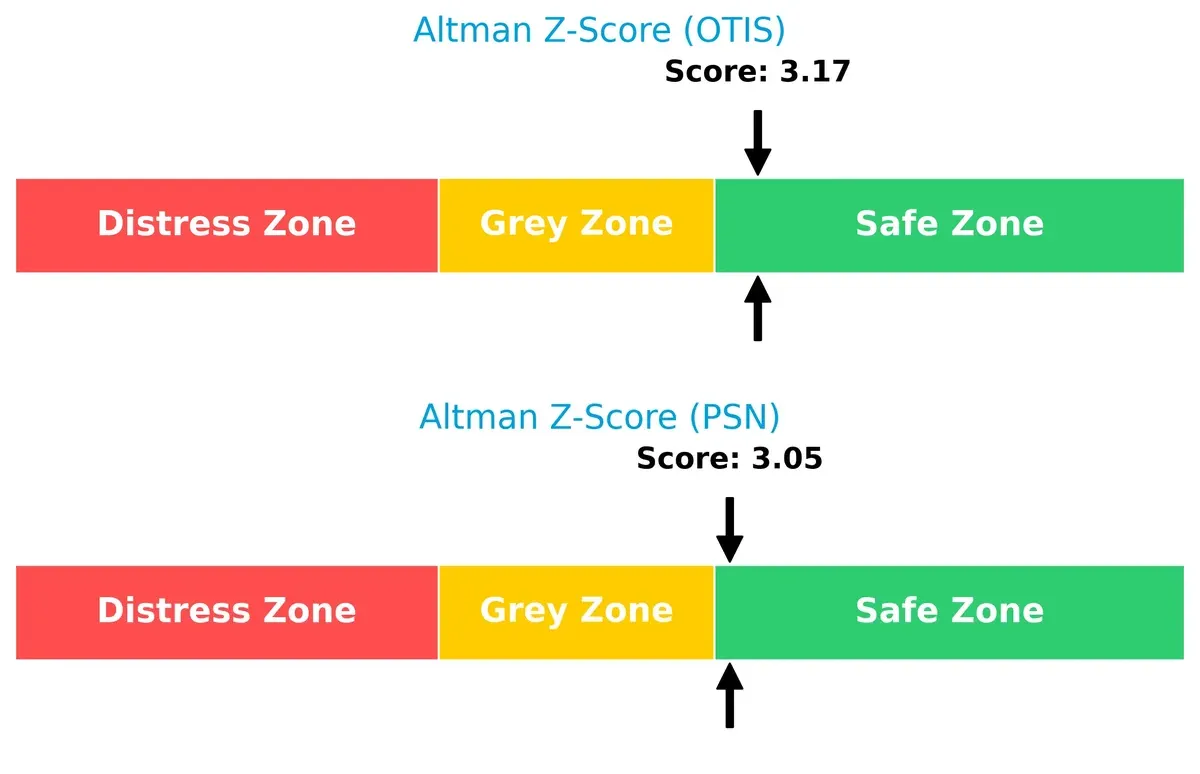
Bankruptcy Risk: Solvency Showdown
Otis’s Altman Z-Score of 3.17 slightly surpasses Parsons’s 3.05, both comfortably in the safe zone, implying strong solvency and low bankruptcy risk in today’s market cycle:
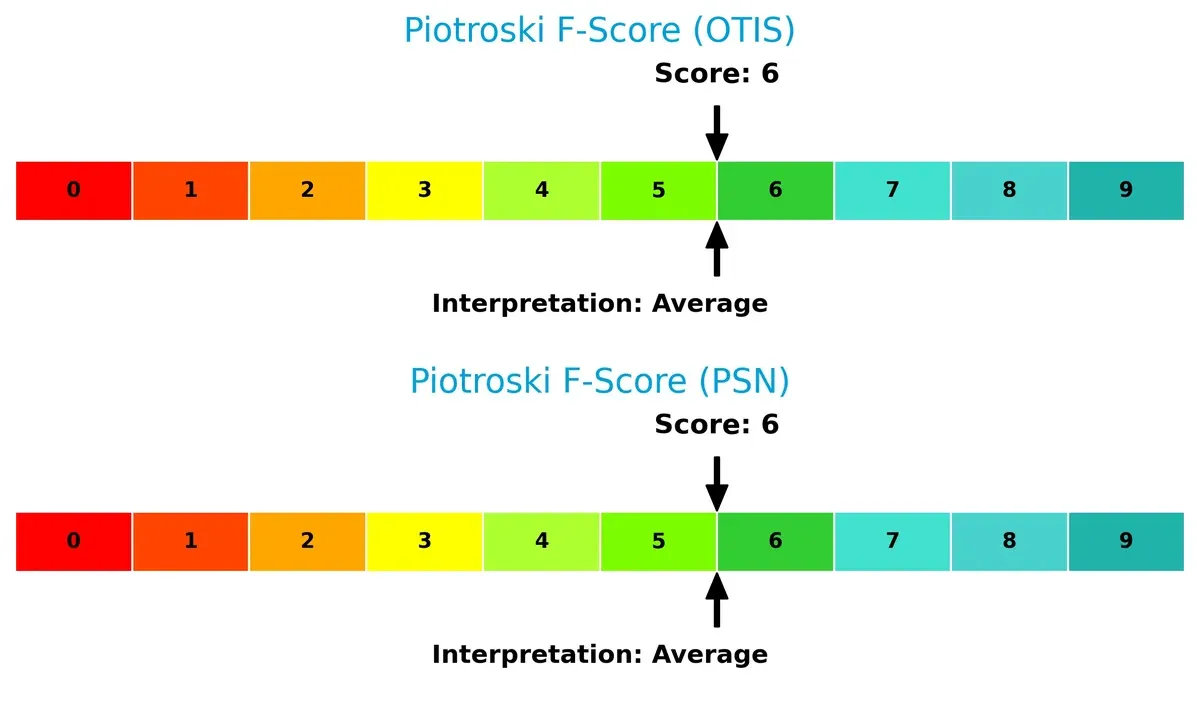
Financial Health: Quality of Operations
Otis and Parsons both score a 6 on the Piotroski F-Score, indicating average financial health with no immediate red flags. Their operational quality and internal metrics appear stable but leave room for improvement:
How are the two companies positioned?
This section dissects Otis and Parsons’ operational DNA by comparing revenue distribution and internal dynamics. The goal is to confront their economic moats to reveal the most resilient, sustainable competitive advantage today.
Revenue Segmentation: The Strategic Mix
This visual comparison dissects how Otis Worldwide and Parsons Corporation diversify their income streams and where their primary sector bets lie:
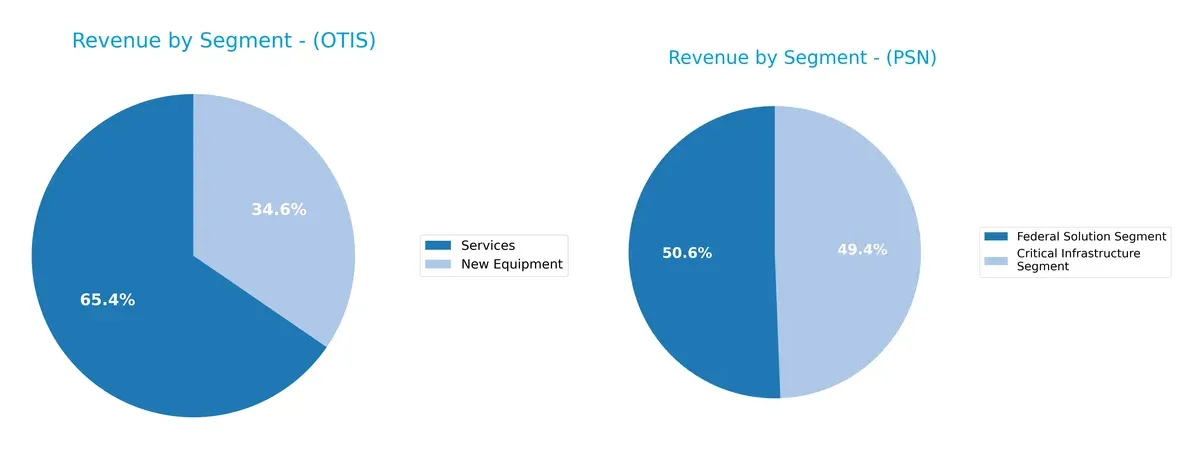
Otis anchors revenue in two clear segments: Services at $9.4B and New Equipment near $5B in 2025. This mix offers steady aftermarket income plus growth from new installations. Parsons balances revenue between Federal Solutions ($3.2B) and Critical Infrastructure ($3.1B), showing a more even split. Otis’s dependency on Services provides ecosystem lock-in, while Parsons’s split reduces concentration risk amid government contracts.
Strengths and Weaknesses Comparison
This table compares the Strengths and Weaknesses of Otis and Parsons based on key financial and market metrics:
Otis Strengths
- Strong ROIC at 39.59% indicating effective capital allocation
- Favorable WACC at 7.23% supports value creation
- High fixed asset turnover of 11.13 shows operational efficiency
- Balanced revenue between new equipment and services
- Significant global presence with diversified geographic sales
Parsons Strengths
- Favorable WACC at 2.19% indicating low capital costs
- Healthy current and quick ratios at 1.75 show good liquidity
- Low debt-to-assets ratio at 23.87% reduces financial risk
- Presence in key segments: Federal Solutions and Critical Infrastructure
- Large North American revenue base with growing Middle East exposure
Otis Weaknesses
- Negative ROE at -25.67% signals shareholder return issues
- Current and quick ratios below 1 indicate liquidity concerns
- High debt-to-assets at 82.14% increases financial leverage risk
- Negative PB ratio may reflect market valuation doubts
- Net margin neutral at 9.59%, limiting profitability upside
Parsons Weaknesses
- Net margin is low at 3.8%, reflecting weak profitability
- Zero or negative ROE and ROIC imply poor capital returns
- Interest coverage is negative, raising solvency concerns
- Asset turnover at 0 shows inefficiency or reporting gaps
- Dividend yield at 0% may deter income-focused investors
Otis demonstrates strengths in capital efficiency and global diversification but faces liquidity and leverage risks. Parsons shows solid liquidity and low leverage but struggles with profitability and operational efficiency. Each company’s financial profile suggests different strategic priorities.
The Moat Duel: Analyzing Competitive Defensibility
A structural moat is the only thing protecting long-term profits from relentless competition and market shifts. Here is how Otis and Parsons stack up:
Otis Worldwide Corporation: Durable Service Network Moat
Otis leverages its vast service network and high switching costs to maintain stable margins and a 32% ROIC premium over WACC. Expanding modernization services in China could deepen this moat in 2026.
Parsons Corporation: Specialized Defense Solutions Moat
Parsons relies on niche expertise in defense and infrastructure, but declining ROIC signals weakening moat strength. Its focus on cybersecurity offers growth potential amid geopolitical tensions.
Verdict: Service Network Resilience vs. Niche Technical Expertise
Otis’s widening moat, supported by consistently strong ROIC and margin stability, outmatches Parsons’s eroding competitive edge. Otis is better positioned to defend and grow its market share long-term.
Which stock offers better returns?
Over the past 12 months, Otis Worldwide and Parsons Corporation exhibited pronounced price declines with distinct acceleration patterns and volume dynamics shaping their trading profiles.
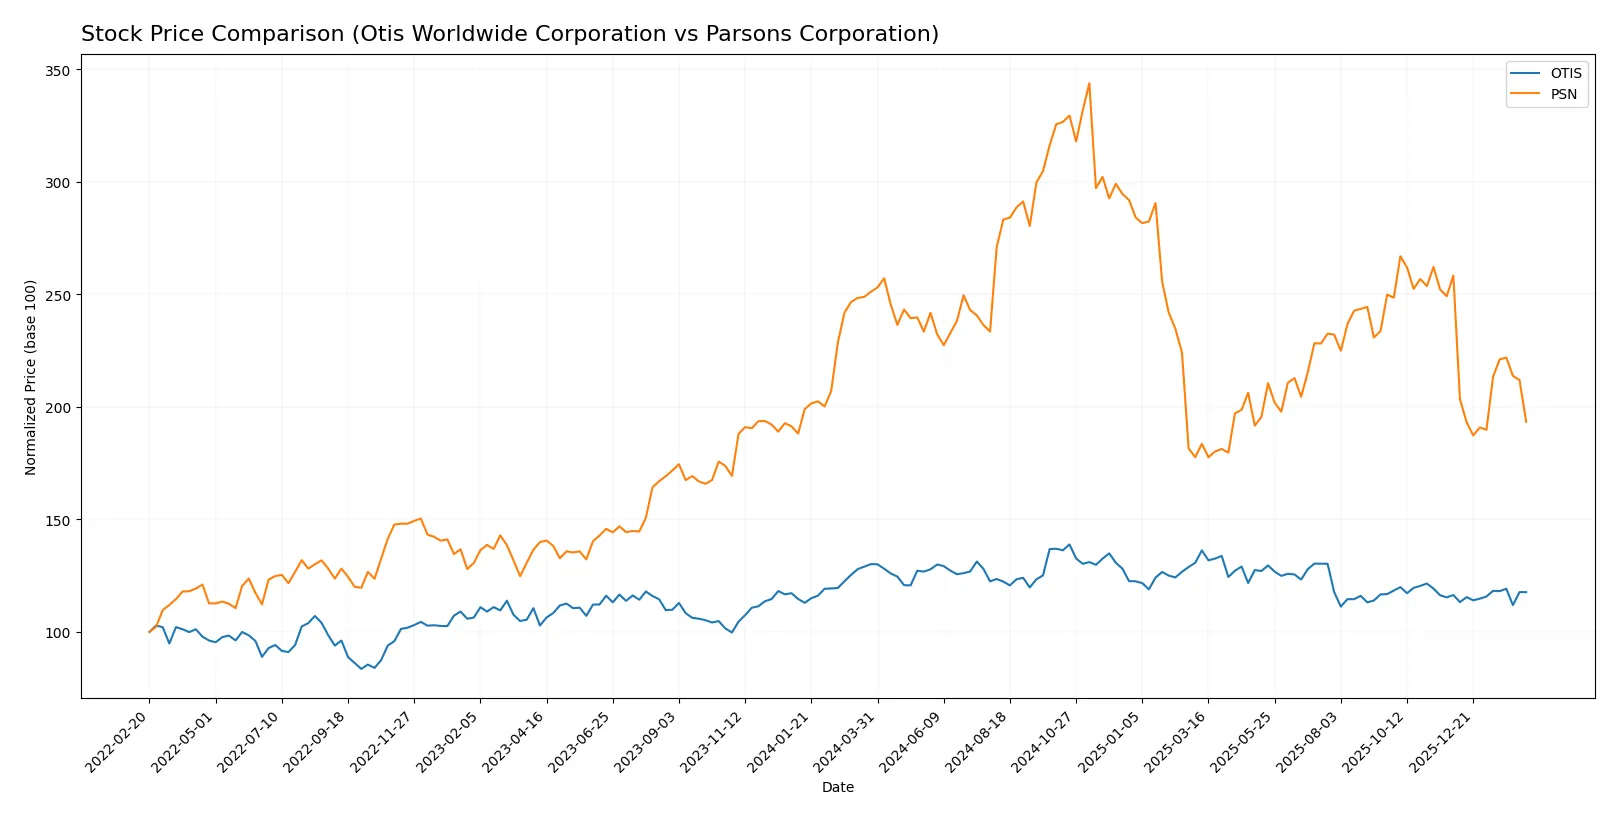
Trend Comparison
Otis Worldwide shows a bearish trend with a -9.57% price change over 12 months, marked by accelerating decline and moderate volatility (std dev 4.89). Recent months indicate slight recovery with a 1.1% gain.
Parsons Corporation also trends bearish, suffering a sharper -23.0% drop over the year with decelerating losses and higher volatility (std dev 13.2). Recent performance worsened, falling 25.15%.
Comparing both, Otis outperformed Parsons, delivering a smaller loss and recent positive momentum, thus offering a relatively stronger market performance over the analyzed period.
Target Prices
Analysts present a moderately optimistic target consensus for Otis Worldwide Corporation and Parsons Corporation.
| Company | Target Low | Target High | Consensus |
|---|---|---|---|
| Otis Worldwide Corporation | 92 | 109 | 97.75 |
| Parsons Corporation | 78 | 104 | 86.8 |
Otis’s consensus target of 97.75 suggests modest upside from its current price of 89.83. Parsons shows a wider range, with consensus at 86.8 versus a current price of 63.38, indicating stronger growth expectations.

Don’t Let Luck Decide Your Entry Point
Optimize your entry points with our advanced ProRealTime indicators. You’ll get efficient buy signals with precise price targets for maximum performance. Start outperforming now!
How do institutions grade them?
Otis Worldwide Corporation Grades
The table below shows recent grades from major financial institutions for Otis Worldwide Corporation.
| Grading Company | Action | New Grade | Date |
|---|---|---|---|
| JP Morgan | Maintain | Overweight | 2026-01-16 |
| Wells Fargo | Maintain | Equal Weight | 2025-12-15 |
| Barclays | Maintain | Underweight | 2025-10-30 |
| JP Morgan | Maintain | Overweight | 2025-10-15 |
| Wolfe Research | Upgrade | Outperform | 2025-10-08 |
| Wells Fargo | Maintain | Equal Weight | 2025-10-06 |
| JP Morgan | Maintain | Overweight | 2025-09-18 |
| RBC Capital | Maintain | Outperform | 2025-07-28 |
| Wolfe Research | Upgrade | Peer Perform | 2025-07-25 |
| JP Morgan | Maintain | Overweight | 2025-07-24 |
Parsons Corporation Grades
The table below shows recent grades from major financial institutions for Parsons Corporation.
| Grading Company | Action | New Grade | Date |
|---|---|---|---|
| UBS | Maintain | Buy | 2026-02-12 |
| Truist Securities | Maintain | Buy | 2026-02-12 |
| Keybanc | Maintain | Overweight | 2026-02-12 |
| Barclays | Maintain | Overweight | 2026-01-23 |
| Keybanc | Maintain | Overweight | 2026-01-20 |
| UBS | Maintain | Buy | 2026-01-15 |
| Citigroup | Maintain | Buy | 2026-01-13 |
| B of A Securities | Maintain | Buy | 2025-12-30 |
| Stifel | Maintain | Buy | 2025-12-23 |
| Jefferies | Maintain | Hold | 2025-12-11 |
Which company has the best grades?
Parsons Corporation holds consistently stronger grades with multiple “Buy” and “Overweight” ratings. Otis Worldwide shows mixed ratings, including “Underweight” and “Equal Weight.” Investors may see Parsons as favored by analysts, implying potentially stronger confidence in its outlook.
Risks specific to each company
The following categories identify the critical pressure points and systemic threats facing both firms in the 2026 market environment:
1. Market & Competition
Otis Worldwide Corporation
- Operates in a mature elevator market with steady demand but intense global competition in industrial machinery.
Parsons Corporation
- Focuses on defense and critical infrastructure with niche technology, facing competition from specialized contractors and government budget shifts.
2. Capital Structure & Debt
Otis Worldwide Corporation
- High debt-to-assets at 82%, indicating heavy leverage, posing risk if cash flow weakens.
Parsons Corporation
- Moderate debt-to-assets at 24%, balanced leverage reducing financial distress risk.
3. Stock Volatility
Otis Worldwide Corporation
- Beta near 1.0 (1.012), aligns with market volatility; trading range relatively stable.
Parsons Corporation
- Lower beta (0.665) suggests less sensitivity to market swings, but wider trading range implies episodic volatility.
4. Regulatory & Legal
Otis Worldwide Corporation
- Subject to stringent safety and building codes worldwide; regulatory changes could affect installation and service costs.
Parsons Corporation
- Heavily regulated defense contracts and cybersecurity laws increase compliance costs and political risk.
5. Supply Chain & Operations
Otis Worldwide Corporation
- Global manufacturing and service network vulnerable to raw material price fluctuations and geopolitical disruptions.
Parsons Corporation
- Complex federal and international operations face risks from supply delays and tech component shortages.
6. ESG & Climate Transition
Otis Worldwide Corporation
- ESG pressure to develop energy-efficient elevators and reduce carbon footprint amid urban sustainability trends.
Parsons Corporation
- Increasing demand for clean-energy infrastructure solutions but also exposure to environmental regulatory scrutiny.
7. Geopolitical Exposure
Otis Worldwide Corporation
- Significant international presence exposes it to currency and geopolitical risks in emerging markets.
Parsons Corporation
- Defense contracts tie revenue closely to U.S. government policy and global security dynamics.
Which company shows a better risk-adjusted profile?
Otis faces its greatest risk from its heavy leverage, which could impair flexibility in economic downturns. Parsons’ principal risk lies in its dependency on government contracts and regulatory changes in defense and infrastructure sectors. Despite Otis’s debt concerns, it delivers a stronger operational return on invested capital. Parsons offers lower market volatility but carries greater execution risk tied to project delivery and regulatory compliance. The recent data highlight Otis’s high debt-to-assets ratio at 82%, a red flag in cyclical industrials, while Parsons’s stable current ratio of 1.75 supports short-term resilience. Overall, Otis’s risk-adjusted profile appears slightly better due to its operational efficiency, but investors must watch its leverage closely.
Final Verdict: Which stock to choose?
Otis Worldwide Corporation’s superpower lies in its robust capital efficiency and strong value creation, evidenced by a rising ROIC well above its cost of capital. Its point of vigilance remains a stretched liquidity position, signaling potential short-term cash flow constraints. Otis fits well in portfolios seeking stable, value-driven growth with a tolerance for operational cash cycle nuances.
Parsons Corporation’s strategic moat centers on a conservative balance sheet with low leverage and a solid current ratio, providing relative safety. However, its declining profitability and negative value creation flag significant challenges ahead. Parsons suits investors focused on capital preservation and potential turnaround plays, favoring cautious exposure over aggressive growth.
If you prioritize consistent value creation and operational efficiency, Otis outshines Parsons due to its sustainable competitive advantage and improving profitability. However, if you seek a safer balance sheet and can tolerate slower growth, Parsons offers better stability despite weaker earnings metrics. Both present distinct risk-reward profiles aligned with specific investor objectives.
Disclaimer: Investment carries a risk of loss of initial capital. The past performance is not a reliable indicator of future results. Be sure to understand risks before making an investment decision.
Go Further
I encourage you to read the complete analyses of Otis Worldwide Corporation and Parsons Corporation to enhance your investment decisions: