Home > Comparison > Industrials > PH vs OTIS
The strategic rivalry between Parker-Hannifin Corporation and Otis Worldwide Corporation shapes the Industrials sector’s future. Parker-Hannifin, a diversified industrial machinery innovator, contrasts with Otis, a market leader in elevator and escalator manufacturing and services. This head-to-head reflects a clash between broad industrial solutions and specialized infrastructure services. I will evaluate which firm offers superior risk-adjusted returns, guiding investors toward the optimal choice for a balanced portfolio.
Table of contents
Companies Overview
Parker-Hannifin and Otis Worldwide stand as pivotal players in the industrial machinery sector, shaping global infrastructure and technology.
Parker-Hannifin Corporation: Precision Motion and Control Leader
Parker-Hannifin dominates the motion and control technology market. Its core revenue engine spans diversified industrial and aerospace systems, offering hydraulic, pneumatic, and electromechanical components. In 2026, it emphasizes innovation in sealing, filtration, and fluid control systems, targeting OEMs and industrial machinery users worldwide. This focus sustains its competitive edge in complex engineering solutions.
Otis Worldwide Corporation: Elevator and Escalator Innovator
Otis Worldwide commands the elevator and escalator industry, generating revenue through new equipment sales and extensive service operations. Its strategic focus centers on expanding its global maintenance network and modernizing infrastructure. With 34,000 service mechanics, Otis invests heavily in after-sales services, ensuring steady cash flow and customer retention across residential and commercial markets.
Strategic Collision: Similarities & Divergences
Both companies operate within industrial machinery yet diverge sharply in business philosophy. Parker-Hannifin excels through diversified product innovation and OEM partnerships, while Otis thrives on service-intensive infrastructure solutions. Their primary battleground lies in engineering excellence versus operational longevity. This contrast shapes distinct investment profiles: Parker-Hannifin appeals to growth-focused investors; Otis attracts those valuing stable, recurring revenue streams.
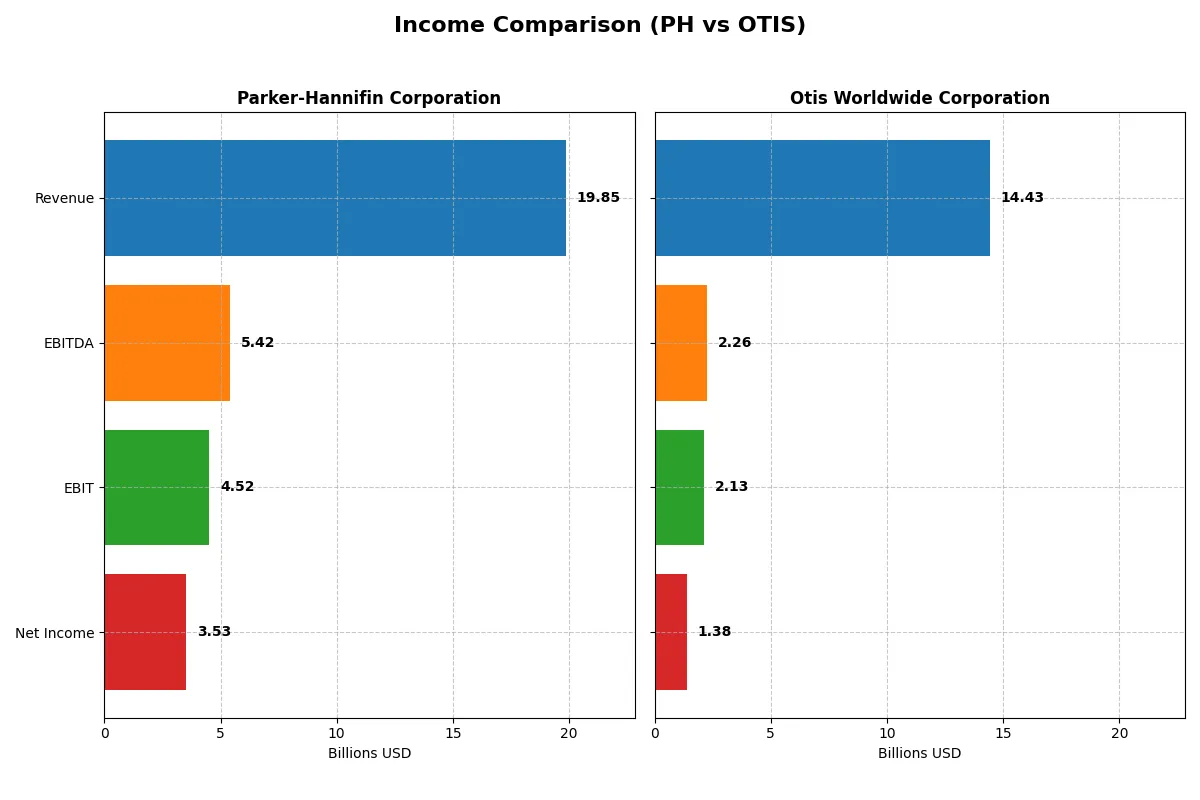
Income Statement Comparison
This data dissects the core profitability and scalability of both corporate engines to reveal who dominates the bottom line:
| Metric | Parker-Hannifin Corporation (PH) | Otis Worldwide Corporation (OTIS) |
|---|---|---|
| Revenue | 19.85B | 14.43B |
| Cost of Revenue | 12.54B | 10.04B |
| Operating Expenses | 3.26B | 2.20B |
| Gross Profit | 7.32B | 4.40B |
| EBITDA | 5.42B | 2.26B |
| EBIT | 4.52B | 2.13B |
| Interest Expense | 409M | 196M |
| Net Income | 3.53B | 1.38B |
| EPS | 27.52 | 3.53 |
| Fiscal Year | 2025 | 2025 |
Income Statement Analysis: The Bottom-Line Duel
This income statement comparison reveals which company converts sales into profits with superior efficiency and sustainable momentum.
Parker-Hannifin Corporation Analysis
Parker-Hannifin’s revenue edged slightly lower in 2025 to $19.85B but net income jumped 24% to $3.53B. Its gross margin holds strong at 36.85%, and net margin expanded to 17.79%, signaling tight cost control and operational leverage. The company’s EBIT margin rose over 22%, reflecting robust profit conversion despite flat sales.
Otis Worldwide Corporation Analysis
Otis grew revenue modestly by 1.2% to $14.43B in 2025, but net income declined 16.0% to $1.38B. Its gross margin at 30.46% and net margin near 9.6% remain healthy but trail Parker-Hannifin’s efficiency. EBIT margin rose slightly to 14.76%, though margin contraction and EPS decline indicate margin pressure and cost challenges.
Margin Dominance vs. Moderate Growth
Parker-Hannifin commands superior margin expansion and profit growth despite a small revenue dip, outperforming Otis’s modest top-line gains paired with shrinking net income. For investors prioritizing fundamental earnings power and margin resilience, Parker-Hannifin’s profile offers a clearer edge in capital allocation and profitability momentum.
Financial Ratios Comparison
These vital ratios act as a diagnostic tool to expose the underlying fiscal health, valuation premiums, and capital efficiency of the companies compared:
| Ratios | Parker-Hannifin (PH) | Otis Worldwide (OTIS) |
|---|---|---|
| ROE | 25.81% | -25.67% |
| ROIC | 13.69% | 40.74% |
| P/E | 25.38 | 24.85 |
| P/B | 6.55 | -6.38 |
| Current Ratio | 1.19 | 0.85 |
| Quick Ratio | 0.71 | 0.77 |
| D/E (Debt-to-Equity) | 0.69 | -1.62 |
| Debt-to-Assets | 32.16% | 82.14% |
| Interest Coverage | 9.93 | 11.20 |
| Asset Turnover | 0.67 | 1.35 |
| Fixed Asset Turnover | 6.76 | 11.13 |
| Payout Ratio | 24.38% | 46.75% |
| Dividend Yield | 0.96% | 1.88% |
| Fiscal Year | 2025 | 2025 |
Efficiency & Valuation Duel: The Vital Signs
Ratios reveal a company’s DNA, exposing hidden risks and operational strengths behind headline numbers.
Parker-Hannifin Corporation
Parker-Hannifin posts a strong 25.8% ROE and 17.8% net margin, signaling robust profitability. The stock trades at a stretched 25.4 P/E and 6.6 P/B, reflecting high market expectations. Dividend yield is low at 0.96%, implying a focus on reinvestment for growth rather than shareholder payouts.
Otis Worldwide Corporation
Otis shows an impressive 40.7% ROIC, highlighting capital efficiency despite a negative ROE of -25.7%. Valuation is reasonable with a 24.9 P/E and favorable negative P/B, unusual but linked to asset structure. It offers a higher 1.88% dividend yield, balancing income with moderate growth reinvestment.
Premium Valuation vs. Operational Safety
Both companies have slightly favorable overall ratio profiles but differ in focus. Parker-Hannifin blends solid profitability with a stretched valuation and low yield. Otis excels in capital efficiency but carries balance sheet risks and a negative ROE. Investors seeking income may prefer Otis, while growth-oriented profiles fit Parker-Hannifin better.
Which one offers the Superior Shareholder Reward?
I observe that Parker-Hannifin (PH) offers a more balanced and sustainable distribution model than Otis Worldwide (OTIS). PH yields about 0.96% with a moderate 24% payout ratio, supported by strong free cash flow coverage (~88%). OTIS yields higher at 1.88% but pays out 47% of earnings, reducing reinvestment capacity. PH’s robust buyback program enhances total return, while OTIS’s lower buybacks limit upside despite a higher yield. PH’s disciplined capital allocation and stronger cash flow metrics signal superior long-term shareholder value in 2026.
Comparative Score Analysis: The Strategic Profile
The radar chart reveals the fundamental DNA and trade-offs of Parker-Hannifin and Otis Worldwide, highlighting their financial strengths and vulnerabilities:
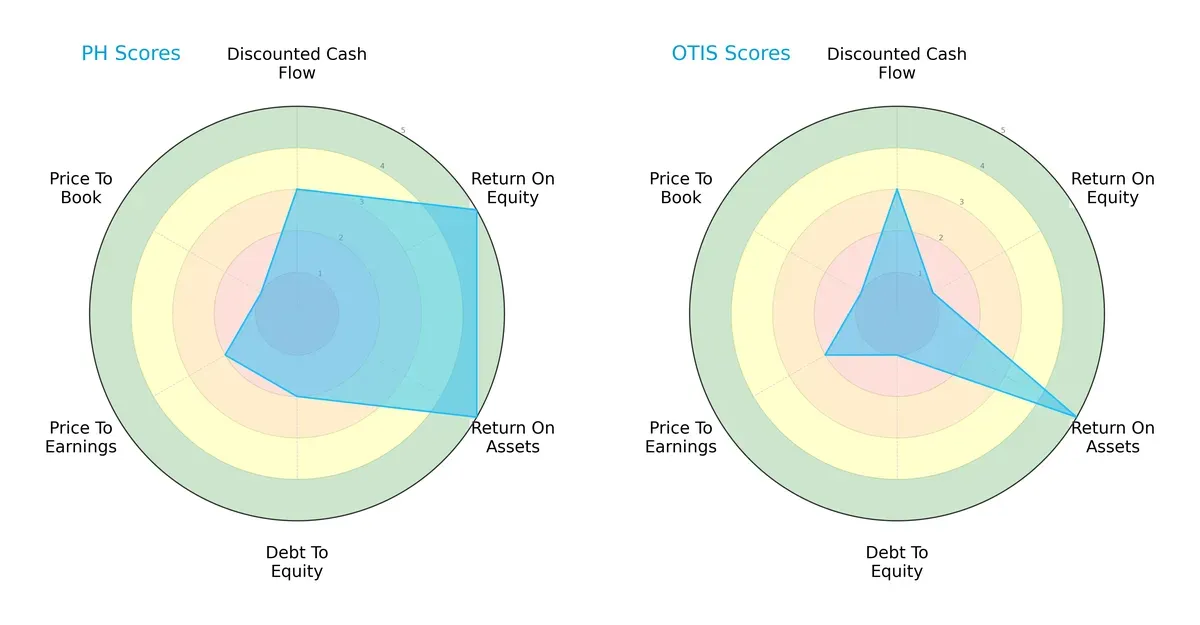
Parker-Hannifin dominates in return on equity (5 vs. 1) and maintains a stronger return on assets (5 vs. 5 equal), signaling efficient capital use. Otis shows a weaker debt-to-equity score (1 vs. 2), indicating higher leverage risk. Both share moderate discounted cash flow and price-to-earnings scores, but both suffer very unfavorable price-to-book valuations. Parker-Hannifin’s profile is more balanced, while Otis relies heavily on asset efficiency.
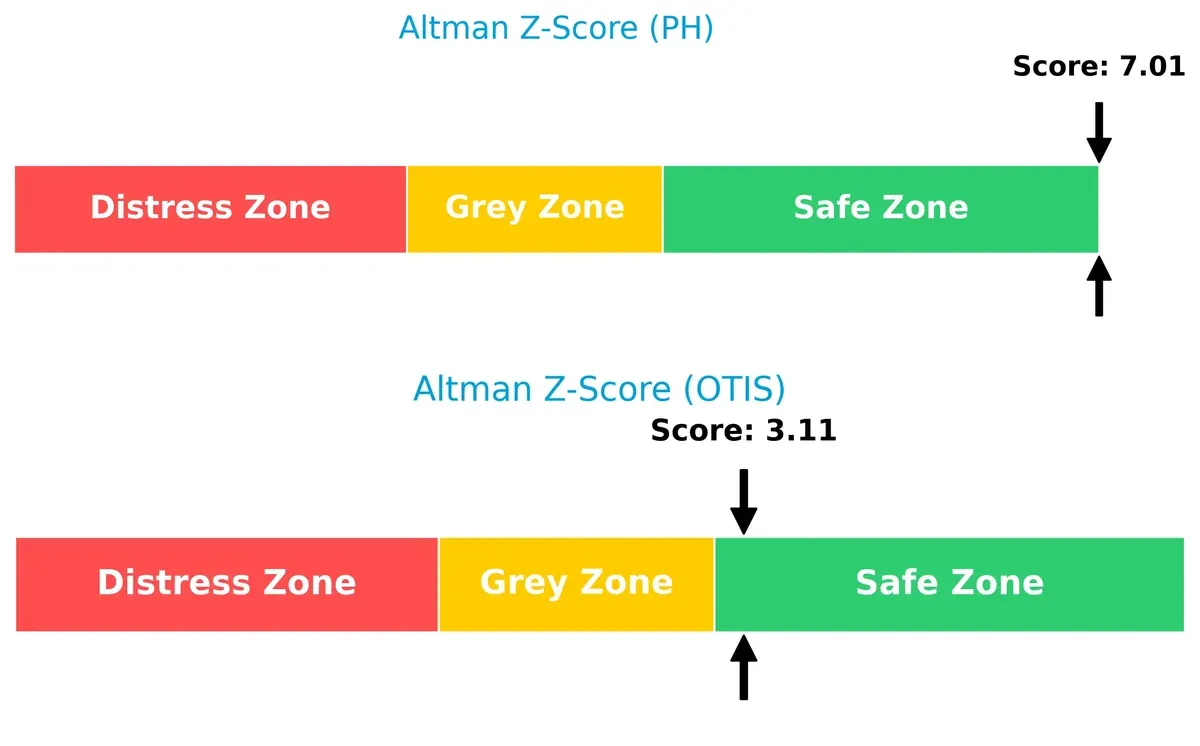
Bankruptcy Risk: Solvency Showdown
Parker-Hannifin’s Altman Z-Score at 7.0 vastly exceeds Otis’s 3.1, placing both in the safe zone but with Parker-Hannifin far more insulated from bankruptcy risk in this cycle:
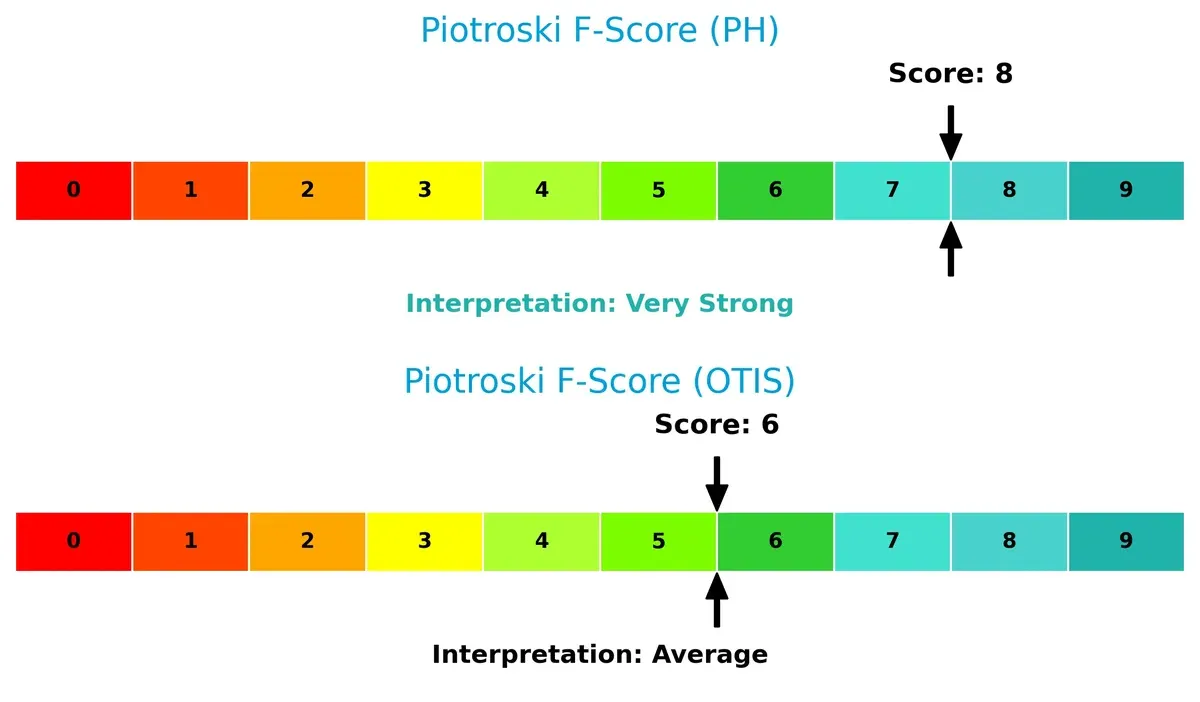
Financial Health: Quality of Operations
Parker-Hannifin’s Piotroski F-Score of 8 signals very strong financial health, outperforming Otis’s average score of 6. This suggests Parker-Hannifin has superior internal financial quality and fewer red flags:
How are the two companies positioned?
This section dissects the operational DNA of PH and OTIS by comparing their revenue distribution and internal dynamics. The goal is to confront their economic moats and identify which model offers the most resilient competitive advantage today.
Revenue Segmentation: The Strategic Mix
This comparison dissects how Parker-Hannifin and Otis diversify their income streams and reveals where their primary sector bets lie:
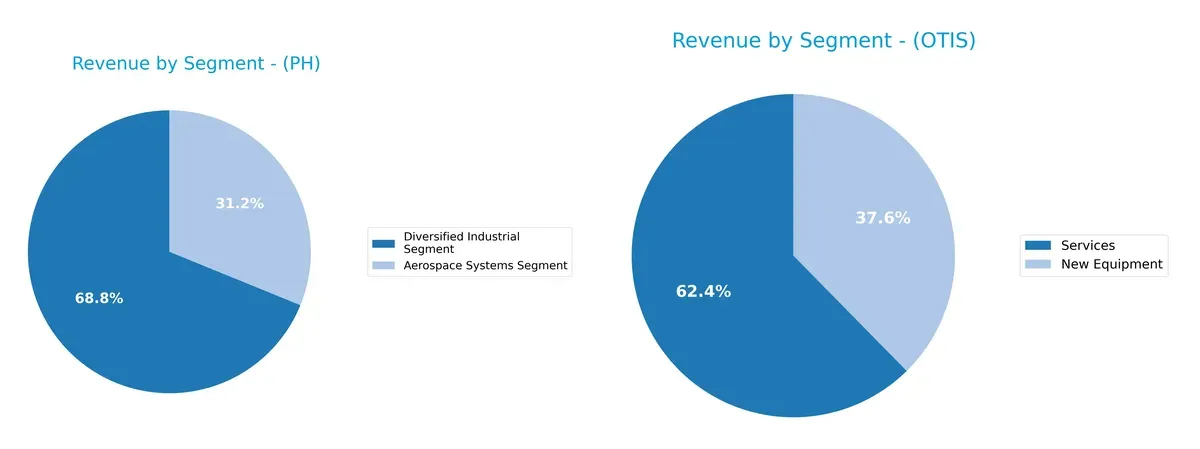
Parker-Hannifin anchors its revenue in the Diversified Industrial Segment at $13.7B, with Aerospace Systems contributing $6.2B, showing moderate diversification. Otis leans on Services at $8.9B, dwarfing New Equipment at $5.4B, signaling a stable recurring revenue base. Parker’s mix suggests industrial breadth, reducing concentration risk. Otis’s focus on services locks in long-term customer relationships, emphasizing infrastructure dominance but increasing exposure to service market cycles.
Strengths and Weaknesses Comparison
This table compares the Strengths and Weaknesses of Parker-Hannifin Corporation (PH) and Otis Worldwide Corporation (OTIS):
PH Strengths
- Strong profitability with 17.79% net margin and 25.81% ROE
- Favorable ROIC of 13.69% exceeding WACC
- Diversified revenue streams in Aerospace and Industrial segments
- Solid global presence with $13.4B North America and $3.9B Europe revenues
- Stable interest coverage ratio at 11.04
- High fixed asset turnover of 6.76
OTIS Strengths
- Exceptional ROIC of 40.74% well above 7.44% WACC
- Favorable debt/equity structure and PB ratio
- Higher asset turnover at 1.35 and fixed asset turnover at 11.13
- Global footprint with strong presence in US, China, and other regions
- Interest coverage at 10.87 supports debt service
- Balanced revenue between New Equipment and Services
PH Weaknesses
- Unfavorable valuation metrics with PE 25.38 and PB 6.55
- Quick ratio at 0.71 signals liquidity caution
- Dividend yield below 1% may deter income investors
- Moderate leverage with debt to assets of 32.16%
- Neutral current ratio of 1.19 limits short-term flexibility
OTIS Weaknesses
- Negative ROE at -25.67% indicates operational challenges
- High debt to assets at 82.14% increases financial risk
- Current and quick ratios under 1 raise liquidity concerns
- Dividend yield neutral at 1.88% but no strong income appeal
- Mixed net margin at 9.59% dampens overall profitability
Both companies show slightly favorable overall ratio profiles but differ in financial health and market positioning. PH excels in profitability and diversification, while OTIS leads in capital efficiency but faces liquidity and leverage risks. These contrasts shape strategic priorities around risk management and growth focus.
The Moat Duel: Analyzing Competitive Defensibility
A structural moat is the only barrier protecting long-term profits from relentless competitive pressures. Let’s dissect the core moats of two industrial giants:
Parker-Hannifin Corporation: Diversified Industrial Control Moat
Parker-Hannifin’s moat stems from high switching costs embedded in its motion and control technologies. It sustains robust 22.75% EBIT margins and steady ROIC growth, signaling efficient capital use. In 2026, expanding aerospace systems could deepen this advantage, though intensified industrial competition poses risks.
Otis Worldwide Corporation: Service Network Lock-in
Otis relies on a vast service network and recurring maintenance contracts, contrasting Parker-Hannifin’s product-focused moat. Its 14.76% EBIT margin and soaring ROIC trend reflect strong value creation. Otis’s growth hinges on expanding modernization services and penetrating emerging markets amid rising urbanization.
Margin Stability vs. Service Network Dominance
Both firms exhibit very favorable moats with growing ROICs, but Otis’s 33% ROIC premium over WACC and sharper ROIC growth outpace Parker-Hannifin’s 4.4% spread. Otis’s entrenched service ecosystem offers a wider moat, better equipping it to defend market share against disruptive forces in 2026.
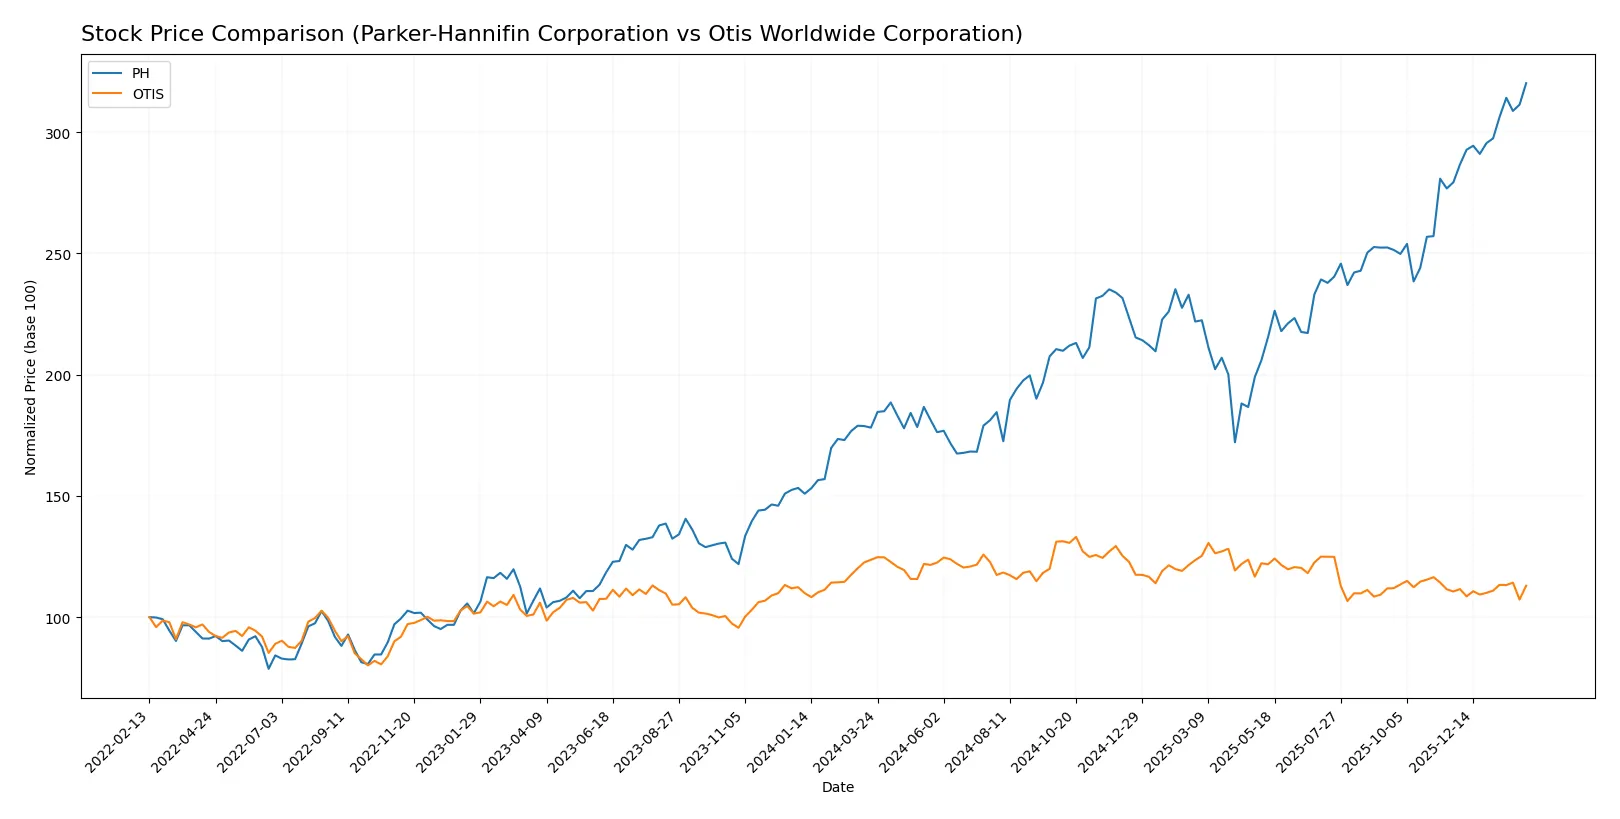
Which stock offers better returns?
Over the past year, Parker-Hannifin’s stock surged sharply, showing strong upward momentum. Otis Worldwide’s shares fell overall despite a modest recent uptick, reflecting divergent trading dynamics.
Trend Comparison
Parker-Hannifin’s stock exhibits a robust 79.76% gain over the past 12 months, confirming a bullish trend with accelerating price growth and notable volatility. The price peaked at 962.45 and bottomed at 503.3.
Otis Worldwide’s stock declined 8.67% over the same period, marking a bearish trend despite a slight recent 2.16% rise. The price ranged between 84.93 and 106.01, with low volatility and accelerating downward momentum.
Comparing trends, Parker-Hannifin outperformed Otis Worldwide significantly, delivering the highest market returns with strong acceleration and buyer dominance.
Target Prices
Analysts show a cautiously optimistic outlook for both Parker-Hannifin and Otis Worldwide.
| Company | Target Low | Target High | Consensus |
|---|---|---|---|
| Parker-Hannifin Corporation | 825 | 1,139 | 995.46 |
| Otis Worldwide Corporation | 92 | 109 | 97.75 |
The consensus targets suggest modest upside potential for Parker-Hannifin, trading near $963. Otis’s target consensus also exceeds its current price of $90, indicating room for appreciation.

Don’t Let Luck Decide Your Entry Point
Optimize your entry points with our advanced ProRealTime indicators. You’ll get efficient buy signals with precise price targets for maximum performance. Start outperforming now!
How do institutions grade them?
The following tables summarize recent institutional grades for Parker-Hannifin Corporation and Otis Worldwide Corporation:
Parker-Hannifin Corporation Grades
This table presents the latest analyst ratings and grades for Parker-Hannifin Corporation.
| Grading Company | Action | New Grade | Date |
|---|---|---|---|
| Jefferies | Maintain | Buy | 2026-01-30 |
| Barclays | Maintain | Overweight | 2026-01-30 |
| Stifel | Maintain | Hold | 2026-01-30 |
| JP Morgan | Maintain | Overweight | 2026-01-30 |
| Wells Fargo | Maintain | Overweight | 2026-01-30 |
| Citigroup | Maintain | Buy | 2026-01-30 |
| Stifel | Maintain | Hold | 2026-01-23 |
| JP Morgan | Maintain | Overweight | 2026-01-16 |
| Morgan Stanley | Maintain | Equal Weight | 2026-01-14 |
| Barclays | Maintain | Overweight | 2026-01-07 |
Otis Worldwide Corporation Grades
This table shows recent analyst ratings and grades for Otis Worldwide Corporation.
| Grading Company | Action | New Grade | Date |
|---|---|---|---|
| JP Morgan | Maintain | Overweight | 2026-01-16 |
| Wells Fargo | Maintain | Equal Weight | 2025-12-15 |
| Barclays | Maintain | Underweight | 2025-10-30 |
| JP Morgan | Maintain | Overweight | 2025-10-15 |
| Wolfe Research | Upgrade | Outperform | 2025-10-08 |
| Wells Fargo | Maintain | Equal Weight | 2025-10-06 |
| JP Morgan | Maintain | Overweight | 2025-09-18 |
| RBC Capital | Maintain | Outperform | 2025-07-28 |
| Wolfe Research | Upgrade | Peer Perform | 2025-07-25 |
| Wells Fargo | Maintain | Equal Weight | 2025-07-24 |
Which company has the best grades?
Parker-Hannifin consistently receives Buy and Overweight ratings from top firms, reflecting strong confidence. Otis displays more mixed grades, including Underweight and Equal Weight, signaling more cautious sentiment. Investors may view Parker-Hannifin’s grades as more bullish, potentially impacting portfolio positioning accordingly.
Risks specific to each company
The following categories identify critical pressure points and systemic threats facing Parker-Hannifin Corporation and Otis Worldwide Corporation in the 2026 market environment:
1. Market & Competition
Parker-Hannifin Corporation
- Faces intense competition in diversified industrial and aerospace segments, requiring continuous innovation to maintain market share.
Otis Worldwide Corporation
- Competes in elevator and escalator manufacturing with pressure from global infrastructure trends and service quality demands.
2. Capital Structure & Debt
Parker-Hannifin Corporation
- Maintains moderate debt levels (D/E 0.69), balancing leverage with healthy interest coverage (11.04x).
Otis Worldwide Corporation
- Exhibits very high debt to assets (82.14%), with negative D/E ratio, signaling potential financial risk despite adequate interest coverage.
3. Stock Volatility
Parker-Hannifin Corporation
- Beta of 1.24 indicates above-market volatility, reflecting sensitivity to cyclical industrial trends.
Otis Worldwide Corporation
- Beta near 1.01 suggests stock price moves roughly in line with overall market, implying moderate volatility.
4. Regulatory & Legal
Parker-Hannifin Corporation
- Subject to aerospace and industrial regulations; compliance costs and litigation risks remain significant.
Otis Worldwide Corporation
- Faces regulatory scrutiny in safety standards for elevator systems, with potential liability from service failures.
5. Supply Chain & Operations
Parker-Hannifin Corporation
- Complex global supply chain for specialized components; vulnerable to raw material cost fluctuations and logistics disruptions.
Otis Worldwide Corporation
- Relies on extensive service network and parts supply; operational efficiency is critical to maintain customer satisfaction.
6. ESG & Climate Transition
Parker-Hannifin Corporation
- Pressure to reduce emissions in manufacturing and provide sustainable solutions amid rising ESG investor expectations.
Otis Worldwide Corporation
- Faces challenges in electrification and energy efficiency of products, with strong focus on sustainable urban infrastructure.
7. Geopolitical Exposure
Parker-Hannifin Corporation
- Exposure to aerospace defense contracts and international trade policies adds geopolitical risk.
Otis Worldwide Corporation
- Global operations subject to regional political instability, especially in emerging markets with growing urbanization.
Which company shows a better risk-adjusted profile?
Parker-Hannifin’s moderate leverage, strong profitability, and high Altman Z-score (7.0) support a stronger risk-adjusted profile. Otis struggles with high debt and negative equity ratios despite good asset returns, raising financial distress concerns. Parker-Hannifin’s diversified industrial and aerospace focus buffers cyclical risks better than Otis’s concentrated elevator services. The standout risk for Parker-Hannifin is its market competition intensity. For Otis, the heavy debt burden is the most impactful risk, heightened by its lower Piotroski score (6 vs. 8). Recent data revealing Otis’s debt to assets over 80% justifies heightened caution.
Final Verdict: Which stock to choose?
Parker-Hannifin’s superpower lies in its robust and growing profitability, fueled by a very favorable economic moat. It efficiently turns invested capital into value, making it a strong performer despite some caution warranted by its moderate liquidity. This stock suits an aggressive growth portfolio willing to embrace cyclical risks.
Otis Worldwide boasts a distinctive strategic moat with an exceptionally high ROIC compared to its cost of capital, reflecting efficient capital use and a resilient competitive advantage. While it has a more conservative profile than Parker-Hannifin, its balance sheet shows vulnerabilities. Otis fits well within a GARP (Growth at a Reasonable Price) strategy, balancing growth and stability.
If you prioritize sustainable value creation and robust profitability underpinned by a growing moat, Parker-Hannifin outshines due to its superior income growth and industry-leading returns. However, if you seek better stability with a proven capital efficiency edge and a more conservative risk posture, Otis offers a compelling scenario despite its recent price softness. Both cases require vigilance on liquidity and debt metrics.
Disclaimer: Investment carries a risk of loss of initial capital. The past performance is not a reliable indicator of future results. Be sure to understand risks before making an investment decision.
Go Further
I encourage you to read the complete analyses of Parker-Hannifin Corporation and Otis Worldwide Corporation to enhance your investment decisions: