In today’s fast-evolving technology landscape, Oracle Corporation and Zscaler, Inc. stand out as key players in the software infrastructure sector. Oracle, a seasoned giant, offers a broad cloud and enterprise software portfolio, while Zscaler focuses on innovative cloud security solutions. Both companies compete in overlapping markets with distinct strategies, making their comparison essential. In this article, I will help you identify which company presents the most compelling investment opportunity.
Table of contents
Companies Overview
I will begin the comparison between Oracle Corporation and Zscaler, Inc. by providing an overview of these two companies and their main differences.
Oracle Overview
Oracle Corporation focuses on providing enterprise information technology products and services globally. Its offerings include cloud software applications such as Oracle Fusion cloud ERP, supply chain management, and human capital management, alongside cloud infrastructure technologies like Oracle Database and Java. Founded in 1977 and headquartered in Austin, Texas, Oracle serves businesses, government agencies, and educational institutions with both cloud and hardware solutions.
Zscaler Overview
Zscaler, Inc. specializes in cloud security solutions worldwide, offering products like Zscaler Internet Access and Private Access to secure application access for users and devices. Its services also include digital experience monitoring and workload segmentation to enhance security and compliance. Founded in 2007 and based in San Jose, California, Zscaler targets industries ranging from financial services to healthcare and telecommunications.
Key similarities and differences
Both Oracle and Zscaler operate within the technology sector, focusing on software infrastructure. Oracle offers a broad portfolio including cloud applications, databases, and hardware, serving a wide range of enterprise needs. In contrast, Zscaler concentrates solely on cloud security and access solutions. Oracle’s scale is significantly larger with 159K employees and a market cap over 549B, while Zscaler is smaller, with 7.3K employees and a 34B market cap, reflecting their different market positions and business scopes.
Income Statement Comparison
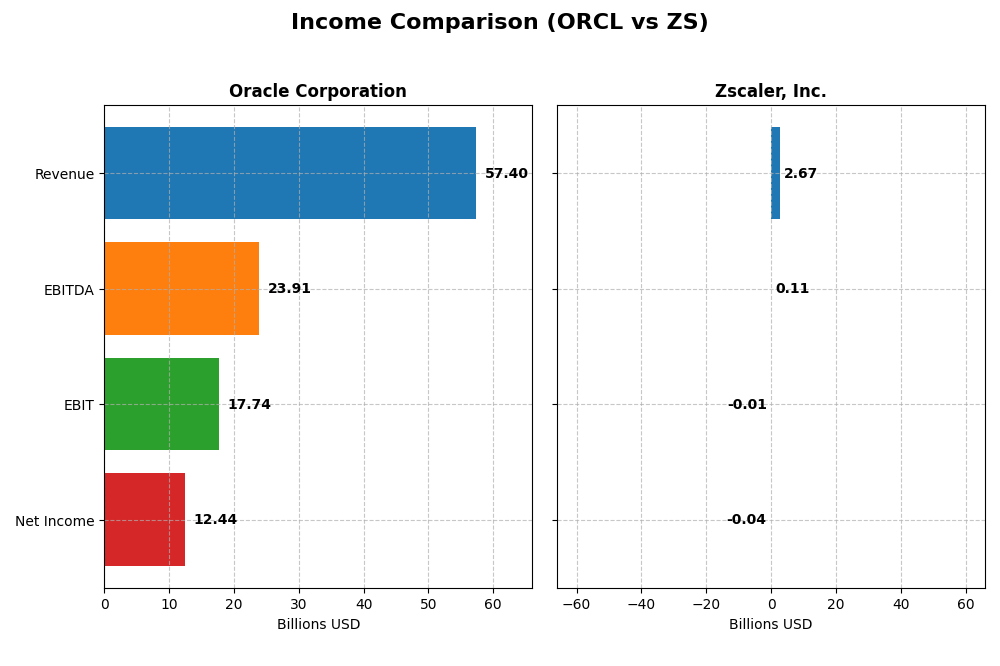
Below is a side-by-side comparison of key income statement metrics for Oracle Corporation and Zscaler, Inc. for the most recent fiscal year available.
| Metric | Oracle Corporation | Zscaler, Inc. |
|---|---|---|
| Market Cap | 549B | 34B |
| Revenue | 57.4B | 2.67B |
| EBITDA | 23.9B | 112M |
| EBIT | 17.7B | -8.8M |
| Net Income | 12.4B | -41M |
| EPS | 4.46 | -0.27 |
| Fiscal Year | 2025 | 2025 |
Income Statement Interpretations
Oracle Corporation
Oracle’s revenue showed steady growth from $40.5B in 2021 to $57.4B in 2025, reflecting a 41.8% increase over the period. Net income fluctuated, peaking at $13.7B in 2021 but falling to $12.4B in 2025, with net margin declining overall. The 2025 fiscal year saw favorable revenue growth of 8.4% and improved EBIT margin to 30.9%, indicating solid operational efficiency despite some margin pressure.
Zscaler, Inc.
Zscaler experienced rapid revenue growth from $673M in 2021 to $2.67B in 2025, a 297% increase, alongside a marked improvement in net income from a -$262M loss to a smaller -$41M loss in 2025. Gross margin remained favorable at 76.9%, but EBIT and net margins stayed negative, albeit improving. The latest year highlighted strong revenue growth of 23.3% and significant margin improvements, signaling progress toward profitability.
Which one has the stronger fundamentals?
Oracle demonstrates strong profitability with consistently high gross and EBIT margins, stable net income, and favorable operational growth despite some net margin decline. Zscaler boasts impressive revenue and net income growth rates with improving margins but remains unprofitable overall. Oracle’s mature profitability contrasts with Zscaler’s growth phase and negative net margins, reflecting differing fundamental strengths and risk profiles.
Financial Ratios Comparison
The table below presents a side-by-side comparison of key financial ratios for Oracle Corporation and Zscaler, Inc. for the most recent fiscal year available, offering a clear snapshot of their financial metrics.
| Ratios | Oracle Corporation (2025) | Zscaler, Inc. (2025) |
|---|---|---|
| ROE | 60.8% | -2.3% |
| ROIC | 10.9% | -3.2% |
| P/E | 37.1 | -1063.0 |
| P/B | 22.6 | 24.5 |
| Current Ratio | 0.75 | 2.01 |
| Quick Ratio | 0.75 | 2.01 |
| D/E | 5.09 | 1.00 |
| Debt-to-Assets | 61.8% | 28.0% |
| Interest Coverage | 4.94 | -13.49 |
| Asset Turnover | 0.34 | 0.42 |
| Fixed Asset Turnover | 1.32 | 4.22 |
| Payout ratio | 38.1% | 0.0% |
| Dividend yield | 1.03% | 0.00% |
Interpretation of the Ratios
Oracle Corporation
Oracle shows strong profitability with a favorable net margin of 21.68% and an impressive return on equity at 60.84%, indicating efficient shareholder value creation. However, liquidity ratios such as current and quick ratios at 0.75 are weak, and the company carries high leverage with a debt-to-equity ratio of 5.09. Oracle pays a dividend with a modest yield of 1.03%, supported by free cash flow, though high debt levels could pose risks for dividend sustainability.
Zscaler, Inc.
Zscaler displays weak profitability metrics with negative net margin (-1.55%) and return on equity (-2.31%), reflecting ongoing unprofitability. Its liquidity is strong, with current and quick ratios around 2.0, and it maintains moderate leverage levels. Zscaler does not pay dividends, consistent with its growth focus and reinvestment strategy, prioritizing R&D and product development amidst a challenging profitability environment.
Which one has the best ratios?
Oracle’s ratios reflect stronger profitability and shareholder returns but are tempered by weak liquidity and high leverage. Zscaler offers better liquidity and lower debt but suffers from persistent losses and no dividend distribution. Overall, Oracle’s financial metrics are more favorable in profitability and shareholder value, while Zscaler’s metrics indicate a growth phase with financial challenges.
Strategic Positioning
This section compares the strategic positioning of Oracle Corporation and Zscaler, Inc. in terms of market position, key segments, and exposure to technological disruption:
Oracle Corporation
- Large market cap of 549B; diversified software infrastructure with competitive pressures from various tech firms.
- Key segments include cloud and license business (49B), hardware (2.9B), and services (5.2B), serving multiple industries globally.
- Exposure includes cloud infrastructure and database technologies; faces disruption from evolving cloud and blockchain innovations.
Zscaler, Inc.
- Smaller market cap of 34B; focused on cloud security with competition in cybersecurity sector.
- Single reportable segment of 2.7B specializing in cloud security solutions for diverse industries.
- Positioned in cloud security, addressing SaaS, cloud, and IoT security; technology disruption is central to its business.
Oracle Corporation vs Zscaler, Inc. Positioning
Oracle adopts a diversified approach with multiple business lines spanning cloud, hardware, and services, offering broad market coverage. Zscaler concentrates on cloud security, focusing on specialized solutions, which may limit diversification but allows targeted innovation.
Which has the best competitive advantage?
Both companies show a slightly unfavorable moat status with value destruction; Oracle has declining profitability while Zscaler shows improving returns, indicating Zscaler’s growth potential despite current value shedding.
Stock Comparison
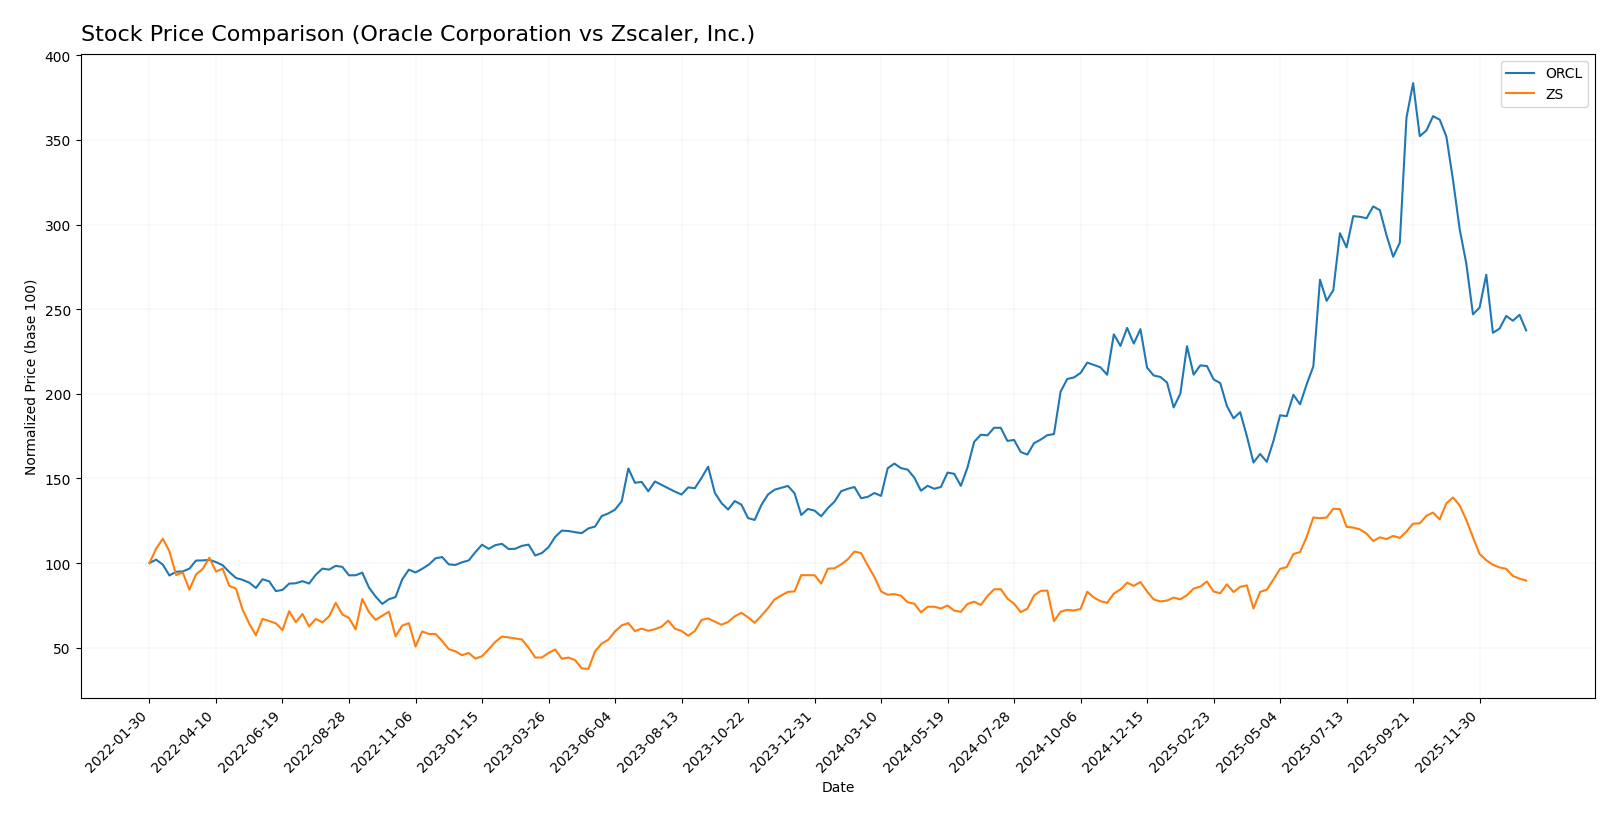
The stock price movements of Oracle Corporation and Zscaler, Inc. over the past 12 months reveal contrasting trends, with Oracle showing strong gains despite recent declines, and Zscaler experiencing an overall downward trajectory with accelerating losses.
Trend Analysis
Oracle Corporation’s stock demonstrated a bullish trend over the past year, rising 70.69%, though recent months show a decelerating decline of 27.23%, with moderate volatility indicated by a 49.0 overall standard deviation. Zscaler, Inc.’s stock followed a bearish trend, falling 9.03% over the year, with recent losses accelerating to 35.38%, and a slightly lower overall volatility at 47.11 standard deviation. Comparing both stocks, Oracle delivered the highest market performance with a substantial positive gain, while Zscaler’s stock underperformed, declining steadily throughout the period.
Target Prices
Analysts provide a confident target price consensus for Oracle Corporation and Zscaler, Inc., indicating potential upside from current levels.
| Company | Target High | Target Low | Consensus |
|---|---|---|---|
| Oracle Corporation | 400 | 175 | 314.08 |
| Zscaler, Inc. | 360 | 260 | 311.41 |
The consensus target prices for both Oracle and Zscaler suggest significant upside potential compared to their current stock prices of 191.09 and 213.98, respectively, reflecting generally positive analyst outlooks.
Analyst Opinions Comparison
This section compares analysts’ ratings and grades for Oracle Corporation and Zscaler, Inc.:
Rating Comparison
Oracle Corporation Rating
- Rated B, indicating a very favorable overall evaluation.
- Discounted Cash Flow Score of 3, reflecting a moderate valuation view.
- Return on Equity Score of 5, indicating very favorable profitability.
- Return on Assets Score of 4, showing favorable asset utilization.
- Debt to Equity Score of 1, reflecting very unfavorable financial risk.
- Overall Score of 3, rated moderate for financial strength.
Zscaler, Inc. Rating
- Rated C-, considered very unfavorable overall evaluation.
- Discounted Cash Flow Score of 4, showing a favorable valuation.
- Return on Equity Score of 1, signaling very unfavorable returns.
- Return on Assets Score of 1, indicating very unfavorable usage.
- Debt to Equity Score of 1, also very unfavorable financial risk.
- Overall Score of 1, rated very unfavorable for financial strength.
Which one is the best rated?
Oracle Corporation holds higher ratings and scores overall, particularly excelling in return on equity and assets. Zscaler, despite a favorable discounted cash flow score, is rated lower with very unfavorable scores in profitability and financial stability.
Scores Comparison
Here is a comparison of the Altman Z-Score and Piotroski Score for Oracle Corporation and Zscaler, Inc.:
Oracle Corporation Scores
- Altman Z-Score: 2.43, indicating moderate bankruptcy risk in the grey zone.
- Piotroski Score: 5, showing average financial strength.
Zscaler, Inc. Scores
- Altman Z-Score: 4.89, indicating low bankruptcy risk in the safe zone.
- Piotroski Score: 3, indicating very weak financial strength.
Which company has the best scores?
Based strictly on the provided data, Zscaler has a stronger Altman Z-Score, suggesting better bankruptcy safety, while Oracle shows a higher Piotroski Score, reflecting better overall financial strength.
Grades Comparison
Here is a detailed comparison of stock grades for Oracle Corporation and Zscaler, Inc.:
Oracle Corporation Grades
The following table summarizes recent grades from reputable financial institutions for Oracle:
| Grading Company | Action | New Grade | Date |
|---|---|---|---|
| UBS | Maintain | Buy | 2026-01-05 |
| RBC Capital | Maintain | Sector Perform | 2026-01-05 |
| Jefferies | Maintain | Buy | 2026-01-05 |
| Goldman Sachs | Maintain | Neutral | 2025-12-12 |
| Keybanc | Maintain | Overweight | 2025-12-11 |
| UBS | Maintain | Buy | 2025-12-11 |
| Citigroup | Maintain | Buy | 2025-12-11 |
| JP Morgan | Maintain | Neutral | 2025-12-11 |
| DA Davidson | Maintain | Neutral | 2025-12-11 |
| Scotiabank | Maintain | Sector Outperform | 2025-12-11 |
Oracle’s grades predominantly reflect a positive outlook, with multiple Buy and Overweight ratings alongside some Neutral and Sector Perform opinions.
Zscaler, Inc. Grades
Below are the recent grades from recognized grading companies for Zscaler:
| Grading Company | Action | New Grade | Date |
|---|---|---|---|
| Citigroup | Maintain | Buy | 2026-01-13 |
| Keybanc | Maintain | Overweight | 2026-01-12 |
| Piper Sandler | Maintain | Neutral | 2026-01-05 |
| RBC Capital | Maintain | Outperform | 2026-01-05 |
| Mizuho | Upgrade | Outperform | 2025-12-16 |
| Bernstein | Downgrade | Market Perform | 2025-12-01 |
| Citigroup | Maintain | Buy | 2025-12-01 |
| JP Morgan | Maintain | Overweight | 2025-11-26 |
| Baird | Maintain | Outperform | 2025-11-26 |
| BTIG | Maintain | Buy | 2025-11-26 |
Zscaler shows a generally favorable grade trend, with several Buy, Overweight, and Outperform ratings, though it experienced a recent downgrade from Bernstein.
Which company has the best grades?
Both Oracle and Zscaler hold a consensus “Buy” rating, but Oracle has a larger number of Buy ratings and stable Neutral opinions from major firms, while Zscaler exhibits more Outperform ratings but also a recent downgrade. Investors may note Oracle’s broader support across institutions versus Zscaler’s more mixed but still positive sentiment.
Strengths and Weaknesses
Below is a comparison table highlighting the key strengths and weaknesses of Oracle Corporation and Zscaler, Inc., based on the most recent financial and operational data.
| Criterion | Oracle Corporation (ORCL) | Zscaler, Inc. (ZS) |
|---|---|---|
| Diversification | Highly diversified with Cloud & License $49.23B, Hardware $2.94B, Services $5.23B | Focused on cloud security with $2.67B revenue, less diversified |
| Profitability | Strong profitability: net margin 21.68%, ROE 60.84%, ROIC 10.86% | Negative profitability: net margin -1.55%, ROE -2.31%, ROIC -3.18% |
| Innovation | Moderate innovation, legacy strength in database and cloud licensing | High innovation in cloud security, rapidly growing ROIC trend (+76%) |
| Global presence | Extensive global footprint, established market leader | Growing global presence but smaller scale |
| Market Share | Large and stable market share in enterprise software | Smaller market share but expanding in cybersecurity niche |
Key takeaways: Oracle shows strong profitability and broad diversification but faces declining ROIC and some financial ratio weaknesses. Zscaler is less profitable but demonstrates promising growth and innovation in cloud security, with improving capital efficiency. Both have slightly unfavorable moat evaluations, warranting cautious but differentiated risk management.
Risk Analysis
Below is a comparative risk overview of Oracle Corporation and Zscaler, Inc. based on the most recent fiscal year 2025 data:
| Metric | Oracle Corporation | Zscaler, Inc. |
|---|---|---|
| Market Risk | High beta 1.65, indicating elevated volatility and sensitivity to market swings | Moderate beta 1.02, close to market average volatility |
| Debt level | High leverage with debt-to-equity of 5.09 and debt-to-assets 61.83% (unfavorable) | Moderate leverage; debt-to-equity 1.0 and debt-to-assets 27.98% (favorable) |
| Regulatory Risk | Moderate, typical for large software and cloud providers | Moderate, with cloud security industry compliance requirements |
| Operational Risk | Large scale operations with some asset turnover inefficiency | Smaller scale but innovative cloud security, risks in rapid growth management |
| Environmental Risk | Moderate, typical for technology hardware and data centers | Low to moderate, primarily cloud-based services |
| Geopolitical Risk | US-based global operations, exposed to trade tensions and data sovereignty issues | US-based with global cloud access, sensitive to international regulatory changes |
The most impactful risks are Oracle’s high financial leverage and market volatility, which could pressure liquidity and earnings stability. Zscaler shows lower debt risk but struggles with negative profitability and weak interest coverage, signaling operational and financial challenges despite a safer Altman Z-Score. Investors should weigh Oracle’s financial risk against Zscaler’s growth-phase uncertainties.
Which Stock to Choose?
Oracle Corporation (ORCL) shows a favorable income evolution with 8.38% revenue growth in 2025 and strong profitability metrics, including a 21.68% net margin and 60.84% ROE. However, its financial ratios are globally unfavorable, with high debt and low liquidity, and the company is slightly value-destroying per its declining ROIC versus WACC. Its rating is very favorable at B, supported by strong returns but weighed down by leverage concerns.
Zscaler, Inc. (ZS) demonstrates robust income growth, with 23.31% revenue increase and improving net margin, yet remains unprofitable with negative ROE and ROIC. Its financial ratios are slightly unfavorable overall but show strengths in liquidity and lower debt levels. The company is also slightly value-destroying but with a rising ROIC trend. ZS holds a very favorable rating of C-, despite weaker profitability scores and higher valuation multiples.
Investors seeking stable profitability and high returns on equity might find Oracle’s profile more appealing, while those oriented towards growth and improving profitability trends could view Zscaler’s accelerating income and liquidity as promising. The choice might depend on whether an investor prioritizes established earnings and scale or potential growth with higher risk.
Disclaimer: Investment carries a risk of loss of initial capital. The past performance is not a reliable indicator of future results. Be sure to understand risks before making an investment decision.
Go Further
I encourage you to read the complete analyses of Oracle Corporation and Zscaler, Inc. to enhance your investment decisions: