In the rapidly evolving technology landscape, Oracle Corporation and UiPath Inc. stand out as key players in software infrastructure. Oracle, a longstanding giant, offers comprehensive cloud and enterprise solutions, while UiPath focuses on cutting-edge robotic process automation (RPA) that streamlines business operations. Both companies compete in overlapping markets with distinct innovation strategies. In this article, I will guide you in identifying which company presents the most compelling investment opportunity in 2026.
Table of contents
Companies Overview
I will begin the comparison between Oracle and UiPath by providing an overview of these two companies and their main differences.
Oracle Overview
Oracle Corporation focuses on delivering enterprise IT solutions globally, specializing in cloud software applications, including ERP, performance management, and human capital management. The company also offers infrastructure technologies like the Oracle Database, Java development language, and hardware products. Founded in 1977 and headquartered in Austin, Texas, Oracle serves diverse industries including government and education, employing 159K people and boasting a market cap of $549B.
UiPath Overview
UiPath Inc. provides an end-to-end robotic process automation (RPA) platform aimed at automating business workflows primarily in the US, Romania, and Japan. Its software suite integrates AI, low-code development, and centralized management tools to streamline automation across enterprises. Founded in 2005 and based in New York City, UiPath serves sectors like banking and healthcare, with a workforce of 3.9K and a market cap of $7.7B.
Key similarities and differences
Both Oracle and UiPath operate within the technology sector, specifically in software infrastructure, and are publicly traded on the NYSE. Oracle’s business is broader, covering cloud applications, databases, and hardware, while UiPath specializes solely in automation software. Oracle’s scale and employee count are significantly larger, reflecting its established position, whereas UiPath is more focused on RPA solutions for specific industries, indicating different market approaches.
Income Statement Comparison
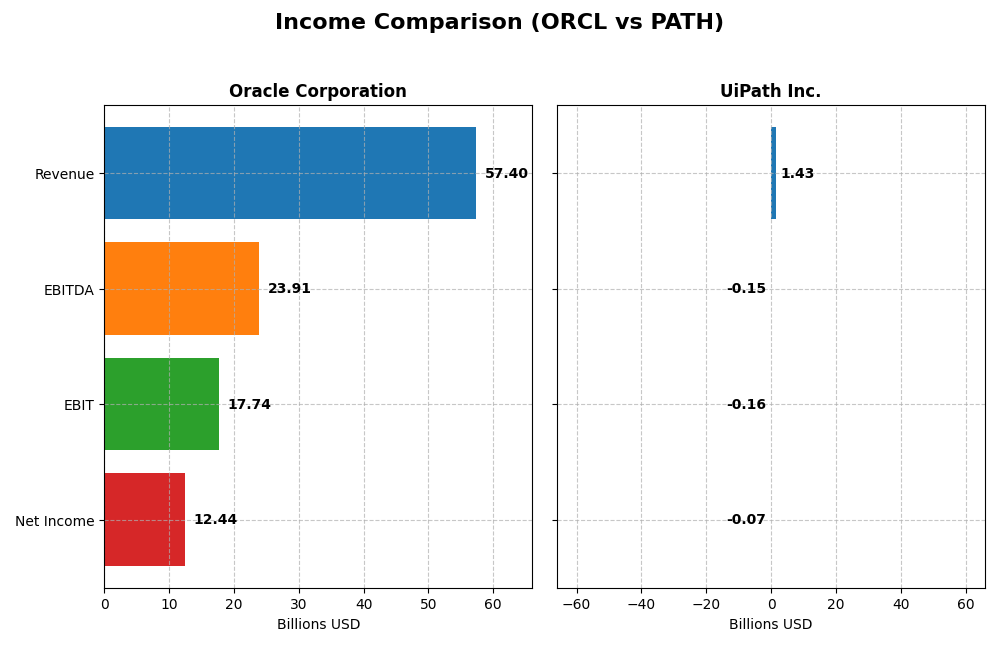
The table below presents a side-by-side comparison of key income statement metrics for Oracle Corporation and UiPath Inc. for their most recent fiscal years.
| Metric | Oracle Corporation | UiPath Inc. |
|---|---|---|
| Market Cap | 549B | 7.7B |
| Revenue | 57.4B | 1.43B |
| EBITDA | 23.9B | -145M |
| EBIT | 17.7B | -163M |
| Net Income | 12.4B | -74M |
| EPS | 4.46 | -0.13 |
| Fiscal Year | 2025 | 2025 |
Income Statement Interpretations
Oracle Corporation
Oracle Corporation shows steady revenue growth from 40.5B in 2021 to 57.4B in 2025, with gross margins remaining strong around 70.5%. Despite a slight decline in net income over the period, the latest fiscal year marked an 8.4% revenue increase and a 9.7% improvement in net margin, indicating operational efficiency gains and robust profitability.
UiPath Inc.
UiPath’s revenue expanded significantly from 607M in 2021 to 1.43B in 2025, accompanied by improved gross margins at 82.7%. The company remains unprofitable with negative EBIT and net margins, though these metrics improved in 2025. Notably, net income grew 20.2% overall, and net margin showed a favorable 25% increase last year, reflecting progress toward profitability.
Which one has the stronger fundamentals?
Oracle exhibits strong and stable profitability with favorable margins and consistent revenue growth, though net income trends are mixed. UiPath shows faster revenue and net income growth with improving margins but remains unprofitable overall. Oracle’s mature and profitable profile contrasts with UiPath’s higher growth yet ongoing losses, reflecting different fundamental strengths and risk profiles.
Financial Ratios Comparison
The table below compares key financial ratios for Oracle Corporation and UiPath Inc. based on their most recent fiscal year data, providing insight into their profitability, liquidity, leverage, and market valuation.
| Ratios | Oracle Corporation (2025) | UiPath Inc. (2025) |
|---|---|---|
| ROE | 60.8% | -4.0% |
| ROIC | 10.9% | -7.4% |
| P/E | 37.1 | -108.0 |
| P/B | 22.6 | 4.3 |
| Current Ratio | 0.75 | 2.93 |
| Quick Ratio | 0.75 | 2.93 |
| D/E | 5.09 | 0.04 |
| Debt-to-Assets | 61.8% | 2.7% |
| Interest Coverage | 4.94 | 0 |
| Asset Turnover | 0.34 | 0.50 |
| Fixed Asset Turnover | 1.32 | 14.41 |
| Payout Ratio | 38.1% | 0% |
| Dividend Yield | 1.03% | 0% |
Interpretation of the Ratios
Oracle Corporation
Oracle’s financial ratios reveal strengths in net margin (21.68%), return on equity (60.84%), and return on invested capital (10.86%), indicating solid profitability and efficient capital use. However, concerns arise from a low current ratio (0.75), high debt levels (D/E 5.09), and elevated valuation multiples (P/E 37.1, P/B 22.57). The company pays dividends with a moderate 1.03% yield, supported by free cash flow, though the payout sustainability may require monitoring due to heavy leverage.
UiPath Inc.
UiPath’s ratios show challenges: negative net margin (-5.15%), return on equity (-3.99%), and return on invested capital (-7.41%), reflecting unprofitable operations and capital inefficiency. Favorable points include a strong liquidity position (current ratio 2.93), low leverage (D/E 0.04), and high fixed asset turnover (14.41). The company does not pay dividends, consistent with its growth phase and reinvestment strategy, focusing on R&D and platform expansion.
Which one has the best ratios?
Comparing both, Oracle exhibits stronger profitability and capital returns but struggles with liquidity and leverage metrics. UiPath’s liquidity and low debt are favorable, yet its negative profitability ratios and absence of dividend returns indicate operational weaknesses. Overall, Oracle’s ratios are more favorable for financial performance, while UiPath reflects typical growth-stage risks with some positive balance sheet attributes.
Strategic Positioning
This section compares the strategic positioning of Oracle Corporation and UiPath Inc., focusing on market position, key segments, and exposure to technological disruption:
Oracle Corporation
- Large market cap of $549B with significant competitive pressure in software infrastructure.
- Revenue driven by Cloud and License Business ($49.2B), Services ($5.2B), and Hardware ($2.9B).
- Exposure to technological disruption through cloud software, autonomous database, and blockchain.
UiPath Inc.
- Smaller market cap of $7.7B, competing in robotic process automation software.
- Revenue primarily from Subscription Services ($802M), License ($587M), and Professional Services.
- Focused on AI-driven automation with RPA platform combining AI, ML, and low-code environments.
Oracle Corporation vs UiPath Inc. Positioning
Oracle exhibits a diversified business model spanning cloud, hardware, and services, providing broad enterprise IT solutions. UiPath concentrates on AI-powered automation software, targeting specific market niches with a focused product suite. Diversification offers resilience; concentration allows specialization.
Which has the best competitive advantage?
Both companies show a slightly unfavorable moat status. Oracle is shedding value with declining profitability, whereas UiPath also destroys value but has improving profitability trends, indicating potential strengthening competitive advantage over time.
Stock Comparison
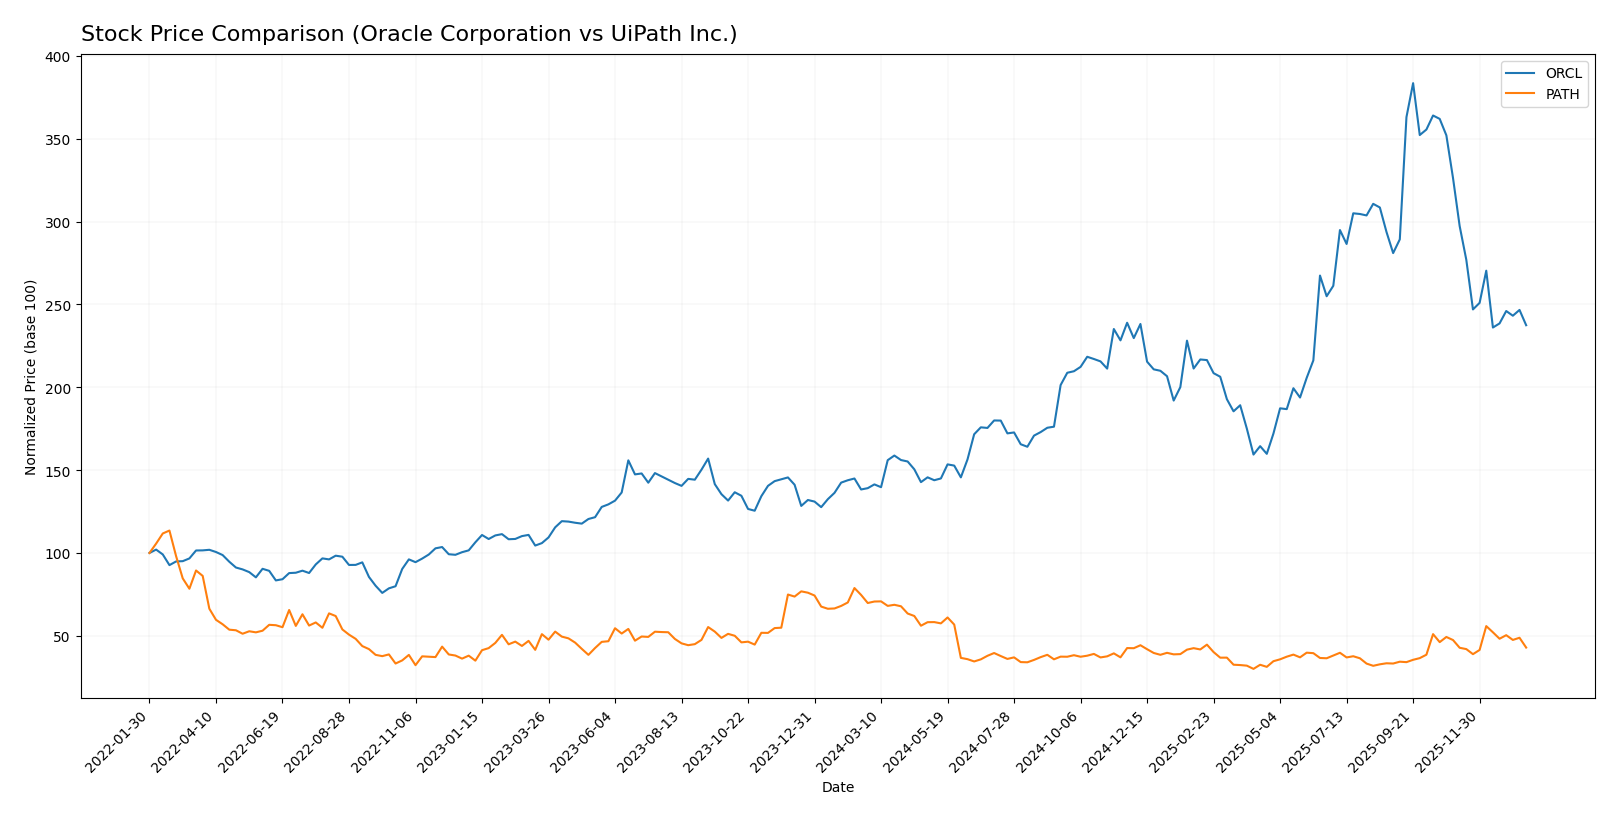
The stock prices of Oracle Corporation and UiPath Inc. over the past year reveal contrasting trajectories, with Oracle showing strong gains despite recent declines, while UiPath has faced sustained downward pressure amid accelerating bearish trends.
Trend Analysis
Oracle Corporation’s stock exhibited a bullish trend with a 70.69% increase over the past 12 months, though recent months show a deceleration and a 27.23% drop, indicating a short-term bearish correction. Volatility remains high with a 49.0 standard deviation.
UiPath Inc.’s stock followed a bearish trend with a 38.53% decrease over the same period, experiencing accelerating downward momentum. Recent performance shows a smaller decline of 9.58% and lower volatility at 3.33 standard deviation.
Comparing both, Oracle delivered the highest market performance over the past year, outperforming UiPath by a significant margin despite recent short-term weakness.
Target Prices
The current analyst consensus provides a clear target price range for both Oracle Corporation and UiPath Inc.
| Company | Target High | Target Low | Consensus |
|---|---|---|---|
| Oracle Corporation | 400 | 175 | 314.08 |
| UiPath Inc. | 19 | 14 | 16.6 |
Analysts expect Oracle’s stock to have significant upside potential, with the consensus target notably above its current price of 191.09 USD. UiPath’s target consensus is slightly above its current price of 14.34 USD, indicating moderate upside expectations.
Analyst Opinions Comparison
This section compares analysts’ ratings and grades for Oracle Corporation and UiPath Inc.:
Rating Comparison
Oracle Corporation Rating
- Rating: B, considered very favorable overall.
- Discounted Cash Flow Score: Moderate with a score of 3.
- ROE Score: Very favorable at 5, indicating strong equity returns.
- ROA Score: Favorable at 4, showing effective asset utilization.
- Debt To Equity Score: Very unfavorable at 1, indicating higher financial risk.
- Overall Score: Moderate with a score of 3.
UiPath Inc. Rating
- Rating: B+, also very favorable overall.
- Discounted Cash Flow Score: Moderate with a score of 3.
- ROE Score: Favorable at 4, showing efficient profit generation.
- ROA Score: Favorable at 4, indicating good use of assets.
- Debt To Equity Score: Favorable at 4, implying stronger balance sheet.
- Overall Score: Moderate with a score of 3.
Which one is the best rated?
UiPath holds a slightly better overall rating (B+) with a more favorable debt-to-equity score, indicating lower financial risk. Oracle has a higher ROE but weaker debt management, making UiPath comparatively better rated based on provided metrics.
Scores Comparison
The comparison of Altman Z-Score and Piotroski Score for Oracle Corporation and UiPath Inc. is as follows:
Oracle Corporation Scores
- Altman Z-Score: 2.43, indicating moderate bankruptcy risk in grey zone.
- Piotroski Score: 5, reflecting average financial strength.
UiPath Inc. Scores
- Altman Z-Score: 5.27, indicating very low bankruptcy risk in safe zone.
- Piotroski Score: 7, reflecting strong financial strength.
Which company has the best scores?
UiPath Inc. exhibits stronger financial health with a safe zone Altman Z-Score and a strong Piotroski Score, compared to Oracle’s moderate and average scores.
Grades Comparison
Here is a detailed comparison of the recent grades assigned to Oracle Corporation and UiPath Inc.:
Oracle Corporation Grades
The table below summarizes the recent grades assigned by various reputable grading companies to Oracle Corporation:
| Grading Company | Action | New Grade | Date |
|---|---|---|---|
| UBS | Maintain | Buy | 2026-01-05 |
| RBC Capital | Maintain | Sector Perform | 2026-01-05 |
| Jefferies | Maintain | Buy | 2026-01-05 |
| Goldman Sachs | Maintain | Neutral | 2025-12-12 |
| Keybanc | Maintain | Overweight | 2025-12-11 |
| UBS | Maintain | Buy | 2025-12-11 |
| Citigroup | Maintain | Buy | 2025-12-11 |
| JP Morgan | Maintain | Neutral | 2025-12-11 |
| DA Davidson | Maintain | Neutral | 2025-12-11 |
| Scotiabank | Maintain | Sector Outperform | 2025-12-11 |
Oracle’s grades show a strong consensus around “Buy” and “Neutral” ratings, with several firms maintaining positive outlooks and no downgrades noted.
UiPath Inc. Grades
The table below summarizes the recent grades assigned by various reputable grading companies to UiPath Inc.:
| Grading Company | Action | New Grade | Date |
|---|---|---|---|
| Barclays | Maintain | Equal Weight | 2026-01-12 |
| RBC Capital | Maintain | Sector Perform | 2026-01-05 |
| RBC Capital | Maintain | Sector Perform | 2025-12-10 |
| Morgan Stanley | Maintain | Equal Weight | 2025-12-09 |
| DA Davidson | Maintain | Neutral | 2025-12-05 |
| Canaccord Genuity | Maintain | Buy | 2025-12-04 |
| Mizuho | Maintain | Neutral | 2025-12-04 |
| RBC Capital | Maintain | Sector Perform | 2025-12-04 |
| Wells Fargo | Maintain | Equal Weight | 2025-12-04 |
| Evercore ISI Group | Maintain | In Line | 2025-12-04 |
UiPath’s grades mostly range from “Neutral” to “Sector Perform” and “Equal Weight,” with only one “Buy” rating, indicating a more cautious consensus compared to Oracle.
Which company has the best grades?
Oracle Corporation has received predominantly “Buy” and “Sector Outperform” grades, reflecting stronger analyst confidence than UiPath Inc., which mostly holds “Neutral” and “Equal Weight” ratings. This divergence may affect investor perceptions of growth potential and risk profiles.
Strengths and Weaknesses
Below is a comparison of key strengths and weaknesses for Oracle Corporation (ORCL) and UiPath Inc. (PATH) based on their latest financial and operational data.
| Criterion | Oracle Corporation (ORCL) | UiPath Inc. (PATH) |
|---|---|---|
| Diversification | Highly diversified with Cloud & License ($49.2B), Services ($5.2B), and Hardware ($2.9B) segments, reducing dependency on a single revenue stream. | Less diversified, mainly focused on Subscription Services ($0.8B) and License ($0.6B), with smaller Professional Services segment. |
| Profitability | Strong profitability: 21.7% net margin, 60.8% ROE, 10.9% ROIC; but concerns with high debt (D/E 5.09) and liquidity ratios below 1. | Currently unprofitable: -5.2% net margin, -4.0% ROE, -7.4% ROIC; however, improving liquidity with high current (2.93) and quick ratios (2.93) and low debt levels. |
| Innovation | Moderate innovation; declining ROIC trend (-17.7%) suggests challenges sustaining competitive advantage. | High innovation potential with strong ROIC growth (+65.1%) despite current value destruction, indicating improving efficiency and market traction. |
| Global presence | Strong presence worldwide with large enterprise customer base and established brand. | Growing global footprint but smaller scale compared to ORCL; still building market presence internationally. |
| Market Share | Leading market share in database and cloud infrastructure sectors; well-established ecosystem. | Niche leader in automation software with growing market share but still emerging against larger incumbents. |
Key takeaways: Oracle offers strong diversification and profitability but faces challenges with declining efficiency and high leverage. UiPath shows promising innovation and liquidity improvements but remains unprofitable with a smaller, less diversified business model. Investors should weigh Oracle’s stability against UiPath’s growth potential and risk profile.
Risk Analysis
Below is a comparison table outlining key risk factors for Oracle Corporation and UiPath Inc. based on the most recent 2025 data.
| Metric | Oracle Corporation (ORCL) | UiPath Inc. (PATH) |
|---|---|---|
| Market Risk | Beta 1.65 (high volatility) | Beta 1.08 (moderate volatility) |
| Debt level | High leverage: D/E 5.09, Debt-to-assets 61.83% (unfavorable) | Low leverage: D/E 0.04, Debt-to-assets 2.72% (favorable) |
| Regulatory Risk | Moderate, large global footprint | Moderate, with exposure in US, Romania, Japan |
| Operational Risk | Large scale, complex integration risks | Smaller scale, rapid innovation cycle risks |
| Environmental Risk | Moderate, hardware manufacturing impact | Low, software-centric business |
| Geopolitical Risk | Moderate, global customer base | Moderate, exposure in multiple regions |
Oracle’s greatest risks stem from its high debt levels and market volatility, with a beta of 1.65 indicating sensitivity to market swings. UiPath benefits from low financial leverage but faces operational risks typical of fast-growing software firms. Oracle’s Altman Z-score in the grey zone signals moderate financial distress risk, while UiPath’s safe zone score suggests stronger financial stability. Investors should weigh Oracle’s financial risk against its scale and UiPath’s growth potential balanced by profitability challenges.
Which Stock to Choose?
Oracle Corporation (ORCL) shows a favorable income evolution with 8.38% revenue growth in the last year and a strong profitability reflected by a 21.68% net margin and 60.84% ROE. However, it faces unfavorable financial ratios in leverage and liquidity, with a net debt to EBITDA near 3.9 and a current ratio below 1. Its overall rating is very favorable (B), despite a slightly unfavorable economic moat due to declining ROIC.
UiPath Inc. (PATH) also demonstrates favorable income growth, with a 9.3% revenue increase and positive net income growth of 20.24% over five years. Its financial ratios are mixed, with strong liquidity and low debt but negative profitability ratios and an unfavorable interest coverage ratio. PATH holds a very favorable rating (B+) and a slightly unfavorable moat, though with improving ROIC trends.
Considering ratings and income evaluations, ORCL might appear more stable in profitability but carries higher debt and a declining moat, while PATH shows growth potential and stronger liquidity but sustained losses and a less consistent profit profile. Investors prioritizing stability and profitability may find ORCL more aligned with their profile, whereas those focused on growth and improving fundamentals might see PATH as more favorable.
Disclaimer: Investment carries a risk of loss of initial capital. The past performance is not a reliable indicator of future results. Be sure to understand risks before making an investment decision.
Go Further
I encourage you to read the complete analyses of Oracle Corporation and UiPath Inc. to enhance your investment decisions: