In the fast-evolving technology sector, Oracle Corporation and Teradata Corporation stand out as key players in software infrastructure. Both specialize in cloud-based data solutions, but they differ in scale, innovation strategies, and market focus. Oracle’s expansive cloud ecosystem contrasts with Teradata’s multi-cloud analytics platform, making this comparison essential. Join me as we analyze which company holds the most promise for a savvy investor’s portfolio in 2026.

Table of contents
Companies Overview
I will begin the comparison between Oracle Corporation and Teradata Corporation by providing an overview of these two companies and their main differences.
Oracle Overview
Oracle Corporation offers a broad range of enterprise IT products and services worldwide, focusing on cloud software applications such as ERP, human capital management, and industry-specific solutions. It also provides infrastructure technologies including its renowned Oracle Database, Java platform, and middleware, alongside hardware products and consulting services. Headquartered in Austin, Texas, Oracle is a major player in the technology sector with a market cap of 549B USD and 159K employees.
Teradata Overview
Teradata Corporation specializes in connected multi-cloud data platforms designed for enterprise analytics, providing the Teradata Vantage platform to integrate and analyze data across enterprises. The company supports clients with consulting services, migration to cloud ecosystems, and maintenance, serving sectors like financial services, healthcare, and telecommunications. Based in San Diego, California, Teradata has a market cap of 2.8B USD and employs about 5.7K people.
Key similarities and differences
Both Oracle and Teradata operate within the software infrastructure industry, delivering enterprise-level technology solutions focused on data management and cloud services. Oracle’s business model is broader, spanning software applications, infrastructure, hardware, and consulting, with a significant global presence and workforce. Teradata, by contrast, concentrates on multi-cloud data platforms and analytics with a more specialized, consultative approach and a smaller scale in market cap and employee base.
Income Statement Comparison
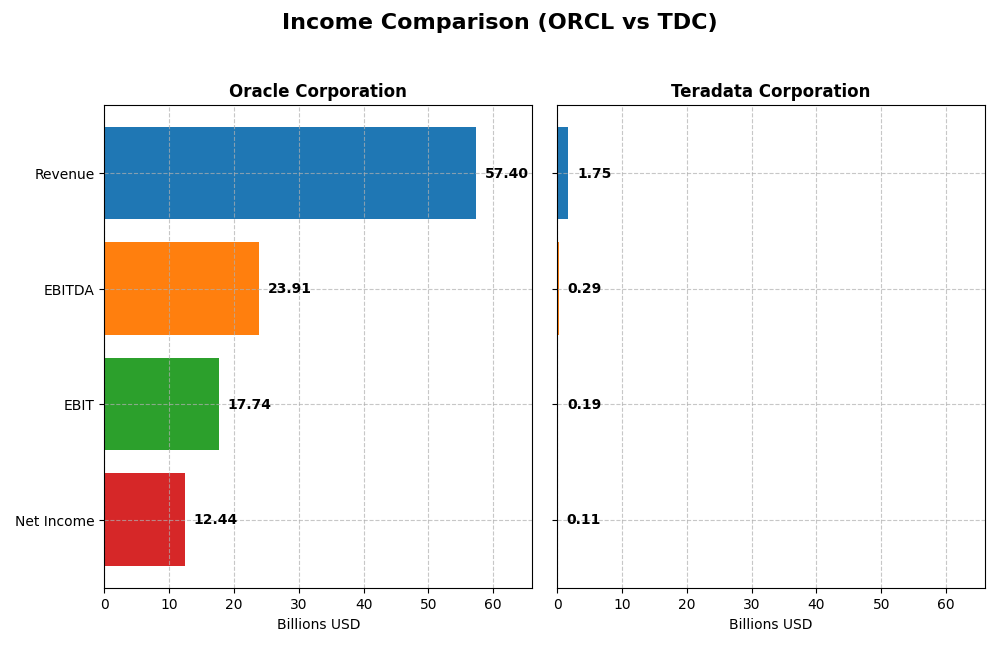
This table compares key income statement metrics for Oracle Corporation and Teradata Corporation for their latest fiscal years, providing a snapshot of their financial performance.
| Metric | Oracle Corporation | Teradata Corporation |
|---|---|---|
| Market Cap | 549B | 2.8B |
| Revenue | 57.4B | 1.75B |
| EBITDA | 23.9B | 293M |
| EBIT | 17.7B | 193M |
| Net Income | 12.4B | 114M |
| EPS | 4.46 | 1.18 |
| Fiscal Year | 2025 | 2024 |
Income Statement Interpretations
Oracle Corporation
Oracle’s revenue shows a strong upward trend, growing 41.8% from 2021 to 2025, reaching $57.4B in 2025. Net income, however, declined overall by 9.5%, despite a recent increase to $12.4B in 2025. Margins remain robust with a gross margin of 70.5% and a net margin of 21.7%. The latest year saw favorable growth in revenue and profitability, with EPS up 17%, indicating improved operational efficiency.
Teradata Corporation
Teradata’s revenue declined slightly by 4.7% over 2020–2024, with 2024 revenue at $1.75B. Net income also fell 11.6% during the period but showed a recovery to $114M in 2024. Margins are lower than Oracle’s, with a gross margin of 60.5% and net margin of 6.5%. Despite recent top-line contraction, the company improved net margin and EPS substantially in the latest year, reflecting better cost control and profitability.
Which one has the stronger fundamentals?
Oracle demonstrates stronger fundamentals with significantly higher revenue, profitability, and margins, alongside consistent revenue growth and solid operating metrics. Teradata, while improving profitability metrics recently, faces declining revenues and lower margin levels. Both companies have a favorable income statement outlook, but Oracle’s scale and margin performance provide a more robust fundamental profile.
Financial Ratios Comparison
This table presents the most recent key financial ratios for Oracle Corporation and Teradata Corporation, enabling a straightforward comparison of their financial performance and position as of their latest fiscal years.
| Ratios | Oracle Corporation (2025) | Teradata Corporation (2024) |
|---|---|---|
| ROE | 60.8% | 85.7% |
| ROIC | 10.9% | 16.9% |
| P/E | 37.1 | 26.3 |
| P/B | 22.6 | 22.6 |
| Current Ratio | 0.75 | 0.81 |
| Quick Ratio | 0.75 | 0.79 |
| D/E (Debt-to-Equity) | 5.09 | 4.33 |
| Debt-to-Assets | 61.8% | 33.8% |
| Interest Coverage | 4.94 | 7.21 |
| Asset Turnover | 0.34 | 1.03 |
| Fixed Asset Turnover | 1.32 | 9.07 |
| Payout ratio | 38.1% | 0% |
| Dividend yield | 1.03% | 0% |
Interpretation of the Ratios
Oracle Corporation
Oracle shows strong profitability with a favorable net margin of 21.68% and an impressive return on equity at 60.84%. However, its high price-to-earnings ratio of 37.1, weak liquidity ratios around 0.75, and significant leverage with a debt-to-assets ratio of 61.83% raise concerns. Oracle pays dividends, offering a 1.03% yield with a stable payout, but free cash flow coverage is currently negative, posing sustainability risks.
Teradata Corporation
Teradata displays mixed financial strength, with a moderate net margin of 6.51% and excellent returns on equity (85.71%) and invested capital (16.89%). It benefits from a lower weighted average cost of capital at 5.85% and strong asset turnover ratios above 1. However, liquidity remains weak with a current ratio of 0.81. Teradata does not pay dividends, likely prioritizing reinvestment and growth initiatives given its high free cash flow yield.
Which one has the best ratios?
Comparing the two, Teradata has a more balanced ratio profile with several favorable metrics such as lower WACC, better asset efficiency, and strong returns, despite a weaker net margin. Oracle excels in profitability but suffers from high leverage, poor liquidity, and valuation concerns. Overall, Teradata’s ratios suggest a more neutral financial position, whereas Oracle’s are viewed as unfavorable.
Strategic Positioning
This section compares the strategic positioning of Oracle and Teradata, focusing on market position, key segments, and exposure to technological disruption:
Oracle Corporation
- Large market cap of 549B, faces significant competition in software infrastructure sector.
- Diverse revenue streams: cloud and license (49.2B), hardware (2.9B), services (5.2B).
- Invests in cloud infrastructure technologies, autonomous database, and blockchain.
Teradata Corporation
- Smaller market cap of 2.8B, operates in niche enterprise analytics market.
- Mainly multi-cloud analytics platform and consulting services with recurring revenues.
- Focused on connected multi-cloud data platform, analytics, and migration support.
Oracle Corporation vs Teradata Corporation Positioning
Oracle pursues a diversified business model spanning cloud, hardware, and services, providing broad market exposure but facing intense competition. Teradata concentrates on multi-cloud analytics and consulting, allowing specialization but limiting scale compared to Oracle.
Which has the best competitive advantage?
Teradata shows a very favorable moat with growing ROIC and durable competitive advantage, while Oracle’s slightly unfavorable moat reflects declining profitability and value shedding over recent years.
Stock Comparison
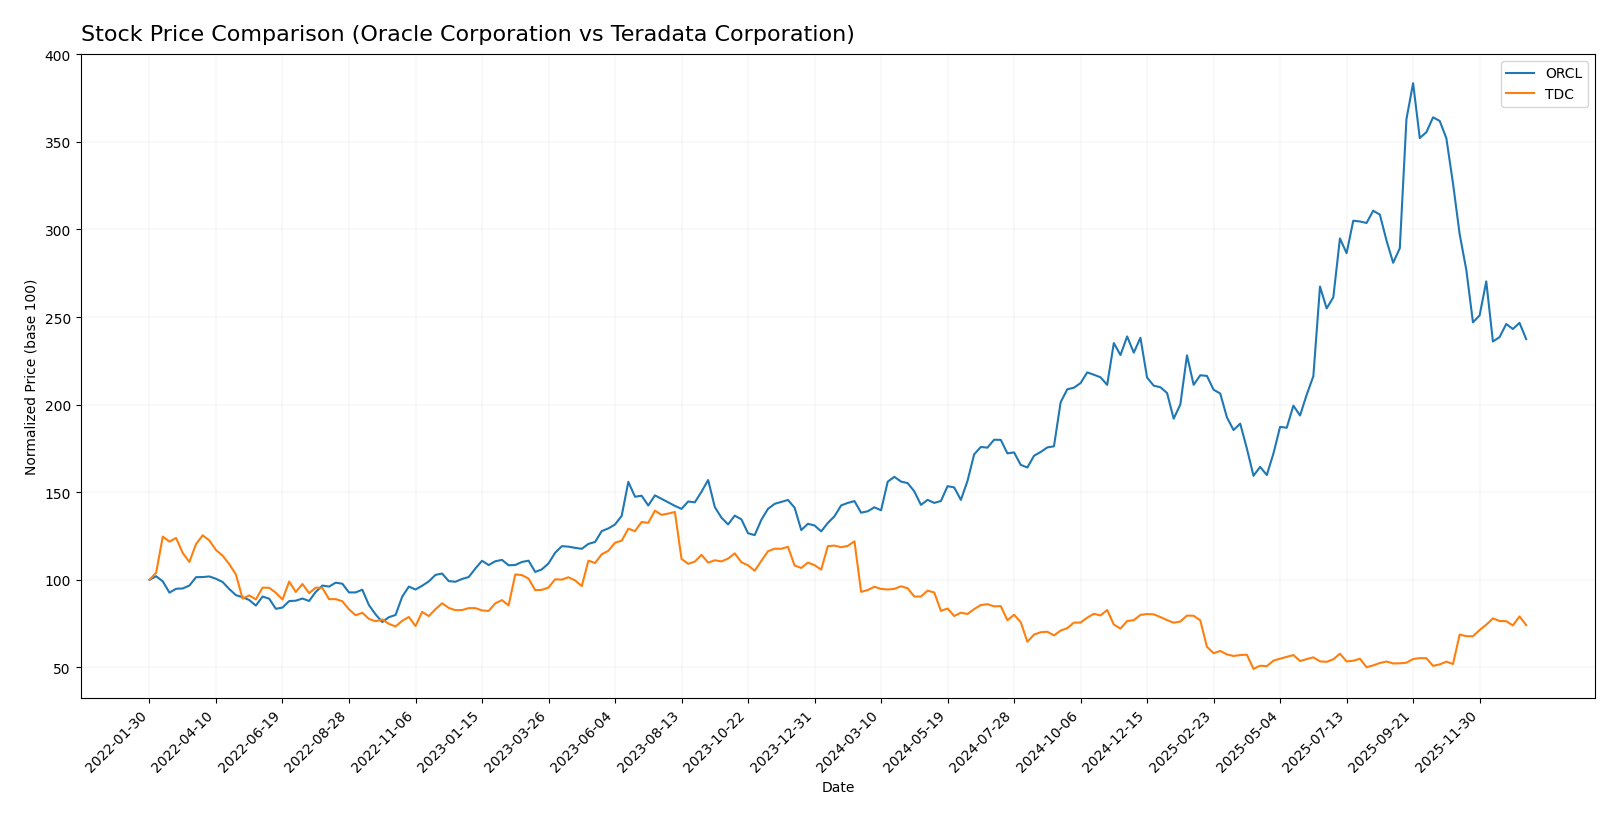
The stock price movements of Oracle Corporation and Teradata Corporation over the past 12 months reveal contrasting trends, with Oracle showing strong gains yet recent declines, while Teradata exhibits a prolonged downtrend offset by a recent uptick.
Trend Analysis
Oracle Corporation’s stock posted a bullish trend over the past year with a 70.69% gain, despite deceleration and high volatility (49.0 std deviation). A recent 27.23% decline indicates short-term weakness. Teradata Corporation experienced a bearish trend with a 21.26% loss over the year, though acceleration and a recent 42.78% rise suggest emerging positive momentum. Its volatility remains low at 5.63. Comparatively, Oracle delivered the highest market performance overall, despite recent pullbacks, surpassing Teradata’s prolonged negative trend with a significant total gain.
Target Prices
Analysts present a clear consensus on target prices for Oracle Corporation and Teradata Corporation.
| Company | Target High | Target Low | Consensus |
|---|---|---|---|
| Oracle Corporation | 400 | 175 | 314.08 |
| Teradata Corporation | 35 | 27 | 31 |
Oracle’s consensus target price of 314.08 significantly exceeds its current price of 191.09, indicating expectations of strong upside potential. Teradata’s target consensus at 31 is slightly above its current price of 29.77, suggesting modest growth anticipated by analysts.
Analyst Opinions Comparison
This section compares analysts’ ratings and financial scores for Oracle Corporation and Teradata Corporation:
Rating Comparison
Oracle Corporation Rating
- Rating: B, assessed as Very Favorable by analysts.
- Discounted Cash Flow Score: 3, indicating a Moderate valuation.
- ROE Score: 5, reflecting Very Favorable profitability.
- ROA Score: 4, rated Favorable for asset efficiency.
- Debt To Equity Score: 1, marked as Very Unfavorable risk.
- Overall Score: 3, a Moderate overall financial standing.
Teradata Corporation Rating
- Rating: B+, also considered Very Favorable.
- Discounted Cash Flow Score: 4, seen as Favorable.
- ROE Score: 5, equally Very Favorable.
- ROA Score: 4, also Favorable.
- Debt To Equity Score: 1, similarly Very Unfavorable.
- Overall Score: 3, likewise Moderate.
Which one is the best rated?
Teradata holds a slightly higher rating (B+) compared to Oracle’s B, supported by a better discounted cash flow score. Both share identical scores in profitability, asset use, financial risk, and overall rating, making Teradata marginally better rated based on the given data.
Scores Comparison
Here is a comparison of the Altman Z-Score and Piotroski Score for Oracle Corporation and Teradata Corporation:
Oracle Corporation Scores
- Altman Z-Score: 2.43, indicating moderate bankruptcy risk in the grey zone.
- Piotroski Score: 5, reflecting average financial strength.
Teradata Corporation Scores
- Altman Z-Score: 0.81, indicating high bankruptcy risk in the distress zone.
- Piotroski Score: 8, reflecting very strong financial strength.
Which company has the best scores?
Teradata has a lower Altman Z-Score, signaling higher bankruptcy risk, but a much stronger Piotroski Score. Oracle’s scores show moderate bankruptcy risk and average financial strength. The best scores depend on which metric investors prioritize.
Grades Comparison
The following presents a detailed comparison of the latest available grades for Oracle Corporation and Teradata Corporation:
Oracle Corporation Grades
This table summarizes recent grades assigned to Oracle Corporation by reputable grading companies.
| Grading Company | Action | New Grade | Date |
|---|---|---|---|
| UBS | Maintain | Buy | 2026-01-05 |
| RBC Capital | Maintain | Sector Perform | 2026-01-05 |
| Jefferies | Maintain | Buy | 2026-01-05 |
| Goldman Sachs | Maintain | Neutral | 2025-12-12 |
| Keybanc | Maintain | Overweight | 2025-12-11 |
| UBS | Maintain | Buy | 2025-12-11 |
| Citigroup | Maintain | Buy | 2025-12-11 |
| JP Morgan | Maintain | Neutral | 2025-12-11 |
| DA Davidson | Maintain | Neutral | 2025-12-11 |
| Scotiabank | Maintain | Sector Outperform | 2025-12-11 |
Oracle’s grades mostly indicate a positive outlook, with several “Buy” and “Overweight” ratings alongside “Neutral” and “Sector Perform” assessments, reflecting moderate to strong investor confidence.
Teradata Corporation Grades
This table provides recent grades assigned to Teradata Corporation by recognized grading firms.
| Grading Company | Action | New Grade | Date |
|---|---|---|---|
| Barclays | Maintain | Underweight | 2026-01-12 |
| RBC Capital | Maintain | Sector Perform | 2026-01-05 |
| Morgan Stanley | Maintain | Overweight | 2025-12-17 |
| Citizens | Upgrade | Market Outperform | 2025-11-10 |
| Barclays | Maintain | Underweight | 2025-11-05 |
| TD Cowen | Maintain | Hold | 2025-11-05 |
| Evercore ISI Group | Maintain | Outperform | 2025-11-05 |
| UBS | Maintain | Neutral | 2025-08-06 |
| Guggenheim | Maintain | Buy | 2025-05-07 |
| Barclays | Maintain | Underweight | 2025-04-21 |
Teradata’s grades show a mixed picture with several “Underweight” ratings balanced by “Overweight,” “Outperform,” and “Buy” grades, indicating varied analyst sentiment.
Which company has the best grades?
Oracle Corporation has received generally stronger and more consistent grades, mostly centered on “Buy” and “Overweight” ratings, while Teradata shows more mixed evaluations with notable “Underweight” ratings. This suggests Oracle may be viewed as a relatively more favorable investment option, potentially implying lower perceived risk and higher confidence among analysts.
Strengths and Weaknesses
Below is a comparison of key strengths and weaknesses for Oracle Corporation (ORCL) and Teradata Corporation (TDC) based on the latest financial and operational data.
| Criterion | Oracle Corporation (ORCL) | Teradata Corporation (TDC) |
|---|---|---|
| Diversification | High: Cloud & License $49.2B, Services $5.2B, Hardware $2.9B | Moderate: Recurring Products & Services $2.66B, Consulting $248M |
| Profitability | High net margin (21.7%), ROIC 10.9%, but declining ROIC trend | Moderate net margin (6.5%), high ROIC (16.9%) with strong growth |
| Innovation | Strong cloud and software portfolio, but slowing value creation | Focused on data analytics and recurring software, showing durable advantage |
| Global presence | Extensive global reach with diversified revenue streams | Growing international presence but less diversified than Oracle |
| Market Share | Large market share in enterprise software and cloud | Niche player with growing share in analytics and data services |
Oracle’s strengths lie in its diversification and strong profitability metrics despite a recent decline in ROIC, signaling caution. Teradata shows impressive ROIC growth and a durable competitive advantage but operates on a smaller scale with less diversification. Both companies have risks, but Teradata’s improving profitability trend may offer more growth potential.
Risk Analysis
The table below summarizes key risks for Oracle Corporation and Teradata Corporation based on their most recent financial and operational data.
| Metric | Oracle Corporation (ORCL) | Teradata Corporation (TDC) |
|---|---|---|
| Market Risk | High beta (1.65) implies greater stock volatility and market sensitivity. | Lower beta (0.57) suggests lower market volatility risk. |
| Debt level | High debt-to-assets ratio (61.8%), debt-to-equity unfavorable (5.09). | Moderate debt-to-assets (33.8%), debt-to-equity also unfavorable (4.33). |
| Regulatory Risk | Moderate, due to global operations and software industry compliance. | Moderate, with global clientele and data privacy regulations. |
| Operational Risk | Large scale with 159K employees; complexity in cloud and software services. | Smaller scale (5.7K employees), but reliant on cloud migration success. |
| Environmental Risk | Moderate; hardware production and data centers impact. | Low to moderate; mainly software and cloud services. |
| Geopolitical Risk | Exposure due to global sales and supply chains. | Exposure mainly in Americas, Europe, Asia-Pacific regions. |
Oracle faces higher market risk due to its elevated beta and significant leverage, which may impact stability in volatile markets. Teradata’s lower beta and moderate debt suggest less market risk but still notable leverage concerns. Both companies operate in regulated environments with operational complexities. Oracle’s financial distress risk is moderate (Altman Z-score ~2.43), while Teradata is at higher risk (Altman Z-score ~0.81). Investors should weigh Oracle’s market sensitivity and leverage against Teradata’s financial distress potential and smaller scale.
Which Stock to Choose?
Oracle Corporation (ORCL) shows favorable income growth with an 8.38% revenue increase in 2025 and strong profitability metrics, including a 21.68% net margin and 60.84% ROE. However, financial ratios reveal high debt levels and several unfavorable liquidity and valuation metrics, resulting in a slightly unfavorable MOAT due to declining ROIC and a moderate overall rating.
Teradata Corporation (TDC) presents mixed income trends, with a slight revenue decline over the long term but favorable EBIT and net margin growth in 2024. Its financial ratios indicate stronger capital efficiency and lower WACC than ORCL, supported by a very favorable MOAT with growing ROIC, although some liquidity and valuation ratios remain unfavorable. Ratings are very favorable with a strong Piotroski Score but a distress zone Altman Z-Score.
For investors prioritizing durable competitive advantages and improving profitability, TDC’s very favorable MOAT and capital efficiency might appear attractive. Conversely, those focused on revenue growth and established profitability could find ORCL’s strong income growth and stable margins more indicative, despite its higher leverage and less favorable ratios. The choice may depend on the investor’s risk tolerance and strategy emphasis.
Disclaimer: Investment carries a risk of loss of initial capital. The past performance is not a reliable indicator of future results. Be sure to understand risks before making an investment decision.
Go Further
I encourage you to read the complete analyses of Oracle Corporation and Teradata Corporation to enhance your investment decisions: