In the rapidly evolving software infrastructure industry, Oracle Corporation and Synopsys, Inc. stand out as influential players shaping enterprise technology. Oracle excels in cloud applications and database solutions, while Synopsys leads in electronic design automation and security testing. Both companies innovate to meet diverse market needs, making their comparison essential for investors seeking growth and stability. Join me as we explore which stock holds greater promise for your portfolio.
Table of contents
Companies Overview
I will begin the comparison between Oracle Corporation and Synopsys, Inc. by providing an overview of these two companies and their main differences.
Oracle Overview
Oracle Corporation focuses on enterprise information technology environments worldwide, offering cloud software applications such as ERP, supply chain, human capital management, and marketing platforms. It also provides infrastructure technologies including Oracle Database, Java, and middleware, alongside hardware products and consulting services. Headquartered in Austin, Texas, Oracle is a major player in software infrastructure with a market cap of $549B and over 159K employees.
Synopsys Overview
Synopsys, Inc. specializes in electronic design automation software for integrated circuits, offering platforms for digital design, verification, FPGA design, and intellectual property solutions. It provides tools for SoC architecture, security testing, and manufacturing solutions, serving industries like electronics, automotive, and finance. Based in Mountain View, California, Synopsys has a market cap of $98.7B and employs around 20K people.
Key similarities and differences
Both Oracle and Synopsys operate within the software infrastructure sector, focusing on advanced software solutions for complex technical environments. Oracle primarily targets enterprise IT with broad cloud and hardware offerings, while Synopsys concentrates on semiconductor design automation and IP solutions. Oracle’s scale and employee base are substantially larger, reflecting its diversified product scope versus Synopsys’s specialized niche in electronic design and verification.
Income Statement Comparison
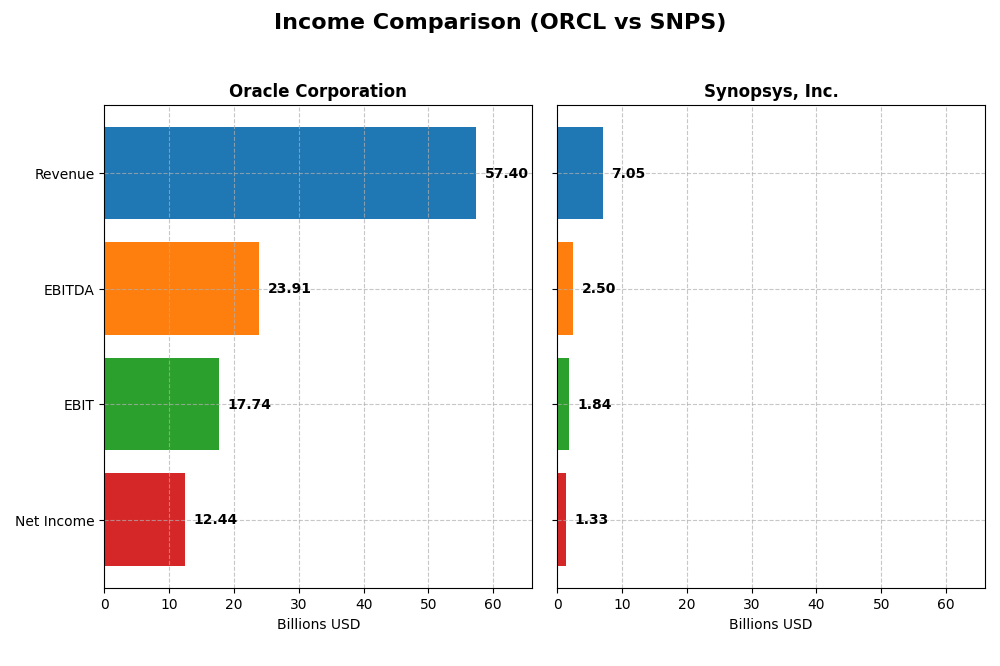
The table below compares key income statement metrics for Oracle Corporation and Synopsys, Inc. for the most recent fiscal year 2025.
| Metric | Oracle Corporation | Synopsys, Inc. |
|---|---|---|
| Market Cap | 549B | 99B |
| Revenue | 57.4B | 7.1B |
| EBITDA | 23.9B | 2.5B |
| EBIT | 17.7B | 1.8B |
| Net Income | 12.4B | 1.3B |
| EPS | 4.46 | 8.13 |
| Fiscal Year | 2025 | 2025 |
Income Statement Interpretations
Oracle Corporation
Oracle’s revenue consistently increased from $40.5B in 2021 to $57.4B in 2025, showing a strong growth trajectory. Net income, however, declined over the overall period but rebounded to $12.4B in 2025. Margins remained robust, with a favorable gross margin of 70.5% and a net margin of 21.7% in 2025, reflecting improved profitability and operational efficiency in the latest fiscal year.
Synopsys, Inc.
Synopsys demonstrated impressive revenue growth from $4.2B in 2021 to $7.1B in 2025, alongside a solid increase in net income, reaching $1.33B in 2025. The company maintained a strong gross margin near 77% and a net margin close to 19% in 2025. Despite favorable revenue and EBIT growth, net margin and EPS declined significantly in the most recent year, indicating some margin pressure.
Which one has the stronger fundamentals?
Both companies exhibit favorable income statement fundamentals, with Oracle showing stability in margins and strong recent profitability growth, while Synopsys delivers higher overall revenue and net income growth. Oracle’s margin improvements contrast with Synopsys’s net margin and EPS declines in the last year. Overall, Oracle’s consistent margin strength and recent earnings rebound suggest solid fundamentals balanced against Synopsys’s faster growth but recent margin challenges.
Financial Ratios Comparison
The table below presents the most recent key financial ratios for Oracle Corporation and Synopsys, Inc. to facilitate a clear comparison of their financial performance and position as of the fiscal year 2025.
| Ratios | Oracle Corporation (2025) | Synopsys, Inc. (2025) |
|---|---|---|
| ROE | 60.8% | 4.7% |
| ROIC | 10.9% | 2.0% |
| P/E | 37.1 | 54.4 |
| P/B | 22.6 | 2.57 |
| Current Ratio | 0.75 | 1.62 |
| Quick Ratio | 0.75 | 1.52 |
| D/E (Debt-to-Equity) | 5.09 | 0.50 |
| Debt-to-Assets | 61.8% | 29.6% |
| Interest Coverage | 4.94 | 2.05 |
| Asset Turnover | 0.34 | 0.15 |
| Fixed Asset Turnover | 1.32 | 5.04 |
| Payout Ratio | 38.1% | 0% |
| Dividend Yield | 1.03% | 0% |
Interpretation of the Ratios
Oracle Corporation
Oracle shows strong profitability ratios, with a net margin of 21.68% and an exceptional return on equity at 60.84%, indicating efficient capital use. However, concerns arise from unfavorable liquidity ratios, a high debt-to-equity ratio of 5.09, and elevated valuation multiples such as a PE of 37.1. Oracle pays a dividend with a 1.03% yield, which is covered moderately by free cash flow, but high leverage poses risks for sustained payouts.
Synopsys, Inc.
Synopsys presents mixed results, with a favorable net margin of 18.96% but weaker returns on equity (4.72%) and invested capital (1.97%). It benefits from solid liquidity metrics, including a current ratio of 1.62 and a low debt-to-assets ratio at 29.64%. The company does not pay dividends, likely prioritizing reinvestment and R&D given its high research-to-revenue ratio of 35%, with no share buybacks indicated.
Which one has the best ratios?
Synopsys holds a more balanced profile with favorable liquidity and moderate leverage, supporting operational stability. Oracle excels in profitability and return metrics but carries significant financial risks from high leverage and weak liquidity. Overall, Synopsys’s neutral global rating contrasts with Oracle’s unfavorable one, reflecting a more cautious financial position despite lower profitability.
Strategic Positioning
This section compares the strategic positioning of Oracle Corporation and Synopsys, Inc. regarding Market position, Key segments, and Exposure to technological disruption:
Oracle Corporation
- Large market cap of 549B, facing competitive pressure in software infrastructure and cloud services.
- Focuses on cloud and license business (49B), hardware (2.9B), and services (5.2B) as key revenue drivers.
- Exposure includes cloud computing, autonomous databases, IoT, blockchain, and middleware technologies.
Synopsys, Inc.
- Smaller market cap of 99B, competing in electronic design automation software with moderate pressure.
- Concentrates on license and maintenance (3.5B), technology services (1.5B), and IP products.
- Exposure to disruption via advanced semiconductor design tools, IP solutions, virtual prototyping, security.
Oracle vs Synopsys Positioning
Oracle demonstrates a diversified approach across cloud, hardware, and services, offering broad industry solutions, while Synopsys focuses on specialized electronic design automation and IP products, reflecting a more concentrated business model with niche technological expertise.
Which has the best competitive advantage?
Both companies are shedding value with declining ROIC trends; Oracle’s moat is slightly unfavorable, while Synopsys faces a very unfavorable moat, indicating Oracle currently holds a relatively stronger competitive position.
Stock Comparison
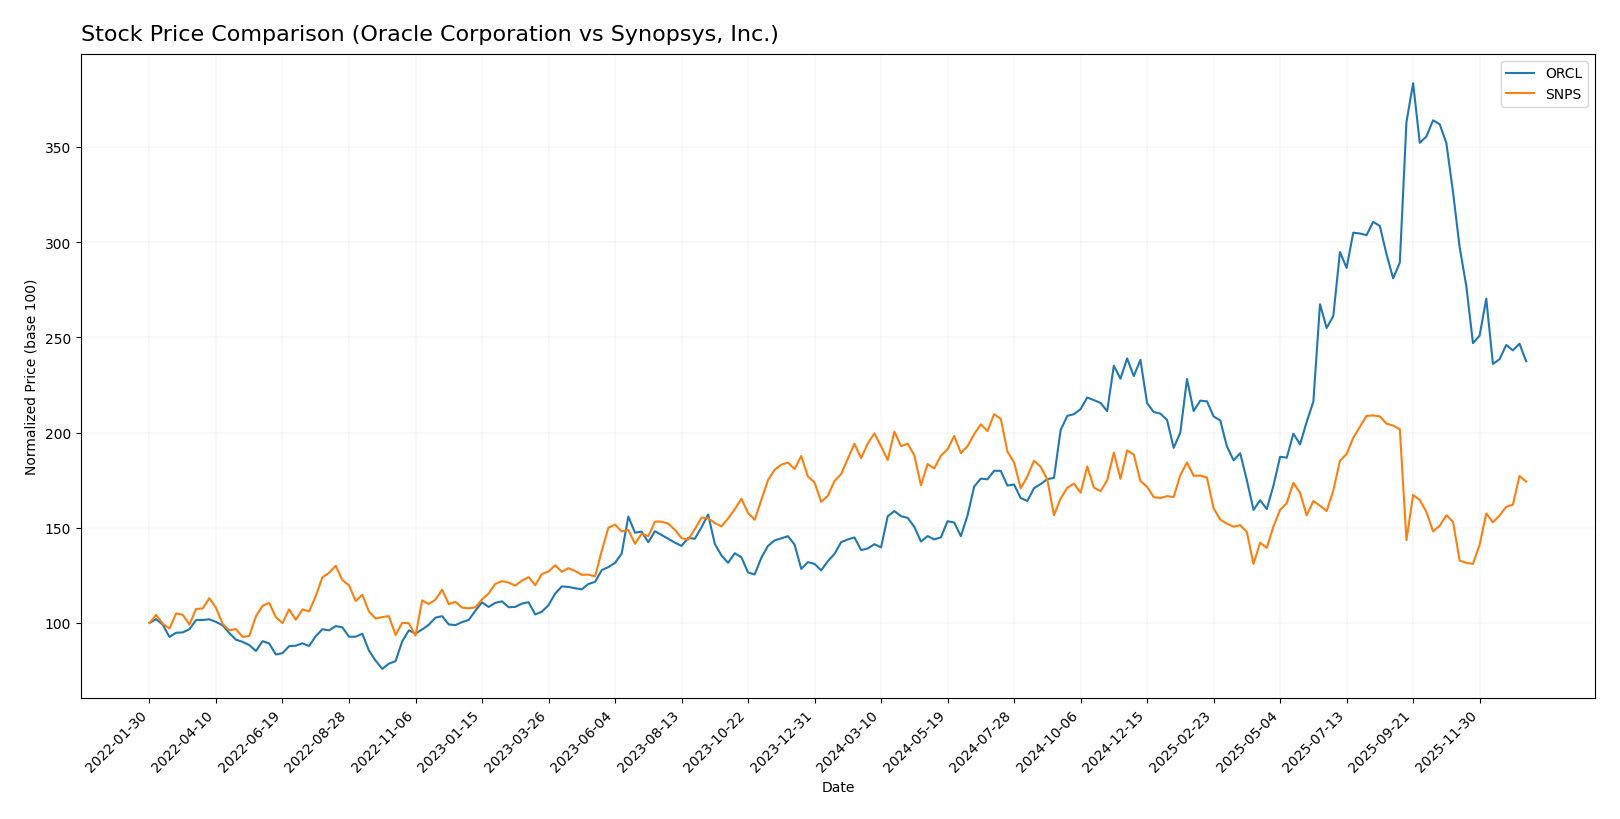
The past year showed marked divergence in price dynamics between Oracle Corporation and Synopsys, Inc., with Oracle experiencing a strong overall advance despite recent pullbacks, while Synopsys faced sustained declines offset by a recent rebound.
Trend Analysis
Oracle Corporation’s stock exhibited a bullish trend over the past 12 months, gaining 70.69%. The price range spanned from a low of 111.95 to a high of 308.66, with deceleration in upward momentum and a notable recent decline of -27.23% over the last quarter.
Synopsys, Inc. showed a bearish trend over the same 12-month period, with a -10.31% drop despite accelerating decline momentum. The stock fluctuated between 388.13 and 621.3, recently rebounding by 13.77% in the last quarter.
Comparing performances, Oracle delivered the highest market gains overall with a strong positive trend, while Synopsys underperformed but showed signs of recovery in recent weeks.
Target Prices
Analyst consensus presents optimistic target prices for Oracle Corporation and Synopsys, Inc.
| Company | Target High | Target Low | Consensus |
|---|---|---|---|
| Oracle Corporation | 400 | 175 | 314.08 |
| Synopsys, Inc. | 600 | 425 | 530 |
The target consensus for Oracle at 314.08 is significantly above its current price of 191.09, indicating potential upside. Synopsys shows a strong consensus target of 530 compared to its current price of 516.31, suggesting modest growth expectations.
Analyst Opinions Comparison
This section compares analysts’ ratings and grades for Oracle Corporation and Synopsys, Inc.:
Rating Comparison
Oracle Corporation Rating
- Rating: B, considered Very Favorable overall
- Discounted Cash Flow Score: Moderate at 3
- ROE Score: Very Favorable at 5
- ROA Score: Favorable at 4
- Debt To Equity Score: Very Unfavorable at 1
- Overall Score: Moderate at 3
Synopsys, Inc. Rating
- Rating: B-, also rated Very Favorable
- Discounted Cash Flow Score: Moderate at 3
- ROE Score: Moderate at 3
- ROA Score: Moderate at 3
- Debt To Equity Score: Moderate at 2
- Overall Score: Moderate at 3
Which one is the best rated?
Oracle holds a higher ROE and ROA score, signaling stronger profitability and asset utilization, despite a weaker debt-to-equity score. Synopsys has a slightly lower rating and better debt-to-equity balance. Overall, Oracle is better rated based on these key financial metrics.
Scores Comparison
The scores comparison between Oracle Corporation and Synopsys, Inc. is as follows:
ORCL Scores
- Altman Z-Score of 2.43 places Oracle in the grey zone, indicating moderate bankruptcy risk.
- Piotroski Score of 5 reflects Oracle’s average financial strength and investment quality.
SNPS Scores
- Altman Z-Score of 3.54 places Synopsys in the safe zone, indicating low bankruptcy risk.
- Piotroski Score of 4 reflects Synopsys’s average financial strength and investment quality.
Which company has the best scores?
Based strictly on the provided data, Synopsys has a better Altman Z-Score, indicating stronger financial stability, while both companies have similar average Piotroski Scores. Overall, Synopsys shows a safer financial position.
Grades Comparison
Here is a detailed comparison of recent grades assigned to Oracle Corporation and Synopsys, Inc.:
Oracle Corporation Grades
This table summarizes recent grade actions from notable grading companies for Oracle Corporation:
| Grading Company | Action | New Grade | Date |
|---|---|---|---|
| UBS | Maintain | Buy | 2026-01-05 |
| RBC Capital | Maintain | Sector Perform | 2026-01-05 |
| Jefferies | Maintain | Buy | 2026-01-05 |
| Goldman Sachs | Maintain | Neutral | 2025-12-12 |
| Keybanc | Maintain | Overweight | 2025-12-11 |
| UBS | Maintain | Buy | 2025-12-11 |
| Citigroup | Maintain | Buy | 2025-12-11 |
| JP Morgan | Maintain | Neutral | 2025-12-11 |
| DA Davidson | Maintain | Neutral | 2025-12-11 |
| Scotiabank | Maintain | Sector Outperform | 2025-12-11 |
Oracle’s grades mostly indicate a stable “Buy” consensus with some “Neutral” and “Sector Perform” ratings, reflecting moderate confidence in its stock.
Synopsys, Inc. Grades
Below is a summary of recent grade actions from recognized grading firms for Synopsys, Inc.:
| Grading Company | Action | New Grade | Date |
|---|---|---|---|
| Piper Sandler | Downgrade | Neutral | 2026-01-13 |
| Morgan Stanley | Maintain | Overweight | 2025-12-12 |
| Rosenblatt | Maintain | Buy | 2025-12-11 |
| Keybanc | Maintain | Overweight | 2025-12-11 |
| Piper Sandler | Maintain | Overweight | 2025-12-11 |
| Needham | Maintain | Buy | 2025-12-11 |
| B of A Securities | Upgrade | Buy | 2025-12-11 |
| JP Morgan | Maintain | Overweight | 2025-12-11 |
| Wells Fargo | Maintain | Equal Weight | 2025-12-11 |
| Rosenblatt | Upgrade | Buy | 2025-12-09 |
Synopsys shows a strong “Buy” and “Overweight” bias, despite a recent downgrade to “Neutral” by Piper Sandler, indicating mixed but generally positive sentiment.
Which company has the best grades?
Both Oracle Corporation and Synopsys, Inc. have a consensus “Buy” rating. Oracle’s grades cluster around “Buy” and “Neutral,” while Synopsys shows more “Buy” and “Overweight” ratings with some upgrades, suggesting slightly stronger bullish sentiment for Synopsys. Investors may interpret these distinctions as differences in growth expectations or sector positioning.
Strengths and Weaknesses
Below is a comparison of key strengths and weaknesses for Oracle Corporation (ORCL) and Synopsys, Inc. (SNPS) based on their recent financial performance and market position.
| Criterion | Oracle Corporation (ORCL) | Synopsys, Inc. (SNPS) |
|---|---|---|
| Diversification | Highly diversified with strong Cloud & License, Hardware, and Services segments; Cloud revenues reached $49.2B in 2025 | Moderate diversification, mainly License & Maintenance and Technology Services; License & Maintenance revenues at $3.49B in 2025 |
| Profitability | Strong profitability: 21.7% net margin, 60.8% ROE, ROIC 10.9%, but declining ROIC trend | Moderate profitability: 19.0% net margin, low ROE 4.7%, low ROIC 2.0%, with sharply declining ROIC |
| Innovation | Established innovation in cloud computing and enterprise software | Focus on semiconductor design tools, but value destruction indicates innovation challenges |
| Global presence | Extensive global footprint with broad enterprise adoption | Global presence in semiconductor industry, but smaller scale than Oracle |
| Market Share | Large market share in enterprise software and cloud services | Significant niche player in electronic design automation, but faces intense competition |
In summary, Oracle shows strong profitability and diversification but a concerning decline in capital efficiency. Synopsys, though well positioned in a niche market, struggles with profitability and value creation, signaling higher investment risk. Investors should weigh Oracle’s scale against its declining returns and Synopsys’s innovation risks carefully.
Risk Analysis
Below is a comparative table highlighting key risk factors for Oracle Corporation (ORCL) and Synopsys, Inc. (SNPS) based on the most recent 2025 data:
| Metric | Oracle Corporation (ORCL) | Synopsys, Inc. (SNPS) |
|---|---|---|
| Market Risk | High beta 1.65 indicates higher volatility | Moderate beta 1.12 shows moderate volatility |
| Debt level | High leverage: Debt/Equity 5.09, Debt to Assets 61.8% (Unfavorable) | Low leverage: Debt/Equity 0.5, Debt to Assets 29.6% (Favorable) |
| Regulatory Risk | Moderate, due to global IT compliance requirements | Moderate, with exposure to semiconductor export controls |
| Operational Risk | Medium, complexity of cloud and software services | Medium, dependency on semiconductor design tools innovation |
| Environmental Risk | Low, limited direct environmental impact | Low, primarily software-focused with limited environmental footprint |
| Geopolitical Risk | Medium, exposure to US-China trade tensions affecting cloud services | Medium-high, semiconductor industry sensitive to geopolitical tensions |
In summary, Oracle faces significant financial risk from its high debt load and market volatility, though it benefits from strong profitability metrics. Synopsys shows better financial stability with lower leverage but contends with semiconductor sector geopolitical risks and high valuation multiples. Oracle’s debt levels and market sensitivity are the most impactful risks to monitor closely.
Which Stock to Choose?
Oracle Corporation (ORCL) shows a favorable income evolution with steady revenue growth of 8.38% in 2025 and strong profitability metrics, including a 21.68% net margin and 60.84% ROE. Its financial ratios reveal some weaknesses, such as high debt levels (net debt to EBITDA at 3.9) and low liquidity ratios (current ratio 0.75). The overall rating is very favorable with a B grade, though debt and valuation metrics remain unfavorable.
Synopsys, Inc. (SNPS) presents a favorable income statement with a 15.12% revenue growth in 2025 and a solid gross margin of 76.98%, but profitability ratios like ROE at 4.72% are less impressive. Financial ratios are mixed, with favorable liquidity (current ratio 1.62) and moderate debt, but some unfavorable valuation indicators such as a high P/E of 54.36. The company holds a B- rating, reflecting moderate overall financial health.
Investors prioritizing established profitability and strong returns on equity may find Oracle’s profile more aligned with their goals, despite its elevated debt and valuation concerns. Conversely, those focusing on companies with better liquidity and recent revenue growth might see Synopsys as potentially more suitable, albeit with lower profitability and higher valuation multiples. The choice could depend on the investor’s risk tolerance and investment strategy.
Disclaimer: Investment carries a risk of loss of initial capital. The past performance is not a reliable indicator of future results. Be sure to understand risks before making an investment decision.
Go Further
I encourage you to read the complete analyses of Oracle Corporation and Synopsys, Inc. to enhance your investment decisions: