In the dynamic world of technology infrastructure, Oracle Corporation and StoneCo Ltd. stand out as influential players with distinct market approaches. Oracle, a global giant, delivers comprehensive cloud software and enterprise solutions, while StoneCo focuses on fintech innovation for Brazil’s vibrant merchant ecosystem. By comparing their industry impact, growth potential, and innovation strategies, I aim to help you identify which company offers the most compelling investment opportunity today.
Table of contents
Companies Overview
I will begin the comparison between Oracle Corporation and StoneCo Ltd. by providing an overview of these two companies and their main differences.
Oracle Corporation Overview
Oracle Corporation, founded in 1977 and headquartered in Austin, Texas, operates in the Software – Infrastructure industry. It offers a broad range of enterprise IT products and services worldwide, including cloud software applications, industry-specific cloud solutions, and infrastructure technologies like Oracle Database and Java. With a market cap of $549B and 159K employees, Oracle serves businesses, governments, and educational institutions globally.
StoneCo Ltd. Overview
StoneCo Ltd., established in 2000 and based in George Town, Cayman Islands, provides financial technology solutions to merchants in Brazil. It focuses on electronic commerce through in-store, online, and mobile channels, serving approximately 1.77M clients, mainly small and medium businesses. With a market cap near $3.9B and 7.2K employees, StoneCo operates as a subsidiary of HR Holdings and trades on NASDAQ.
Key similarities and differences
Both Oracle and StoneCo operate in the technology sector within the software infrastructure industry, focusing on enabling business operations through technology. Oracle offers a diversified global portfolio of cloud and infrastructure products with a large employee base, while StoneCo specializes in fintech solutions for Brazilian merchants with a narrower client focus and smaller scale. Oracle’s business is more diversified across industries and geographies, contrasting with StoneCo’s regional fintech niche.
Income Statement Comparison
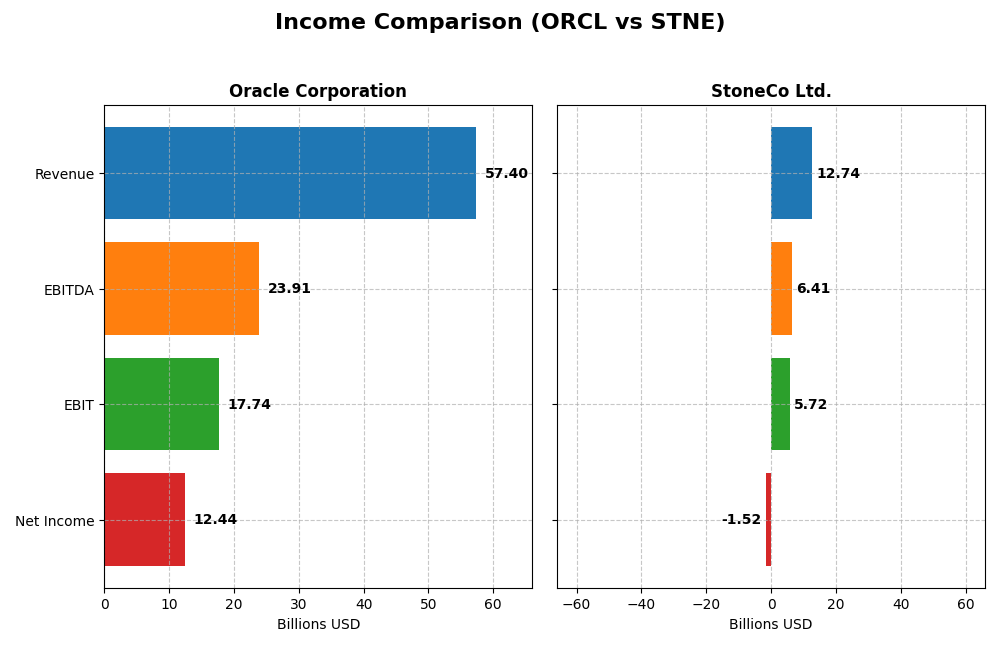
Below is a side-by-side comparison of key income statement metrics for Oracle Corporation and StoneCo Ltd. for their most recent fiscal years.
| Metric | Oracle Corporation (2025) | StoneCo Ltd. (2024) |
|---|---|---|
| Market Cap | 549B USD | 3.9B BRL |
| Revenue | 57.4B USD | 12.7B BRL |
| EBITDA | 23.9B USD | 6.4B BRL |
| EBIT | 17.7B USD | 5.7B BRL |
| Net Income | 12.4B USD | -1.5B BRL |
| EPS | 4.46 USD | -5.02 BRL |
| Fiscal Year | 2025 | 2024 |
Income Statement Interpretations
Oracle Corporation
Oracle’s revenue showed a steady increase from 40.5B in 2021 to 57.4B in 2025, with net income fluctuating, peaking at 13.7B in 2021 before settling at 12.4B in 2025. Margins remained generally favorable, with gross margin around 70.5% and net margin near 21.7%. The latest year showed solid growth in revenue (+8.4%) and improved margins, signaling operational efficiency.
StoneCo Ltd.
StoneCo’s revenue expanded rapidly from 3.2B BRL in 2020 to 12.7B BRL in 2024, but net income remained negative in 2024 at -1.5B BRL. While gross and EBIT margins were favorable at 73.4% and 44.9%, the net margin was negative at -11.9%. The recent year saw revenue growth of 12.1% but worsening net margin and EPS, indicating pressure on profitability despite top-line gains.
Which one has the stronger fundamentals?
Oracle exhibits stronger fundamentals with consistent revenue growth, positive and stable net income, and favorable margin trends, supported by a 71% favorable income statement evaluation. StoneCo’s rapid revenue growth is tempered by persistent net losses and negative net margins, with only 50% favorable indicators, reflecting higher risk in profitability despite growth momentum.
Financial Ratios Comparison
The table below presents a side-by-side comparison of the most recent financial ratios for Oracle Corporation and StoneCo Ltd., highlighting key performance and financial health metrics for fiscal year 2025 and 2024 respectively.
| Ratios | Oracle Corporation (FY 2025) | StoneCo Ltd. (FY 2024) |
|---|---|---|
| ROE | 60.8% | -12.9% |
| ROIC | 10.9% | 22.4% |
| P/E | 37.1 | -9.8 |
| P/B | 22.6 | 1.27 |
| Current Ratio | 0.75 | 1.37 |
| Quick Ratio | 0.75 | 1.37 |
| D/E (Debt-to-Equity) | 5.09 | 1.10 |
| Debt-to-Assets | 61.8% | 23.5% |
| Interest Coverage | 4.94 | 5.57 |
| Asset Turnover | 0.34 | 0.23 |
| Fixed Asset Turnover | 1.32 | 6.95 |
| Payout Ratio | 38.1% | 0% |
| Dividend Yield | 1.03% | 0% |
Interpretation of the Ratios
Oracle Corporation
Oracle shows strong profitability ratios, with a net margin of 21.68% and a high return on equity at 60.84%, indicating efficient profit generation. However, liquidity and leverage ratios are weak, with a current ratio of 0.75 and a debt-to-equity ratio over 5, raising solvency concerns. Oracle pays dividends, offering a 1.03% yield, but payout sustainability needs monitoring due to mixed free cash flow figures.
StoneCo Ltd.
StoneCo exhibits a mixed profile with unfavorable net margin (-11.89%) and return on equity (-12.87%), reflecting operational losses. Positively, it has favorable leverage metrics, such as a debt-to-assets ratio of 23.53%, and a solid return on invested capital at 22.41%. StoneCo does not pay dividends, likely due to negative earnings and a reinvestment focus amid growth and technology development.
Which one has the best ratios?
StoneCo’s ratios are slightly more favorable overall, balancing growth potential with manageable debt and liquidity. Oracle, while profitable and generating strong equity returns, faces challenges with high leverage and weak liquidity ratios. Both companies present risks; StoneCo’s losses contrast with Oracle’s solvency concerns, requiring careful individual assessment.
Strategic Positioning
This section compares the strategic positioning of Oracle Corporation and StoneCo Ltd., focusing on market position, key segments, and exposure to technological disruption:
Oracle Corporation
- Large market cap of $549B with significant competitive pressure in enterprise IT software.
- Diversified segments: Cloud and license ($49.2B), hardware ($2.9B), and services ($5.2B) drive business.
- Faces disruption through cloud computing, autonomous databases, IoT, blockchain, and digital assistants.
StoneCo Ltd.
- Smaller market cap of $3.9B, focused on fintech in Brazil’s merchant services sector.
- Concentrated on financial technology solutions for digital and physical merchants in Brazil.
- Positioned in digital payments with proprietary hubs, subject to fintech innovation risks.
Oracle Corporation vs StoneCo Ltd. Positioning
Oracle’s strategy is diversified across cloud software, hardware, and services with a broad global reach, while StoneCo concentrates on fintech solutions for Brazilian merchants. Oracle’s scale offers stability; StoneCo benefits from niche market focus but with geographic concentration risks.
Which has the best competitive advantage?
StoneCo shows a very favorable moat with growing ROIC and clear value creation, indicating a durable competitive advantage. Oracle has a slightly unfavorable moat with declining ROIC, signaling challenges in sustaining profitability despite its size.
Stock Comparison
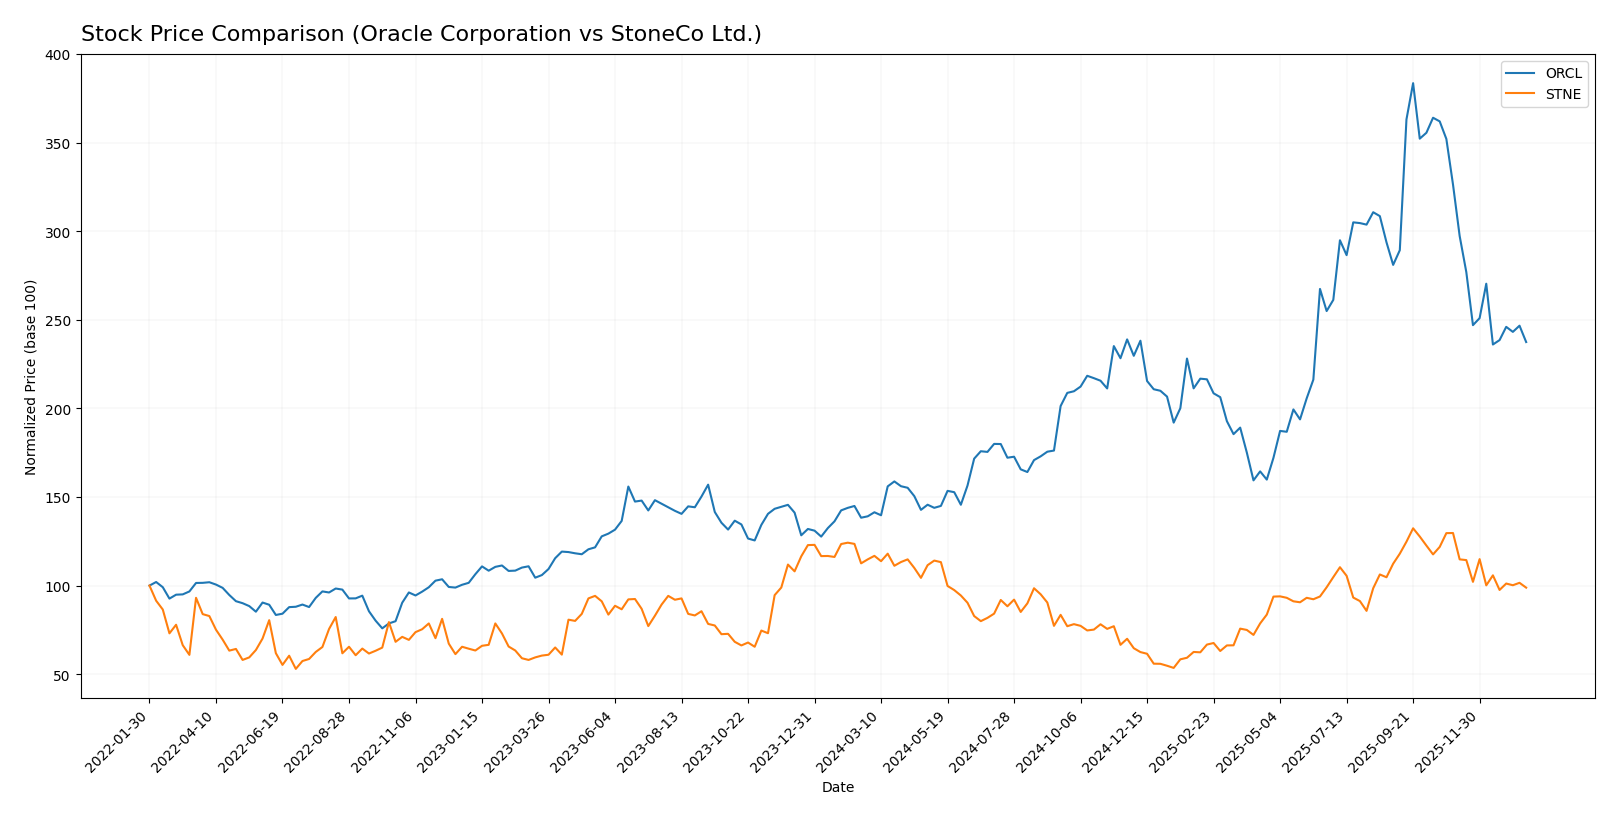
The stock price movements of Oracle Corporation and StoneCo Ltd. over the past year reveal contrasting trends, with Oracle demonstrating strong growth despite recent pullbacks, while StoneCo has experienced a consistent decline. Trading volumes for both companies have increased, with a recent shift toward slight seller dominance.
Trend Analysis
Oracle Corporation’s stock has shown a bullish trend over the past 12 months with a 70.69% increase, though recent months indicate a decelerating downward correction of -27.23%. Price volatility is high with a standard deviation of 49.0.
StoneCo Ltd.’s stock exhibited a bearish trend over the past year, declining by 13.9%, with recent losses of -23.78% continuing at a decelerating pace. Volatility is comparatively low, with a standard deviation of 2.92.
Comparing both, Oracle delivered the highest market performance with a strong overall gain, while StoneCo’s stock trend remained negative throughout the period analyzed.
Target Prices
Analysts present a mixed but mostly optimistic target consensus for these stocks.
| Company | Target High | Target Low | Consensus |
|---|---|---|---|
| Oracle Corporation | 400 | 175 | 314.08 |
| StoneCo Ltd. | 20 | 20 | 20 |
Oracle’s target consensus at 314.08 USD suggests a significant upside from its current price of 191.09 USD, indicating positive analyst sentiment. StoneCo’s consensus target of 20 USD is modestly above its current 14.49 USD price, signaling cautious optimism.
Analyst Opinions Comparison
This section compares analysts’ ratings and financial scores for Oracle Corporation and StoneCo Ltd.:
Rating Comparison
ORCL Rating
- Rating: B, indicating a very favorable outlook based on financial evaluations.
- Discounted Cash Flow Score: 3, a moderate indication of valuation based on future cash flows.
- ROE Score: 5, very favorable, showing efficient profit generation from shareholders’ equity.
- ROA Score: 4, favorable, reflecting effective utilization of company assets.
- Debt To Equity Score: 1, very unfavorable, highlighting higher financial risk from debt.
- Overall Score: 3, moderate, summarizing the company’s financial standing.
STNE Rating
- Rating: C, reflecting a moderate outlook according to analysts’ assessments.
- Discounted Cash Flow Score: 3, also moderate, suggesting similar valuation concerns.
- ROE Score: 1, very unfavorable, indicating weak efficiency in generating shareholder returns.
- ROA Score: 1, very unfavorable, showing poor asset utilization for earnings.
- Debt To Equity Score: 1, very unfavorable, also indicating significant financial risk.
- Overall Score: 2, moderate but lower than ORCL, indicating weaker overall financial health.
Which one is the best rated?
Based strictly on the provided data, Oracle (ORCL) is better rated overall with a higher rating (B vs. C) and stronger scores in ROE and ROA. StoneCo (STNE) has weaker profitability metrics and a lower overall score, despite similar discounted cash flow and debt-to-equity risks.
Scores Comparison
Here is a comparison of the key financial scores for Oracle Corporation and StoneCo Ltd.:
ORCL Scores
- Altman Z-Score: 2.43, indicating moderate bankruptcy risk in the grey zone.
- Piotroski Score: 5, reflecting average financial strength.
STNE Scores
- Altman Z-Score: 1.02, indicating high bankruptcy risk in the distress zone.
- Piotroski Score: 5, reflecting average financial strength.
Which company has the best scores?
Based on the provided data, Oracle shows a higher Altman Z-Score, suggesting lower bankruptcy risk compared to StoneCo. Both companies have the same average Piotroski Score, indicating similar financial strength.
Grades Comparison
Here is a comparison of the recent grades assigned to Oracle Corporation and StoneCo Ltd.:
Oracle Corporation Grades
The following table summarizes recent grades from established grading companies for Oracle Corporation:
| Grading Company | Action | New Grade | Date |
|---|---|---|---|
| UBS | Maintain | Buy | 2026-01-05 |
| RBC Capital | Maintain | Sector Perform | 2026-01-05 |
| Jefferies | Maintain | Buy | 2026-01-05 |
| Goldman Sachs | Maintain | Neutral | 2025-12-12 |
| Keybanc | Maintain | Overweight | 2025-12-11 |
| UBS | Maintain | Buy | 2025-12-11 |
| Citigroup | Maintain | Buy | 2025-12-11 |
| JP Morgan | Maintain | Neutral | 2025-12-11 |
| DA Davidson | Maintain | Neutral | 2025-12-11 |
| Scotiabank | Maintain | Sector Outperform | 2025-12-11 |
Oracle’s grades show a consistent positive trend, with multiple “Buy” and “Overweight” ratings alongside sector outperformance indications.
StoneCo Ltd. Grades
The table below lists recent grades from established grading companies for StoneCo Ltd.:
| Grading Company | Action | New Grade | Date |
|---|---|---|---|
| Goldman Sachs | Maintain | Buy | 2025-10-14 |
| B of A Securities | Maintain | Buy | 2025-09-09 |
| UBS | Maintain | Buy | 2025-08-29 |
| JP Morgan | Maintain | Overweight | 2025-07-16 |
| Barclays | Maintain | Equal Weight | 2025-05-12 |
| Barclays | Maintain | Equal Weight | 2025-04-23 |
| Citigroup | Upgrade | Buy | 2025-04-22 |
| Barclays | Maintain | Equal Weight | 2025-03-21 |
| Morgan Stanley | Maintain | Underweight | 2025-03-21 |
| Goldman Sachs | Maintain | Buy | 2025-02-06 |
StoneCo exhibits mixed ratings, with several “Buy” and “Overweight” grades but also multiple “Equal Weight” and one “Underweight” rating.
Which company has the best grades?
Oracle Corporation holds a stronger and more consistent positive grading profile than StoneCo Ltd., marked by numerous “Buy” and “Overweight” recommendations. This pattern suggests a broader analyst confidence in Oracle, which could influence investor sentiment towards greater perceived stability and growth potential. StoneCo’s more varied grades indicate a less uniform outlook that might imply higher uncertainty for investors.
Strengths and Weaknesses
The table below summarizes key strengths and weaknesses of Oracle Corporation and StoneCo Ltd. based on their latest financial and market performance data.
| Criterion | Oracle Corporation (ORCL) | StoneCo Ltd. (STNE) |
|---|---|---|
| Diversification | Strong product segmentation: cloud, hardware, services with $49.2B in cloud and license revenue (2025) | Focused on financial technology with less diversification |
| Profitability | High net margin (21.68%) and ROE (60.84%), but declining ROIC trend and unfavorable valuation ratios | Negative net margin (-11.89%) and ROE (-12.87%), but strong ROIC (22.41%) and improving profitability |
| Innovation | Moderate innovation with cloud growth, but hardware declining | Rapid innovation and growing ROIC indicate strong competitive advantage |
| Global presence | Established global footprint with broad enterprise client base | Regional focus mainly in Brazil, limiting global reach |
| Market Share | Large market share in enterprise software and cloud | Growing fintech market share but still emerging |
Key takeaways: Oracle shows solid profitability and diversification but faces challenges with declining capital efficiency and high debt levels. StoneCo demonstrates strong value creation and innovation momentum despite current profitability struggles, reflecting growth potential with higher risk.
Risk Analysis
Below is a summary table of key risks for Oracle Corporation (ORCL) and StoneCo Ltd. (STNE) based on the most recent financial and market data:
| Metric | Oracle Corporation (ORCL) | StoneCo Ltd. (STNE) |
|---|---|---|
| Market Risk | Beta 1.65; exposed to tech sector volatility and high valuation multiples | Beta 1.83; emerging market exposure and currency volatility in Brazil |
| Debt level | High debt-to-equity at 5.09; debt-to-assets 61.8% (unfavorable) | Moderate debt-to-equity at 1.1; debt-to-assets 23.5% (favorable) |
| Regulatory Risk | US and global tech regulations, data privacy laws | Brazil’s evolving fintech regulations and compliance demands |
| Operational Risk | Complex global cloud infrastructure and integration | Reliance on Brazilian market and local payment ecosystem |
| Environmental Risk | Moderate; hardware manufacturing impact and data center energy use | Moderate; fintech operations with limited direct environmental footprint |
| Geopolitical Risk | US-China tech tensions, global trade issues | Political and economic instability in Brazil impacting business |
Oracle’s main risks stem from high leverage and valuation concerns amid a competitive tech environment. StoneCo faces significant geopolitical and regulatory uncertainties in Brazil, with moderate debt levels. Notably, StoneCo’s Altman Z-Score in the distress zone signals elevated bankruptcy risk, unlike Oracle’s more moderate grey zone status. Investors should weigh Oracle’s stable profitability and StoneCo’s emerging market growth against these risk factors carefully.
Which Stock to Choose?
Oracle Corporation (ORCL) shows a favorable income evolution with a 71% positive statement evaluation and solid profitability metrics including a 21.68% net margin and 60.84% ROE. However, it faces unfavorable financial ratios related to debt and liquidity, and a slightly unfavorable MOAT rating due to declining ROIC versus WACC.
StoneCo Ltd. (STNE) presents favorable income growth with a 50% favorable income statement rating, strong ROIC above WACC signaling value creation, and a very favorable MOAT status. Nevertheless, its net margin is negative and financial ratios reveal mixed signals, including unfavorable leverage and profitability metrics.
Investors prioritizing durable competitive advantages and value creation might find StoneCo’s strong MOAT and ROIC trends appealing, while those focused on overall profitability and income stability could interpret Oracle’s favorable income metrics and high ROE as positive, despite its financial leverage challenges.
Disclaimer: Investment carries a risk of loss of initial capital. The past performance is not a reliable indicator of future results. Be sure to understand risks before making an investment decision.
Go Further
I encourage you to read the complete analyses of Oracle Corporation and StoneCo Ltd. to enhance your investment decisions: