Oracle Corporation and Palo Alto Networks, Inc. are two prominent players in the software infrastructure industry, each driving innovation in distinct yet overlapping technology domains. Oracle focuses on comprehensive enterprise IT solutions and cloud infrastructure, while Palo Alto Networks leads in cybersecurity. Comparing these giants reveals insights into their market strategies, growth potential, and risk profiles. This article will help you decide which company offers the most compelling investment opportunity in 2026.

Table of contents
Companies Overview
I will begin the comparison between Oracle Corporation and Palo Alto Networks by providing an overview of these two companies and their main differences.
Oracle Overview
Oracle Corporation focuses on enterprise information technology environments worldwide, offering a broad range of cloud software applications, including ERP, supply chain, human capital management, and marketing solutions. It also provides infrastructure technologies such as the Oracle Database, Java, and middleware, alongside hardware products and consulting services. Founded in 1977, Oracle is a major player in software infrastructure with a market cap of 549B USD and 159K employees.
Palo Alto Networks Overview
Palo Alto Networks, Inc. specializes in cybersecurity solutions, providing firewall appliances, security management software, and subscription services covering threat prevention and device protection. The company also offers cloud security, threat intelligence, and professional services, targeting medium to large enterprises and government entities. Founded in 2005, Palo Alto Networks has a market cap of 128B USD and employs about 16K people in the software infrastructure sector.
Key similarities and differences
Both companies operate within the software infrastructure industry and serve large enterprise clients with technology solutions. Oracle’s business model spans a wider range of IT products, including cloud applications, databases, hardware, and consulting, while Palo Alto Networks is more specialized in cybersecurity products and services. Oracle’s scale and employee count significantly exceed those of Palo Alto Networks, reflecting its broader product portfolio and longer market presence.
Income Statement Comparison
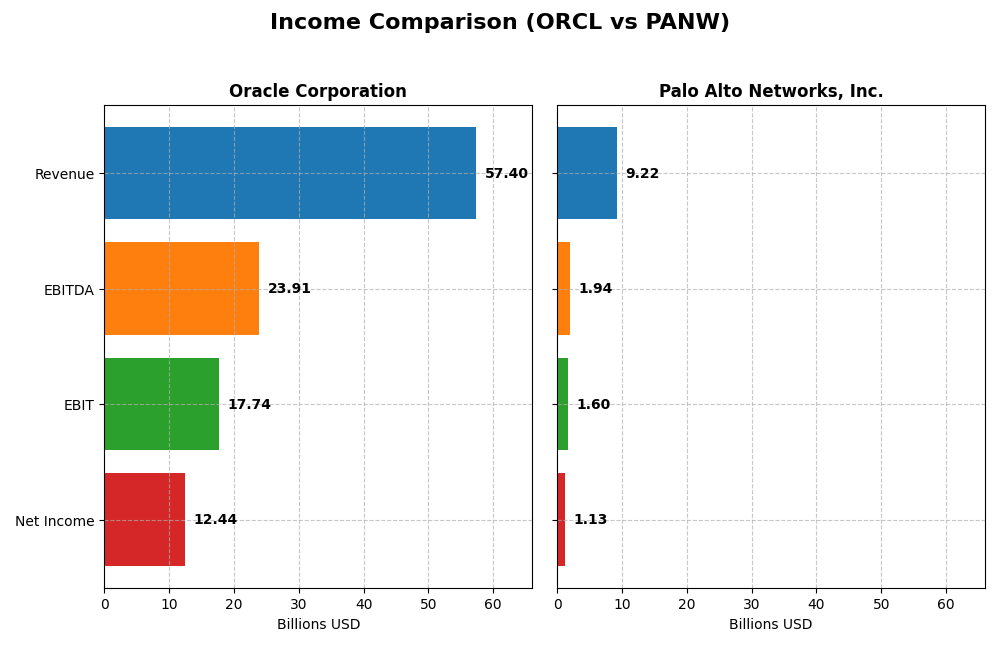
The table below compares the most recent fiscal year income statement metrics for Oracle Corporation and Palo Alto Networks, Inc., offering a snapshot of their financial performance.
| Metric | Oracle Corporation | Palo Alto Networks, Inc. |
|---|---|---|
| Market Cap | 549B | 128B |
| Revenue | 57.4B | 9.22B |
| EBITDA | 23.9B | 1.94B |
| EBIT | 17.7B | 1.60B |
| Net Income | 12.4B | 1.13B |
| EPS | 4.46 | 1.71 |
| Fiscal Year | 2025 | 2025 |
Income Statement Interpretations
Oracle Corporation
Oracle’s revenue showed a steady increase from 40.5B in 2021 to 57.4B in 2025, reflecting a 41.8% growth over five years. Net income exhibited volatility, declining overall by 9.5%, with net margin contracting by 36.2%. The 2025 fiscal year indicated favorable trends, with revenue up 8.4% and net margin improving by 9.7%, signaling margin recovery despite past fluctuations.
Palo Alto Networks, Inc.
Palo Alto Networks demonstrated robust revenue growth, more than doubling from 4.3B in 2021 to 9.2B in 2025, a 116.7% increase. Net income surged by 327.3% over the period, accompanied by a net margin expansion of 204.9%. The latest year saw revenue growth of 14.9%, but net margin and EPS declined sharply, reflecting short-term profitability pressure despite strong top-line expansion.
Which one has the stronger fundamentals?
Oracle benefits from consistently high gross and EBIT margins, maintaining a solid net margin near 22%, with stable interest expenses, suggesting operational resilience. Palo Alto Networks excels in growth metrics and margin expansion over the long term but faces recent profitability headwinds. Oracle’s stable profitability contrasts with Palo Alto’s volatility, indicating differing risk and growth profiles.
Financial Ratios Comparison
The table below presents a side-by-side comparison of key financial ratios for Oracle Corporation and Palo Alto Networks, Inc. based on their most recent fiscal year data.
| Ratios | Oracle Corporation (2025) | Palo Alto Networks, Inc. (2025) |
|---|---|---|
| ROE | 60.8% | 14.5% |
| ROIC | 10.9% | 5.7% |
| P/E | 37.1 | 101.4 |
| P/B | 22.6 | 14.7 |
| Current Ratio | 0.75 | 0.89 |
| Quick Ratio | 0.75 | 0.89 |
| D/E (Debt-to-Equity) | 5.09 | 0.04 |
| Debt-to-Assets | 61.8% | 1.4% |
| Interest Coverage | 4.94 | 414.3 |
| Asset Turnover | 0.34 | 0.39 |
| Fixed Asset Turnover | 1.32 | 12.56 |
| Payout Ratio | 38.1% | 0% |
| Dividend Yield | 1.03% | 0% |
Interpretation of the Ratios
Oracle Corporation
Oracle presents strong profitability ratios including a favorable net margin of 21.68% and a very high return on equity at 60.84%, indicating efficient use of shareholders’ funds. However, liquidity and leverage ratios are weak, with a current ratio of 0.75 and debt-to-equity at 5.09, suggesting potential solvency risks. Oracle pays dividends with a modest yield of 1.03%, supported but somewhat pressured by free cash flow, requiring attention to payout sustainability.
Palo Alto Networks, Inc.
Palo Alto Networks shows moderate profitability with a net margin of 12.3% and neutral returns on equity and invested capital, reflecting a growing but less mature financial profile. The company benefits from low leverage and strong interest coverage, with debt-to-assets at 1.43% and an interest coverage ratio of 532.53, highlighting solid financial health. It does not pay dividends, focusing instead on reinvestment and growth, which aligns with its high R&D expenses and share buyback programs.
Which one has the best ratios?
Based on the evaluations, Palo Alto Networks exhibits a more balanced financial position with a higher proportion of favorable ratios, particularly in leverage and coverage metrics, while Oracle excels in profitability but faces challenges in liquidity and solvency. Overall, Palo Alto Networks holds a slightly favorable ratio profile, contrasting with Oracle’s unfavorable global ratio assessment.
Strategic Positioning
This section compares the strategic positioning of Oracle Corporation and Palo Alto Networks, Inc., focusing on Market position, Key segments, and Exposure to technological disruption:
Oracle Corporation
- Large market cap of 549B with high beta, facing mature software infrastructure competition.
- Diversified revenue streams: cloud and license (49B), hardware (2.9B), and services (5.2B) in 2025.
- Exposure to cloud infrastructure, autonomous databases, IoT, and blockchain technologies.
Palo Alto Networks, Inc.
- Smaller market cap of 128B with lower beta, competing in cybersecurity with growing demand.
- Focused on cybersecurity: subscription (5B), product (1.8B), and support (2.4B) in 2025.
- Exposure to cloud security, firewall appliances, threat intelligence, and SaaS security solutions.
Oracle Corporation vs Palo Alto Networks Positioning
Oracle’s strategy is diversified across cloud, hardware, and services, providing multiple business drivers, while Palo Alto Networks concentrates on cybersecurity solutions. Oracle’s broad segments offer stability; Palo Alto’s focus targets a high-growth niche, exposing it to specific market risks.
Which has the best competitive advantage?
Both companies have a Slightly Unfavorable moat status, with Oracle shedding value amid declining ROIC, while Palo Alto Networks also sheds value but shows improving profitability with growing ROIC trends. Neither currently demonstrates a strong sustainable competitive advantage.
Stock Comparison
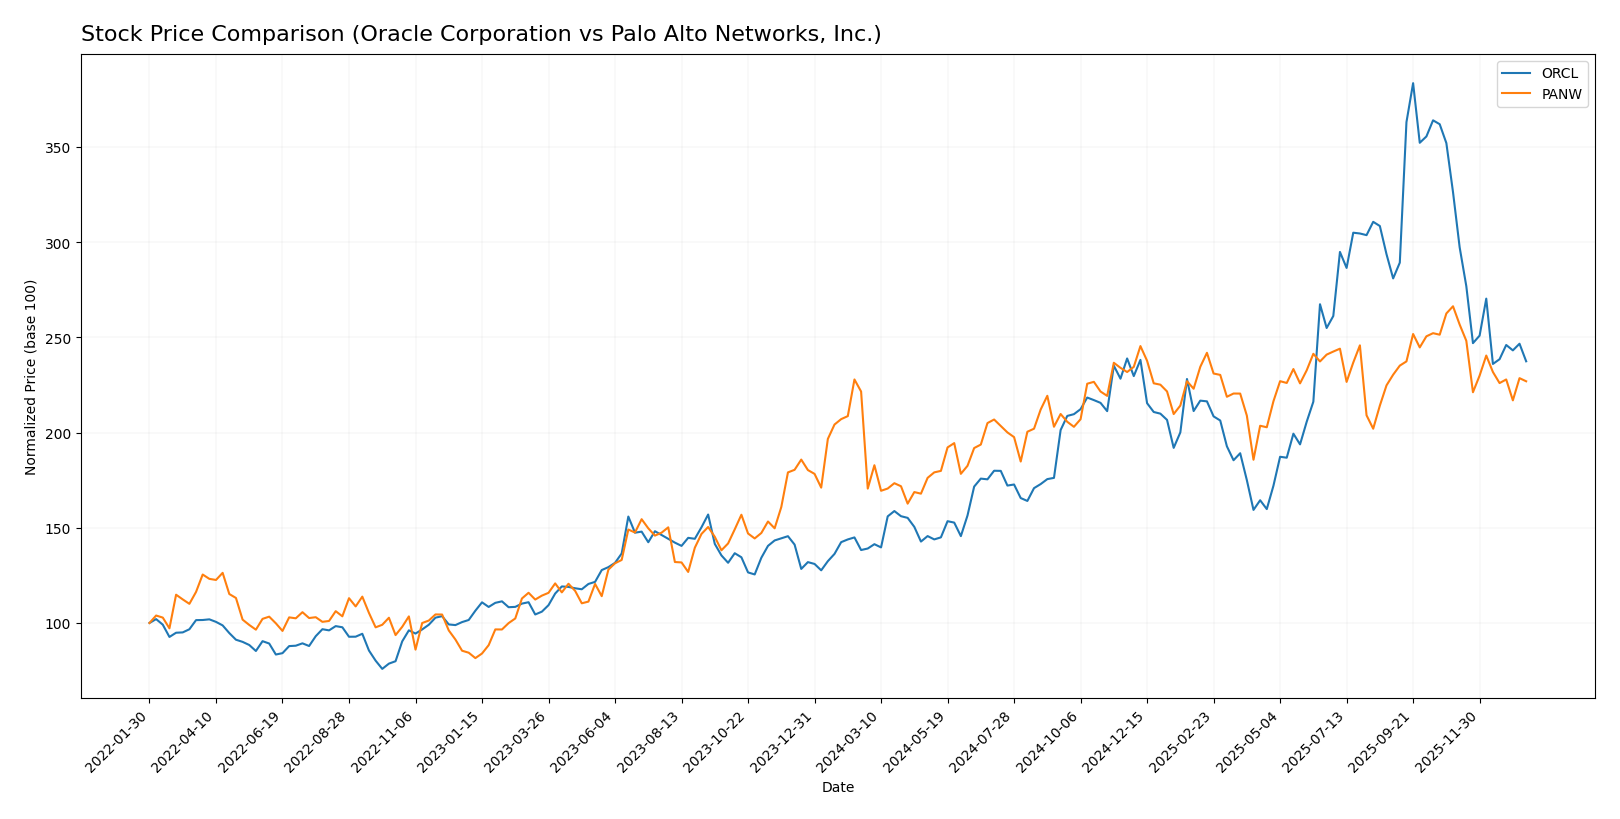
The past year has seen significant price movements and trading dynamics for Oracle Corporation and Palo Alto Networks, Inc., with both stocks exhibiting bullish trends overall but recent declines in price and shifts in buyer-seller dominance.
Trend Analysis
Oracle Corporation’s stock showed a strong bullish trend over the past 12 months with a 70.69% increase, though this growth decelerated. The price ranged from a low of 111.95 to a high of 308.66, with recent volatility marked by a 27.23% price drop since November 2025.
Palo Alto Networks, Inc. experienced a 33.05% bullish trend over the same period, also decelerating. Its price fluctuated between 134.51 and 220.24, followed by a recent 14.79% decline since November 2025, indicating some weakening momentum.
Comparing the two, Oracle’s stock delivered the highest market performance with a 70.69% gain over the past year, outperforming Palo Alto Networks’ 33.05% increase despite both facing recent downward trends.
Target Prices
The current analyst consensus presents a bullish outlook for both Oracle Corporation and Palo Alto Networks, Inc.
| Company | Target High | Target Low | Consensus |
|---|---|---|---|
| Oracle Corporation | 400 | 175 | 314.08 |
| Palo Alto Networks, Inc. | 265 | 157 | 231.07 |
Analysts expect Oracle to trade significantly above its current price of 191.09 USD, indicating strong upside potential. Similarly, Palo Alto Networks’ consensus target of 231.07 USD suggests notable growth compared to its current price of 187.66 USD.
Analyst Opinions Comparison
This section compares analysts’ ratings and grades for Oracle Corporation and Palo Alto Networks, Inc.:
Rating Comparison
Oracle Corporation Rating
- Rating: B, considered Very Favorable by analysts.
- Discounted Cash Flow Score: Moderate at 3.
- ROE Score: Very Favorable with a high score of 5.
- ROA Score: Favorable at 4, indicating good asset use.
- Debt To Equity Score: Very Unfavorable at 1, indicating high financial risk.
- Overall Score: Moderate at 3.
Palo Alto Networks, Inc. Rating
- Rating: B, also rated Very Favorable by analysts.
- Discounted Cash Flow Score: Favorable at 4.
- ROE Score: Favorable with a score of 4.
- ROA Score: Moderate at 3, showing average asset use.
- Debt To Equity Score: Favorable at 4, indicating lower financial risk.
- Overall Score: Moderate at 3.
Which one is the best rated?
Both companies share the same overall rating of B and an overall score of 3, but Palo Alto Networks scores better on discounted cash flow and debt-to-equity, suggesting lower financial risk. Oracle excels in ROE and ROA but has a weaker debt position.
Scores Comparison
Here is a comparison of the Altman Z-Score and Piotroski Score for both companies:
ORCL Scores
- Altman Z-Score: 2.43, in the grey zone indicating moderate bankruptcy risk.
- Piotroski Score: 5, rated average for financial strength.
PANW Scores
- Altman Z-Score: 5.95, in the safe zone indicating low bankruptcy risk.
- Piotroski Score: 6, rated average for financial strength.
Which company has the best scores?
Based on the provided data, PANW exhibits a significantly stronger Altman Z-Score, placing it in the safe zone, while ORCL is in the grey zone. Both have average Piotroski Scores, with PANW slightly higher. Overall, PANW shows better financial stability scores.
Grades Comparison
Here is a detailed comparison of the latest grades assigned to Oracle Corporation and Palo Alto Networks, Inc.:
Oracle Corporation Grades
The table below summarizes recent grades from well-known financial institutions for Oracle Corporation:
| Grading Company | Action | New Grade | Date |
|---|---|---|---|
| UBS | Maintain | Buy | 2026-01-05 |
| RBC Capital | Maintain | Sector Perform | 2026-01-05 |
| Jefferies | Maintain | Buy | 2026-01-05 |
| Goldman Sachs | Maintain | Neutral | 2025-12-12 |
| Keybanc | Maintain | Overweight | 2025-12-11 |
| UBS | Maintain | Buy | 2025-12-11 |
| Citigroup | Maintain | Buy | 2025-12-11 |
| JP Morgan | Maintain | Neutral | 2025-12-11 |
| DA Davidson | Maintain | Neutral | 2025-12-11 |
| Scotiabank | Maintain | Sector Outperform | 2025-12-11 |
The overall trend for Oracle shows consistent “Buy” and “Neutral” ratings with no recent downgrades, indicating stable analyst confidence.
Palo Alto Networks, Inc. Grades
The table below summarizes recent grades from recognized grading companies for Palo Alto Networks, Inc.:
| Grading Company | Action | New Grade | Date |
|---|---|---|---|
| UBS | Maintain | Neutral | 2026-01-13 |
| Piper Sandler | Maintain | Overweight | 2026-01-05 |
| Guggenheim | Upgrade | Neutral | 2026-01-05 |
| Morgan Stanley | Maintain | Overweight | 2025-12-18 |
| Goldman Sachs | Maintain | Buy | 2025-11-21 |
| HSBC | Downgrade | Reduce | 2025-11-21 |
| Needham | Maintain | Buy | 2025-11-20 |
| WestPark Capital | Maintain | Hold | 2025-11-20 |
| Bernstein | Maintain | Outperform | 2025-11-20 |
| DA Davidson | Maintain | Buy | 2025-11-20 |
Palo Alto Networks’ grades show a mix of “Buy,” “Neutral,” and some downgrades, including a recent reduction by HSBC, indicating a more varied analyst sentiment.
Which company has the best grades?
Both Oracle Corporation and Palo Alto Networks, Inc. hold a consensus “Buy” rating, but Oracle’s grades demonstrate more stability and a higher number of consistent “Buy” ratings. This may suggest stronger analyst confidence, potentially impacting investor perceptions of lower risk and steadier outlooks compared to Palo Alto Networks’ more mixed signals.
Strengths and Weaknesses
Below is a comparison table highlighting the key strengths and weaknesses of Oracle Corporation (ORCL) and Palo Alto Networks, Inc. (PANW) based on the most recent data including financial performance, innovation, market presence, and diversification.
| Criterion | Oracle Corporation (ORCL) | Palo Alto Networks, Inc. (PANW) |
|---|---|---|
| Diversification | Strong diversification with Cloud & License ($49.2B), Services ($5.2B), Hardware ($2.9B) | Focused on cybersecurity with growing Subscription ($5.0B), Product ($1.8B), Support ($2.4B) segments |
| Profitability | High net margin (21.68%) and ROIC (10.86%), but declining ROIC trend and slightly unfavorable moat | Moderate net margin (12.3%) and neutral ROIC (5.67%), with improving ROIC trend but still value-destroying |
| Innovation | Established products with strong cloud presence; innovation pace slower given mature market | High innovation in cybersecurity with rapidly growing subscription-based revenue and strong asset turnover |
| Global presence | Global footprint with diversified revenue streams across cloud, license, and services | Increasing global presence driven by subscription growth and cloud security demand |
| Market Share | Large market share in enterprise software and cloud services | Emerging but growing market share in cybersecurity with expanding subscription base |
Key takeaways: Oracle offers strong diversification and profitability but faces challenges with declining capital efficiency. Palo Alto Networks shows promising growth and innovation in cybersecurity, with improving profitability metrics, though it remains a value destroyer currently. Investors should weigh Oracle’s stability against Palo Alto’s growth potential and risk profile.
Risk Analysis
The table below summarizes key risks for Oracle Corporation (ORCL) and Palo Alto Networks, Inc. (PANW) based on the latest 2025 data.
| Metric | Oracle Corporation (ORCL) | Palo Alto Networks, Inc. (PANW) |
|---|---|---|
| Market Risk | High beta at 1.65 indicates greater volatility vs. market. | Lower beta at 0.75 suggests less market volatility. |
| Debt Level | High debt-to-equity ratio (5.09) and debt-to-assets at 61.83% indicate significant leverage. | Very low debt-to-equity (0.04) and debt-to-assets (1.43%) show strong balance sheet. |
| Regulatory Risk | Moderate, due to global software and cloud compliance demands. | Elevated, as cybersecurity firms face evolving regulations and compliance pressures. |
| Operational Risk | Complexity in cloud and hardware integration may lead to operational challenges. | High reliance on cutting-edge security solutions; rapid innovation needed to stay competitive. |
| Environmental Risk | Moderate, with hardware production and energy use considerations. | Low to moderate; mainly linked to data center energy consumption. |
| Geopolitical Risk | Moderate, given global customer base and supply chain exposure. | Moderate, with exposure to government contracts and international markets. |
Oracle’s highest risks stem from its substantial leverage and market volatility, posing financial strain under adverse conditions. Palo Alto Networks faces regulatory and operational risks typical of cybersecurity firms but benefits from a strong balance sheet and lower market volatility. Investors should weigh Oracle’s leverage risks against Palo Alto’s regulatory challenges when managing portfolio exposure.
Which Stock to Choose?
Oracle Corporation (ORCL) shows steady income growth with favorable margins and profitability, but exhibits high debt levels and a declining return on invested capital (ROIC). Its financial ratios are mostly unfavorable, yet it holds a very favorable rating overall.
Palo Alto Networks, Inc. (PANW) demonstrates rapid revenue and net income growth with favorable income statement metrics and improving profitability. It maintains low debt, a slightly favorable financial ratio profile, and a very favorable rating, supported by a strong Altman Z-Score.
Investors focused on growth might find PANW’s accelerating profitability and improving ROIC attractive, while those valuing established profitability and scale could view ORCL’s solid income quality and rating as appealing despite its higher leverage and less favorable ratios.
Disclaimer: Investment carries a risk of loss of initial capital. The past performance is not a reliable indicator of future results. Be sure to understand risks before making an investment decision.
Go Further
I encourage you to read the complete analyses of Oracle Corporation and Palo Alto Networks, Inc. to enhance your investment decisions: