Home > Comparison > Technology > ORCL vs PLTR
The strategic rivalry between Oracle Corporation and Palantir Technologies Inc. shapes the evolution of the technology sector. Oracle, a capital-intensive infrastructure software titan, contrasts with Palantir’s agile, data-centric software platform model. This competition pits established scale against innovative specialization. I will analyze which company’s corporate trajectory offers a superior risk-adjusted return for a diversified portfolio navigating today’s dynamic technology landscape.
Table of contents
Companies Overview
Oracle Corporation and Palantir Technologies Inc. are pivotal players in the software infrastructure market, shaping enterprise IT and data analytics landscapes.
Oracle Corporation: Enterprise Cloud & Infrastructure Powerhouse
Oracle dominates the enterprise software infrastructure with a broad portfolio. Its core revenue comes from cloud applications like ERP and human capital management, alongside database and middleware products. In 2026, Oracle’s strategic focus sharpened on expanding its autonomous database and cloud infrastructure offerings, aiming to deepen its competitive advantage in integrated enterprise solutions.
Palantir Technologies Inc.: Data Integration & AI Innovator
Palantir specializes in advanced data analytics software for government and commercial sectors. It generates revenue primarily through its platforms Gotham and Foundry, which facilitate complex data integration and operational intelligence. In 2026, Palantir intensified its focus on AI-driven solutions and scalable deployment via Palantir Apollo, enhancing its market position in predictive analytics and real-time decision-making.
Strategic Collision: Similarities & Divergences
Both companies excel in software infrastructure but diverge sharply in approach: Oracle pursues a closed ecosystem of integrated cloud services, while Palantir offers an open, scalable platform emphasizing data fusion and AI. Their primary battleground is enterprise data management and cloud deployment. Oracle’s mature, diversified footprint contrasts with Palantir’s nimble, innovation-driven profile, defining distinct risk and growth trajectories for investors.
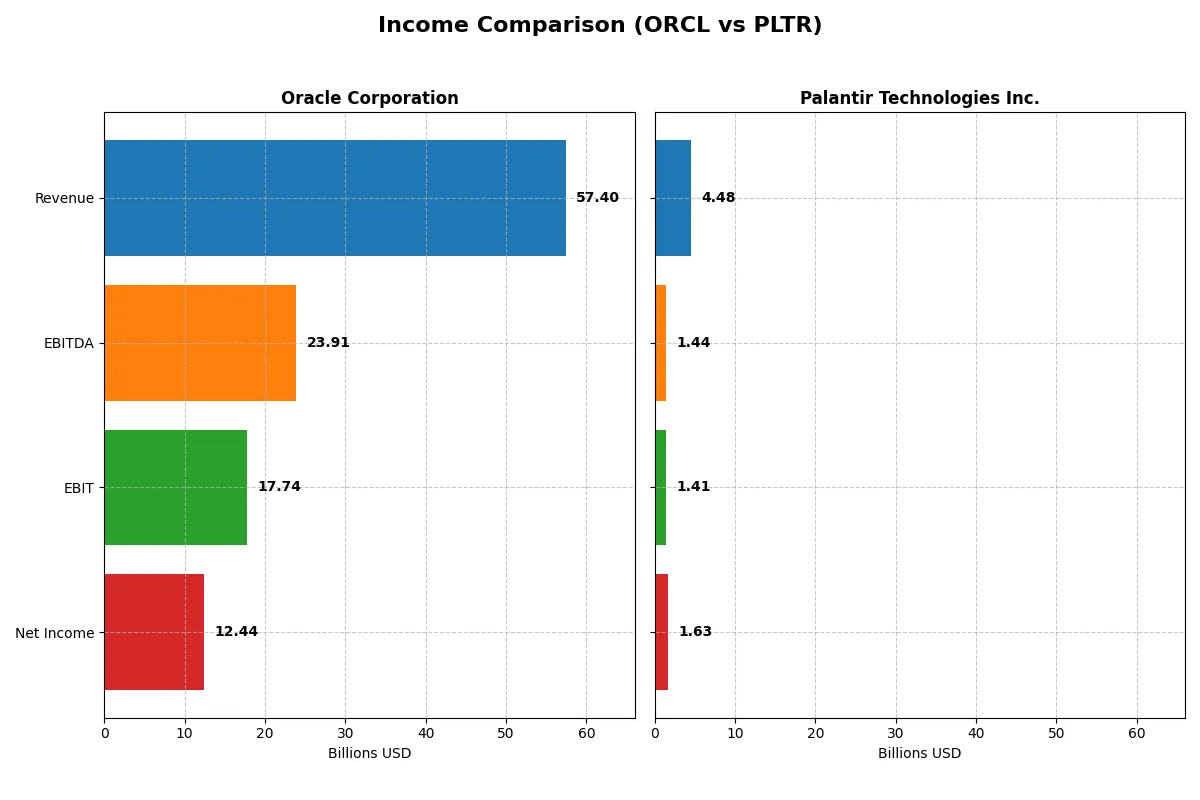
Income Statement Comparison
This table dissects the core profitability and scalability of both corporate engines to reveal who dominates the bottom line:
| Metric | Oracle Corporation (ORCL) | Palantir Technologies Inc. (PLTR) |
|---|---|---|
| Revenue | 57.4B | 4.48B |
| Cost of Revenue | 16.9B | 789M |
| Operating Expenses | 22.8B | 2.27B |
| Gross Profit | 40.5B | 3.69B |
| EBITDA | 23.9B | 1.44B |
| EBIT | 17.7B | 1.41B |
| Interest Expense | 3.58B | 0 |
| Net Income | 12.4B | 1.63B |
| EPS | 4.46 | 0.69 |
| Fiscal Year | 2025 | 2025 |
Income Statement Analysis: The Bottom-Line Duel
This income statement comparison reveals which company runs a more efficient and profitable corporate engine from revenue to net income.
Oracle Corporation Analysis
Oracle’s revenue grew steadily from $40B in 2021 to $57.4B in 2025, showing robust top-line momentum. Its gross margin remains strong at 70.5%, while net margins hold at a healthy 21.7%. The 2025 fiscal year delivered a solid 8.4% revenue increase and 9.7% net margin expansion, reflecting disciplined cost management and operational efficiency.
Palantir Technologies Inc. Analysis
Palantir’s revenue surged dramatically from $1.54B in 2021 to $4.48B in 2025, driven by rapid market penetration. It boasts an impressive 82.4% gross margin and a superior 36.3% net margin, highlighting exceptional profitability for a growth-stage firm. The latest year shows explosive 56.2% revenue growth and over 125% net margin improvement, signaling accelerating operational leverage.
Growth Scale vs. Margin Precision
Palantir dominates in revenue growth and net margin expansion, outperforming Oracle’s more mature, stable gains. Oracle’s scale and consistent margins offer a dependable earnings profile. Palantir’s profile suits investors prioritizing rapid growth and high margin potential, while Oracle appeals to those seeking steadier profitability and cash flow resilience.
Financial Ratios Comparison
These vital ratios act as a diagnostic tool to expose the underlying fiscal health, valuation premiums, and capital efficiency of each company:
| Ratios | Oracle Corporation (ORCL) | Palantir Technologies Inc. (PLTR) |
|---|---|---|
| ROE | 60.8% | 22.0% |
| ROIC | 10.9% | 17.9% |
| P/E | 37.1 | 259.2 |
| P/B | 22.6 | 57.0 |
| Current Ratio | 0.75 | 7.11 |
| Quick Ratio | 0.75 | 7.11 |
| D/E | 5.09 | 0.03 |
| Debt-to-Assets | 61.8% | 2.6% |
| Interest Coverage | 4.94 | 0 |
| Asset Turnover | 0.34 | 0.50 |
| Fixed Asset Turnover | 1.32 | 17.76 |
| Payout ratio | 38.1% | 0 |
| Dividend yield | 1.03% | 0 |
| Fiscal Year | 2025 | 2025 |
Efficiency & Valuation Duel: The Vital Signs
Ratios act as a company’s DNA, revealing hidden risks and operational excellence that shape its investment appeal.
Oracle Corporation
Oracle delivers robust profitability with a striking 60.8% ROE and a healthy 21.7% net margin, signaling operational strength. However, its P/E of 37.1 and P/B of 22.6 mark the stock as stretched relative to earnings. Oracle offers a modest 1.03% dividend yield, balancing shareholder returns with steady reinvestment in R&D.
Palantir Technologies Inc.
Palantir shows solid profitability with a 22.0% ROE and an impressive 36.3% net margin, demonstrating efficient capital use. Yet its valuation is highly expensive, with a P/E exceeding 259 and P/B at 57.0, reflecting growth expectations. Palantir returns no dividend, instead focusing on aggressive reinvestment in R&D to fuel future expansion.
Premium Valuation vs. Operational Safety
Palantir commands a premium valuation backed by strong margins and a growth-oriented model, while Oracle blends high profitability with a more conservative payout. Oracle offers a better risk-reward balance for those valuing income and operational resilience. Palantir suits investors targeting high growth despite valuation extremes.
Which one offers the Superior Shareholder Reward?
I contrast Oracle’s steady dividend yield near 1.03% with Palantir’s zero payout. Oracle’s payout ratio around 38% reflects a balanced distribution supported by stable free cash flow, despite slight negative FCF in 2025. Palantir reinvests aggressively in growth, with minimal capex and no dividends. Buybacks favor Oracle, enabling shareholder returns amid high leverage, while Palantir shows negligible debt and no buybacks. Oracle’s model suits income-focused investors, but Palantir’s reinvestment supports higher long-term capital gains. I judge Oracle offers more sustainable, immediate reward, yet Palantir targets growth-driven investors willing to accept higher risk in 2026.
Comparative Score Analysis: The Strategic Profile
The radar chart reveals the fundamental DNA and trade-offs of Oracle Corporation and Palantir Technologies Inc.:
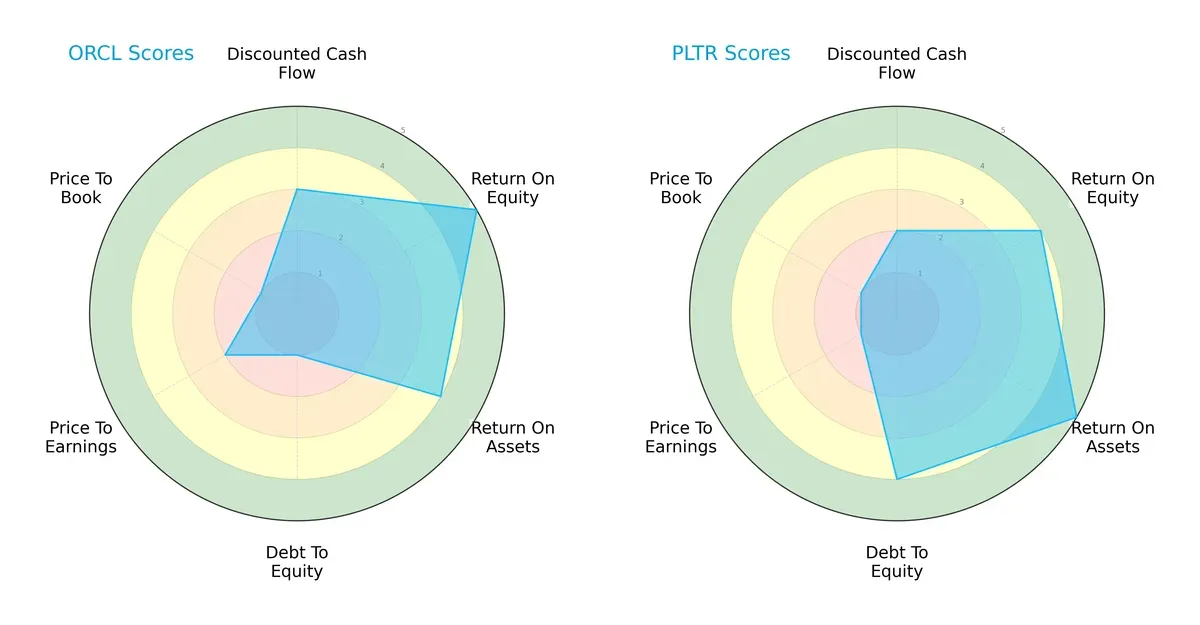
Oracle shows strength in Return on Equity (5) and Return on Assets (4), but its Debt-to-Equity (1) and Price-to-Book (1) scores are weak. Palantir excels in Debt-to-Equity (4) and ROA (5), but lags on Discounted Cash Flow (2) and valuation metrics. Oracle’s profile leans on profitability, while Palantir offers a more balanced financial risk stance.
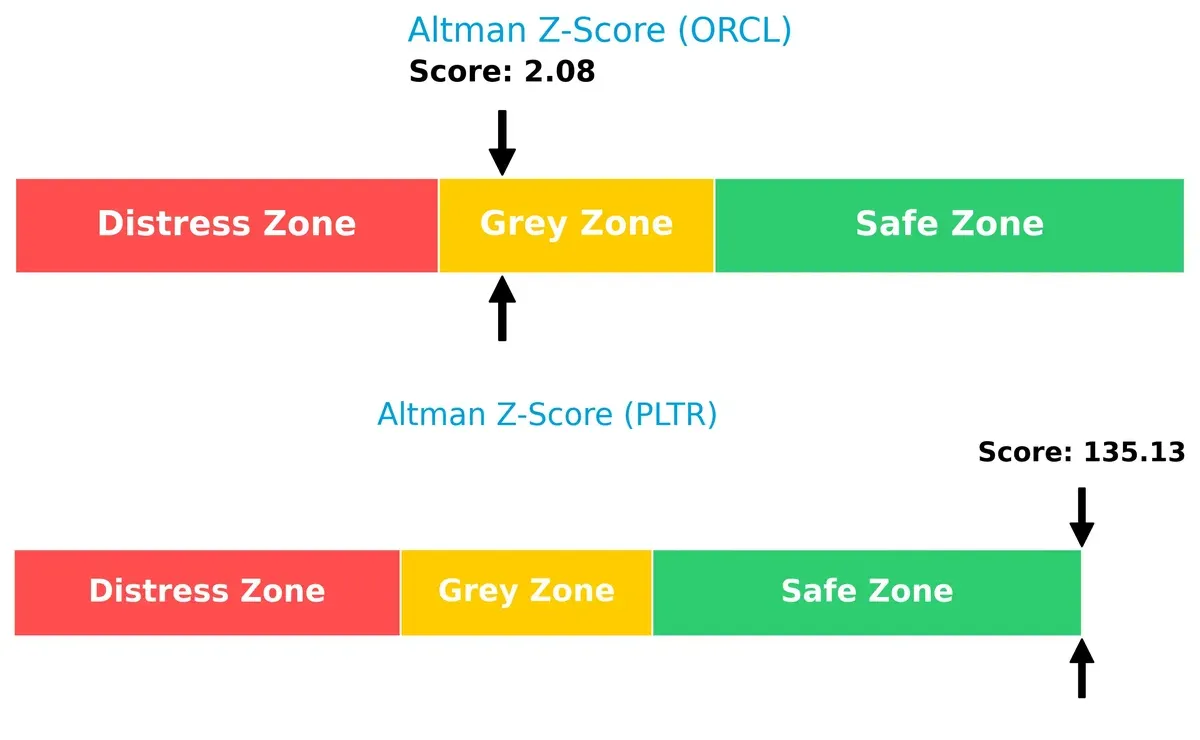
Bankruptcy Risk: Solvency Showdown
Palantir’s Altman Z-Score of 135 places it firmly in the safe zone, signaling strong long-term solvency. Oracle’s 2.08 score lies in the grey zone, implying moderate bankruptcy risk under current market pressures:
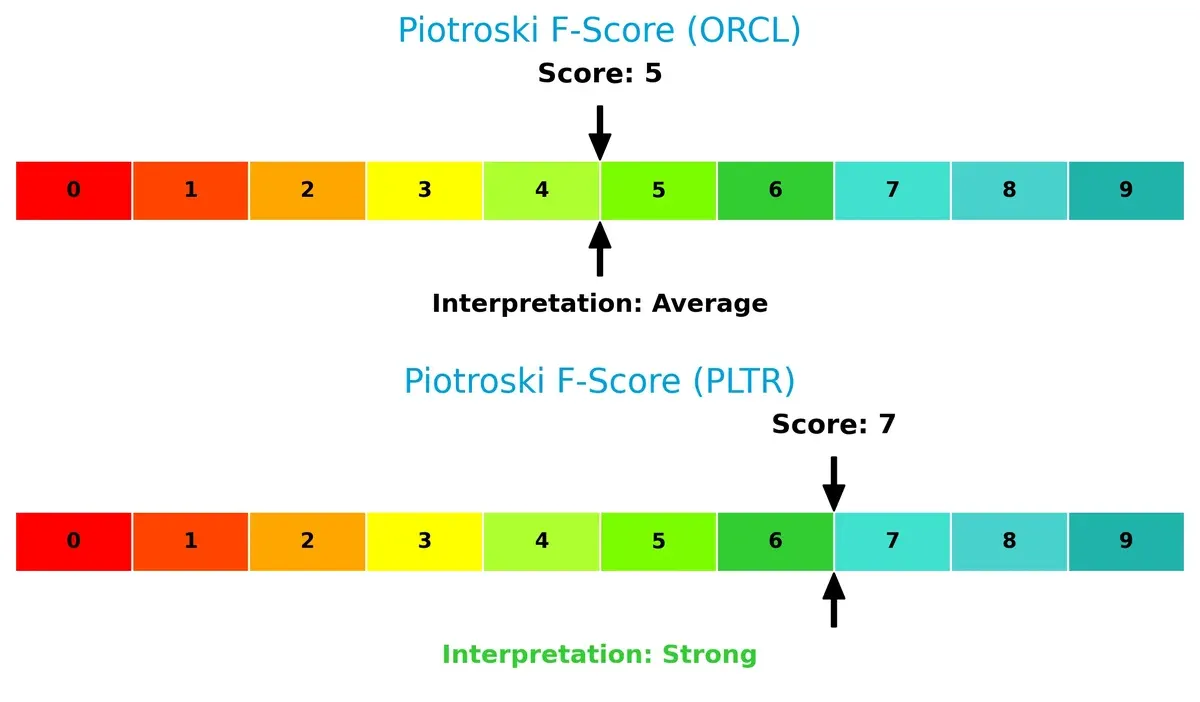
Financial Health: Quality of Operations
Palantir’s Piotroski score of 7 indicates strong financial health, outperforming Oracle’s average score of 5. Oracle’s internal metrics raise caution, while Palantir demonstrates robust operational quality and value potential:
How are the two companies positioned?
This section dissects Oracle and Palantir’s operational DNA by comparing their revenue distribution and internal dynamics. The goal is to confront their economic moats to identify the most resilient, sustainable competitive advantage today.
Revenue Segmentation: The Strategic Mix
This comparison dissects how Oracle Corporation and Palantir Technologies diversify their income streams and where their primary sector bets lie:
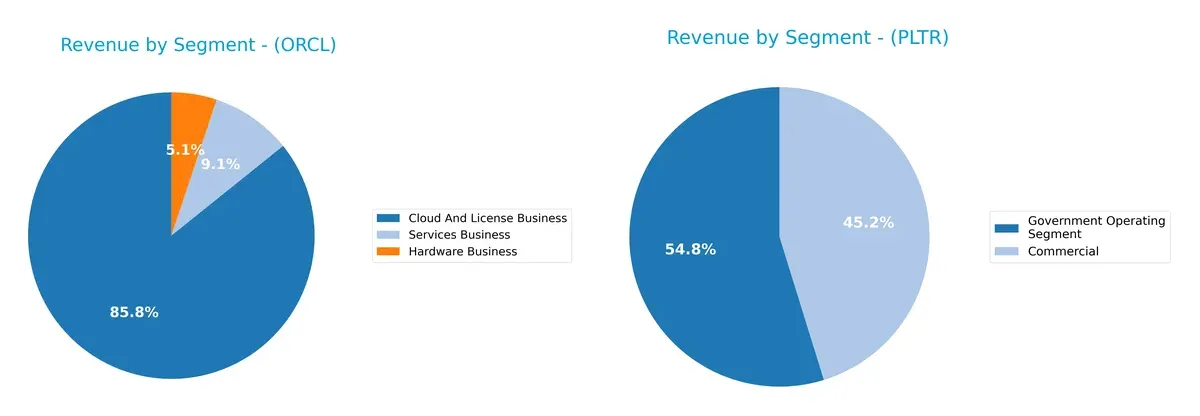
Oracle anchors its revenue in the Cloud And License Business with $49.2B in 2025, dwarfing its Hardware ($2.9B) and Services ($5.2B) segments. This concentration signals a strong ecosystem lock-in around cloud software. Palantir, by contrast, splits its 2024 revenue more evenly between Government ($1.57B) and Commercial ($1.3B) segments, showing a more diversified base. Palantir’s dual focus reduces sector risk but also demands balanced capital allocation to sustain growth across distinct markets.
Strengths and Weaknesses Comparison
This table compares the strengths and weaknesses of Oracle Corporation and Palantir Technologies Inc.:
Oracle Corporation Strengths
- Diversified revenue from Cloud, Hardware, and Services
- Strong global presence with significant Americas, EMEA, Asia Pacific sales
- Favorable profitability metrics: net margin 21.68%, ROE 60.84%, ROIC 10.86%
Palantir Technologies Strengths
- High profitability with net margin 36.31%, ROE 22.0%, ROIC 17.95%
- Low debt levels: debt-to-assets 2.58%, debt/equity 0.03
- Strong innovation indicated by fixed asset turnover 17.76 and infinite interest coverage
Oracle Corporation Weaknesses
- High leverage: debt-to-assets 61.83% and debt/equity 5.09
- Weak liquidity: current and quick ratios 0.75
- Unfavorable valuation multiples: P/E 37.1, P/B 22.57
- Low asset turnover at 0.34, indicating less efficient use of assets
Palantir Technologies Weaknesses
- Unfavorable valuation multiples: P/E 259.19, P/B 57.02
- High weighted average cost of capital at 11.79%
- No dividend yield
- Current ratio unusually high at 7.11, possibly indicating excess idle assets
Overall, Oracle’s strengths lie in its diversified business model and global reach but face risks from high leverage and weak liquidity. Palantir shows superior profitability and low debt but carries valuation risks and lacks dividend income. Each company’s financial profile suggests different strategic priorities regarding capital efficiency and risk management.
The Moat Duel: Analyzing Competitive Defensibility
A structural moat is the only shield protecting long-term profits from relentless competitive erosion. Here’s how Oracle and Palantir stack up:
Oracle Corporation: Legacy Scale and Ecosystem Integration
Oracle’s moat stems from deep ecosystem lock-in and switching costs embedded in enterprise IT. Its stable 30.9% EBIT margin reflects this strength. Yet, declining ROIC warns of rising competitive pressure in cloud markets by 2026.
Palantir Technologies Inc.: Data Network Effects and AI Prowess
Palantir’s moat centers on network effects from proprietary data platforms and advanced AI integration. With a soaring ROIC well above WACC, it aggressively expands revenue and profitability, signaling a widening moat through innovative AI solutions.
Verdict: Ecosystem Lock-in vs. Dynamic Network Effects
Palantir’s rapidly growing ROIC and expanding margins reveal a deeper, more sustainable moat than Oracle’s legacy ecosystem. Palantir appears better positioned to defend and grow market share in 2026’s evolving software landscape.
Which stock offers better returns?
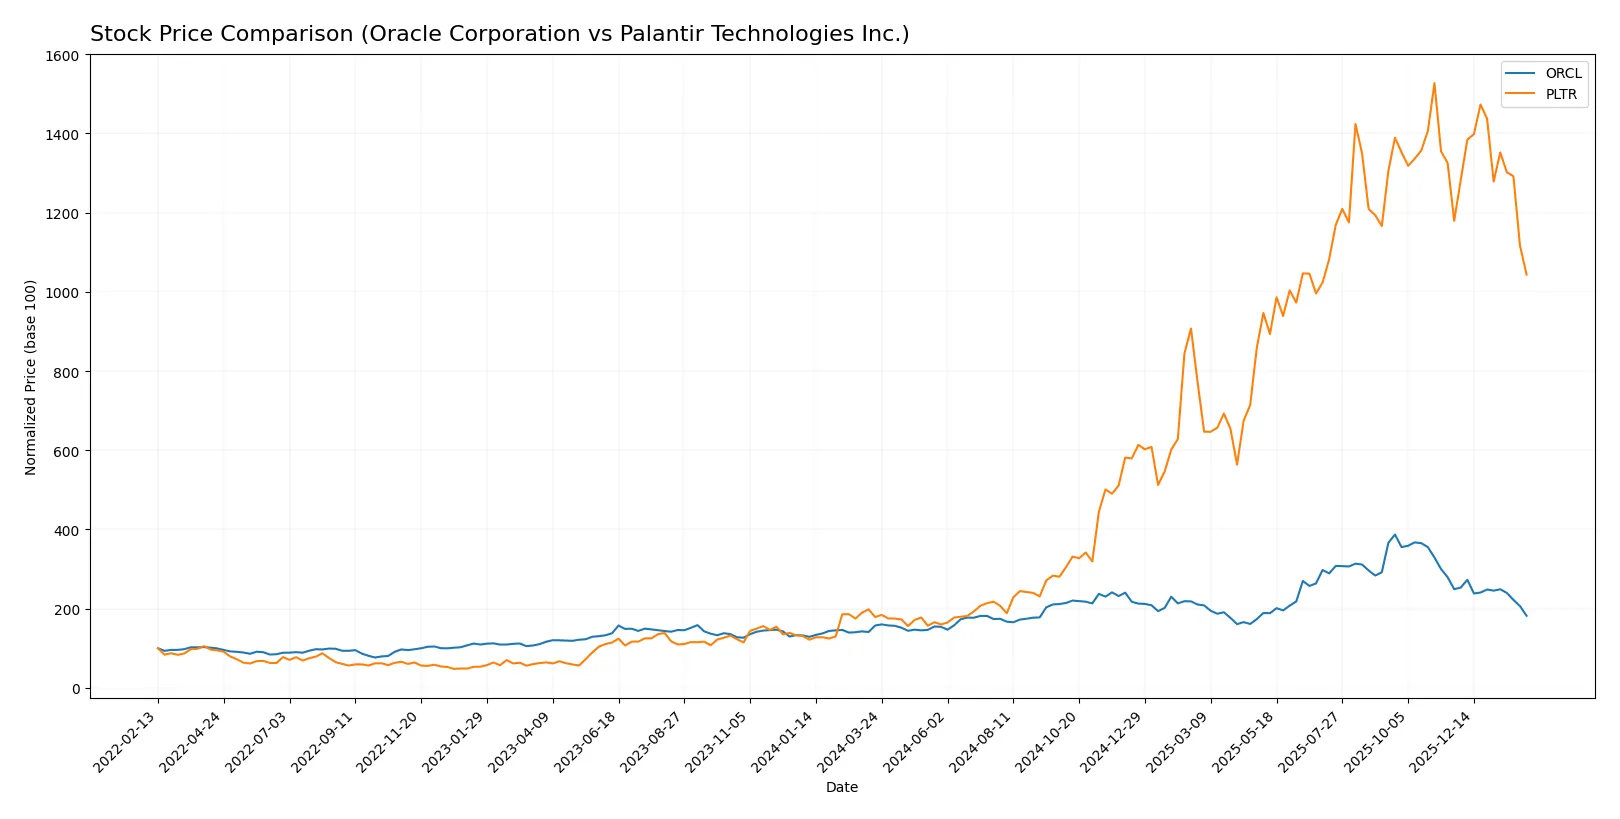
Stock price movements over the past 12 months reveal contrasting trajectories for Oracle Corporation and Palantir Technologies Inc., marked by strong overall gains but notable recent declines in trading dynamics.
Trend Comparison
Oracle’s stock increased 15.57% over the past year, indicating a bullish trend with decelerating momentum. The price ranged widely between 115 and 309, showing strong volatility but slowing upward acceleration.
Palantir’s stock soared 483.27% over the same period, confirming a bullish trend despite deceleration. It displayed higher volatility, with prices moving from 20 to 200, followed by a recent moderate decline.
Palantir outperformed Oracle substantially over 12 months, delivering the highest market returns despite both stocks showing recent downward pressure.
Target Prices
Analysts present a broad target price range for Oracle and Palantir, implying significant upside from current levels.
| Company | Target Low | Target High | Consensus |
|---|---|---|---|
| Oracle Corporation | 175 | 400 | 304.59 |
| Palantir Technologies Inc. | 180 | 230 | 198.8 |
Oracle’s consensus target at 305 suggests a more than 100% potential gain versus its 145 current price. Palantir’s 199 target also implies substantial upside from its 137 price, reflecting strong analyst optimism.

Don’t Let Luck Decide Your Entry Point
Optimize your entry points with our advanced ProRealTime indicators. You’ll get efficient buy signals with precise price targets for maximum performance. Start outperforming now!
How do institutions grade them?
The institutional grades for Oracle Corporation and Palantir Technologies Inc. reflect current analyst sentiment as follows:
Oracle Corporation Grades
The following table summarizes recent institutional grades for Oracle Corporation:
| Grading Company | Action | New Grade | Date |
|---|---|---|---|
| Scotiabank | Maintain | Sector Outperform | 2026-02-03 |
| Piper Sandler | Maintain | Overweight | 2026-02-03 |
| Morgan Stanley | Maintain | Equal Weight | 2026-01-23 |
| UBS | Maintain | Buy | 2026-01-05 |
| Jefferies | Maintain | Buy | 2026-01-05 |
| RBC Capital | Maintain | Sector Perform | 2026-01-05 |
| Goldman Sachs | Maintain | Neutral | 2025-12-12 |
| Guggenheim | Maintain | Buy | 2025-12-11 |
| TD Cowen | Maintain | Buy | 2025-12-11 |
| UBS | Maintain | Buy | 2025-12-11 |
Palantir Technologies Inc. Grades
The following table summarizes recent institutional grades for Palantir Technologies Inc.:
| Grading Company | Action | New Grade | Date |
|---|---|---|---|
| Citigroup | Maintain | Buy | 2026-02-03 |
| UBS | Maintain | Neutral | 2026-02-03 |
| DA Davidson | Maintain | Neutral | 2026-02-03 |
| Citigroup | Upgrade | Buy | 2026-01-12 |
| Morgan Stanley | Maintain | Equal Weight | 2025-11-04 |
| Piper Sandler | Maintain | Overweight | 2025-11-04 |
| Goldman Sachs | Maintain | Neutral | 2025-11-04 |
| Baird | Maintain | Neutral | 2025-11-04 |
| B of A Securities | Maintain | Buy | 2025-11-04 |
| UBS | Maintain | Neutral | 2025-11-04 |
Which company has the best grades?
Oracle Corporation consistently receives higher grades, including multiple “Buy” and “Overweight” ratings. Palantir’s ratings skew toward “Neutral” and “Equal Weight.” Stronger grades for Oracle suggest greater institutional confidence, potentially influencing investor sentiment more positively.
Risks specific to each company
The following categories identify critical pressure points and systemic threats facing Oracle Corporation and Palantir Technologies Inc. in the 2026 market environment:
1. Market & Competition
Oracle Corporation
- Established global presence with diversified cloud solutions but faces fierce competition from major tech players.
Palantir Technologies Inc.
- Rapid growth in data analytics with niche government contracts; competitive pressure from larger cloud and AI firms.
2. Capital Structure & Debt
Oracle Corporation
- High debt-to-assets ratio (61.8%) signals elevated financial leverage and risk.
Palantir Technologies Inc.
- Very low debt levels (2.6% debt-to-assets) indicate conservative capital structure and lower financial risk.
3. Stock Volatility
Oracle Corporation
- Beta of 1.63 implies above-market volatility; price range wide but relatively stable volume.
Palantir Technologies Inc.
- Beta of 1.69 indicates high volatility; recent price drop of over 13% suggests sensitivity to market shifts.
4. Regulatory & Legal
Oracle Corporation
- Subject to global data privacy laws and antitrust scrutiny due to size and market influence.
Palantir Technologies Inc.
- Heavy government contract exposure increases regulatory risk but benefits from long-term agreements.
5. Supply Chain & Operations
Oracle Corporation
- Complex hardware and software supply chains vulnerable to disruption and cost inflation.
Palantir Technologies Inc.
- Primarily software-based, reducing supply chain risks, but dependent on cloud infrastructure providers.
6. ESG & Climate Transition
Oracle Corporation
- Larger carbon footprint due to hardware operations; faces pressure to decarbonize data centers.
Palantir Technologies Inc.
- Smaller environmental impact; growing focus on ethical AI and governance practices.
7. Geopolitical Exposure
Oracle Corporation
- Global operations expose it to trade tensions, especially US-China relations.
Palantir Technologies Inc.
- Concentrated US and allied government contracts limit geopolitical risk but constrain diversification.
Which company shows a better risk-adjusted profile?
Oracle’s greatest risk lies in its heavy debt burden, which amplifies financial vulnerability despite solid operating performance. Palantir’s key risk is extreme stock volatility driven by market sentiment and high valuation multiples. Palantir’s robust balance sheet and superior Altman Z-score indicate a safer financial footing. However, its stock price swings and regulatory dependence elevate risk. Oracle’s leverage is a red flag amid rising interest rates, justifying caution. Overall, Palantir offers a better risk-adjusted profile due to stronger balance sheet metrics and operational agility despite higher market volatility.
Final Verdict: Which stock to choose?
Oracle’s superpower lies in its established cash generation and solid profitability, underpinned by a robust enterprise software franchise. However, its heavy leverage and weak liquidity ratios require vigilance. It fits well in portfolios seeking stable income with a tolerance for financial risk.
Palantir commands a strategic moat through its data analytics platform, benefiting from rapid revenue growth and improving returns on capital. Its pristine balance sheet offers better financial safety than Oracle’s. Palantir suits growth-oriented investors favoring long-term capital appreciation with some patience for valuation volatility.
If you prioritize resilient cash flow and proven profitability, Oracle is a compelling choice despite its financial leverage. However, if you seek dynamic growth and a sustainable moat with cleaner finances, Palantir outshines Oracle by offering superior expansion prospects and stability. Both present distinct analytical scenarios depending on your risk and return profile.
Disclaimer: Investment carries a risk of loss of initial capital. The past performance is not a reliable indicator of future results. Be sure to understand risks before making an investment decision.
Go Further
I encourage you to read the complete analyses of Oracle Corporation and Palantir Technologies Inc. to enhance your investment decisions: