In the rapidly evolving semiconductor industry, Tower Semiconductor Ltd. and Onto Innovation Inc. stand out as key players driving innovation and market growth. Tower Semiconductor specializes in analog and mixed-signal foundry services, while Onto Innovation focuses on advanced process control tools and metrology solutions. This comparison highlights their strategic approaches and market overlaps, helping investors identify which company offers the most promising investment potential in 2026. Let’s dive into their strengths to find your best portfolio candidate.
Table of contents
Companies Overview
I will begin the comparison between Tower Semiconductor Ltd. and Onto Innovation Inc. by providing an overview of these two companies and their main differences.
Tower Semiconductor Ltd. Overview
Tower Semiconductor Ltd. is an independent semiconductor foundry specializing in analog intensive mixed-signal semiconductor devices. It offers a variety of customizable process technologies and wafer fabrication services to integrated device manufacturers and fabless companies. The company serves diverse markets including consumer electronics, automotive, aerospace, and medical devices, operating globally with headquarters in Israel.
Onto Innovation Inc. Overview
Onto Innovation Inc. designs and manufactures process control tools for macro defect inspection, optical metrology, lithography, and analytical software for the semiconductor industry. Its product portfolio supports semiconductor and advanced packaging device manufacturers worldwide. The company, headquartered in Massachusetts, provides comprehensive process and yield management solutions alongside device packaging and test facilities.
Key similarities and differences
Both companies operate in the semiconductor industry but focus on different segments: Tower Semiconductor on foundry and fabrication services, and Onto Innovation on process control and metrology tools. Tower has a larger workforce and market cap, while Onto emphasizes software and equipment solutions. Their geographic bases differ, with Tower in Israel and Onto in the US, reflecting diverse market approaches within the broader technology sector.
Income Statement Comparison
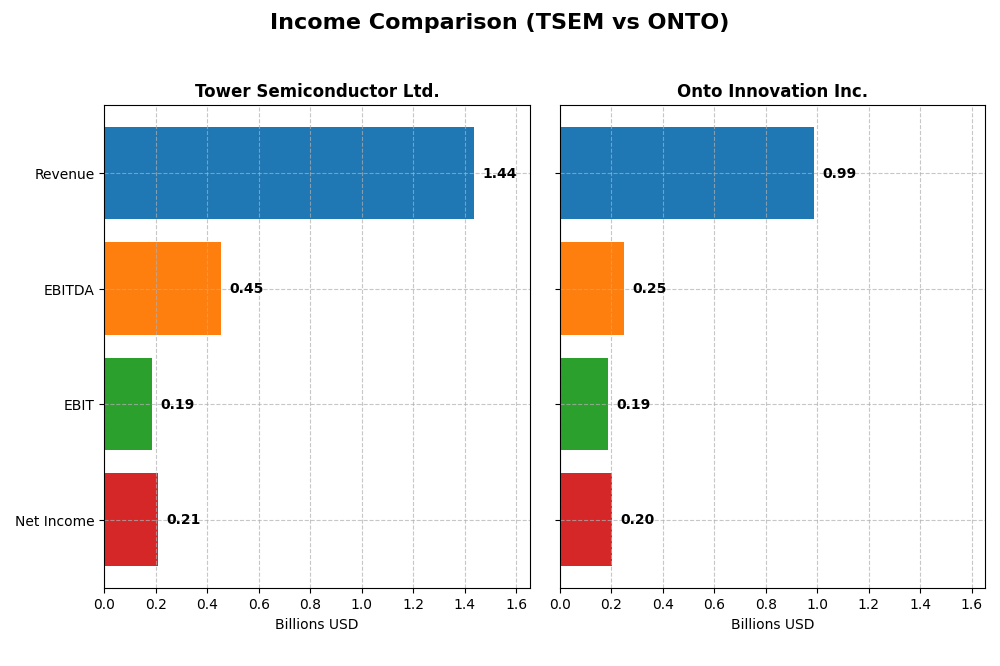
Below is a comparison of key income statement metrics for Tower Semiconductor Ltd. and Onto Innovation Inc. based on their most recent fiscal year results.
| Metric | Tower Semiconductor Ltd. (TSEM) | Onto Innovation Inc. (ONTO) |
|---|---|---|
| Market Cap | 13.9B USD | 10.7B USD |
| Revenue | 1.44B USD | 987M USD |
| EBITDA | 451M USD | 249M USD |
| EBIT | 185M USD | 187M USD |
| Net Income | 208M USD | 202M USD |
| EPS | 1.87 USD | 4.09 USD |
| Fiscal Year | 2024 | 2024 |
Income Statement Interpretations
Tower Semiconductor Ltd.
Tower Semiconductor’s revenue showed a moderate increase of 13.47% over 2020-2024, but growth slowed to 0.94% in 2024. Net income surged 152.56% overall but declined sharply by 60.29% in the latest year. Margins remain favorable, with a gross margin of 23.64% and net margin of 14.47%. However, earnings and operating income contracted significantly in 2024.
Onto Innovation Inc.
Onto Innovation demonstrated robust revenue growth of 77.42% from 2020 to 2024, accelerating 21.01% in the last year. Net income soared 550.02% overall and rose 37.55% in 2024. Margins are strong, with a gross margin of 52.19% and net margin of 20.43%. EBIT and EPS growth were notably positive, reflecting solid operational leverage in the most recent period.
Which one has the stronger fundamentals?
Onto Innovation exhibits stronger fundamentals, with consistent favorable growth across all income metrics and superior margin expansion. Tower Semiconductor, while having favorable margins overall, faced a significant earnings decline in 2024 and slower revenue growth. Onto’s comprehensive margin strength and accelerating profitability suggest more robust financial health in the current context.
Financial Ratios Comparison
The table below presents the most recent key financial ratios for Tower Semiconductor Ltd. (TSEM) and Onto Innovation Inc. (ONTO), reflecting their performance and financial health as of fiscal year 2024.
| Ratios | Tower Semiconductor Ltd. (TSEM) | Onto Innovation Inc. (ONTO) |
|---|---|---|
| ROE | 7.83% | 10.47% |
| ROIC | 6.41% | 8.77% |
| P/E | 27.54 | 41.76 |
| P/B | 2.16 | 4.37 |
| Current Ratio | 6.18 | 8.69 |
| Quick Ratio | 5.23 | 7.00 |
| D/E (Debt-to-Equity) | 0.068 | 0.008 |
| Debt-to-Assets | 5.87% | 0.72% |
| Interest Coverage | 32.64 | 0 |
| Asset Turnover | 0.47 | 0.47 |
| Fixed Asset Turnover | 1.11 | 7.16 |
| Payout Ratio | 0 | 0 |
| Dividend Yield | 0 | 0 |
Interpretation of the Ratios
Tower Semiconductor Ltd.
Tower Semiconductor shows a mixed picture with 43% favorable ratios but 36% unfavorable, resulting in a slightly favorable overall view. Its net margin is healthy at 14.47%, but return on equity at 7.83% is weak. The high current ratio of 6.18 may indicate inefficient capital use. Tower does not pay dividends, likely focusing on reinvestment and growth.
Onto Innovation Inc.
Onto Innovation presents a neutral ratio profile with equal favorable and unfavorable shares at 43%. It boasts a stronger net margin of 20.43% and a higher return on equity of 10.47%, though a high price-to-earnings ratio of 41.76 and price-to-book of 4.37 raise valuation concerns. Onto also pays no dividends, suggesting reinvestment and innovation priorities.
Which one has the best ratios?
Both companies share the same proportion of favorable ratios, but Tower Semiconductor’s slightly favorable stance contrasts with Onto Innovation’s neutral rating. Tower’s stronger liquidity and lower debt levels are positives, yet Onto’s higher profitability metrics are offset by valuation and liquidity concerns, making neither decisively superior on ratios alone.
Strategic Positioning
This section compares the strategic positioning of Tower Semiconductor Ltd. and Onto Innovation Inc., focusing on market position, key segments, and exposure to technological disruption:
Tower Semiconductor Ltd.
- Independent semiconductor foundry with global presence in analog and mixed-signal devices facing semiconductor industry competition.
- Serves diverse markets including consumer electronics, automotive, aerospace, and medical devices with customizable technologies.
- Exposed to semiconductor manufacturing technology shifts, relying on customizable analog and mixed-signal fabrication processes.
Onto Innovation Inc.
- Designs and manufactures process control tools for semiconductor manufacturing, competing in metrology and inspection segments.
- Revenue driven mainly by systems and software, parts and services, focused on process control and yield management solutions.
- Faces disruption risks in advanced lithography and metrology technologies with continuous innovation in inspection and software.
Tower Semiconductor Ltd. vs Onto Innovation Inc. Positioning
Tower Semiconductor offers broad market exposure across various semiconductor device applications, leveraging customizable fabrication technologies. Onto Innovation concentrates on process control tools and software, driving revenue through specialized inspection and metrology systems. Tower’s diversification contrasts with Onto’s focused product portfolio.
Which has the best competitive advantage?
Both companies show slightly unfavorable MOATs, shedding value but with improving ROIC trends. Tower Semiconductor’s broader market scope offers diversified risk, while Onto Innovation’s specialized process control focus may face higher disruption, reflecting comparable competitive challenges.
Stock Comparison
The stock prices of Tower Semiconductor Ltd. and Onto Innovation Inc. have shown strong upward momentum over the past year, with significant gains and active buyer dominance shaping trading dynamics.
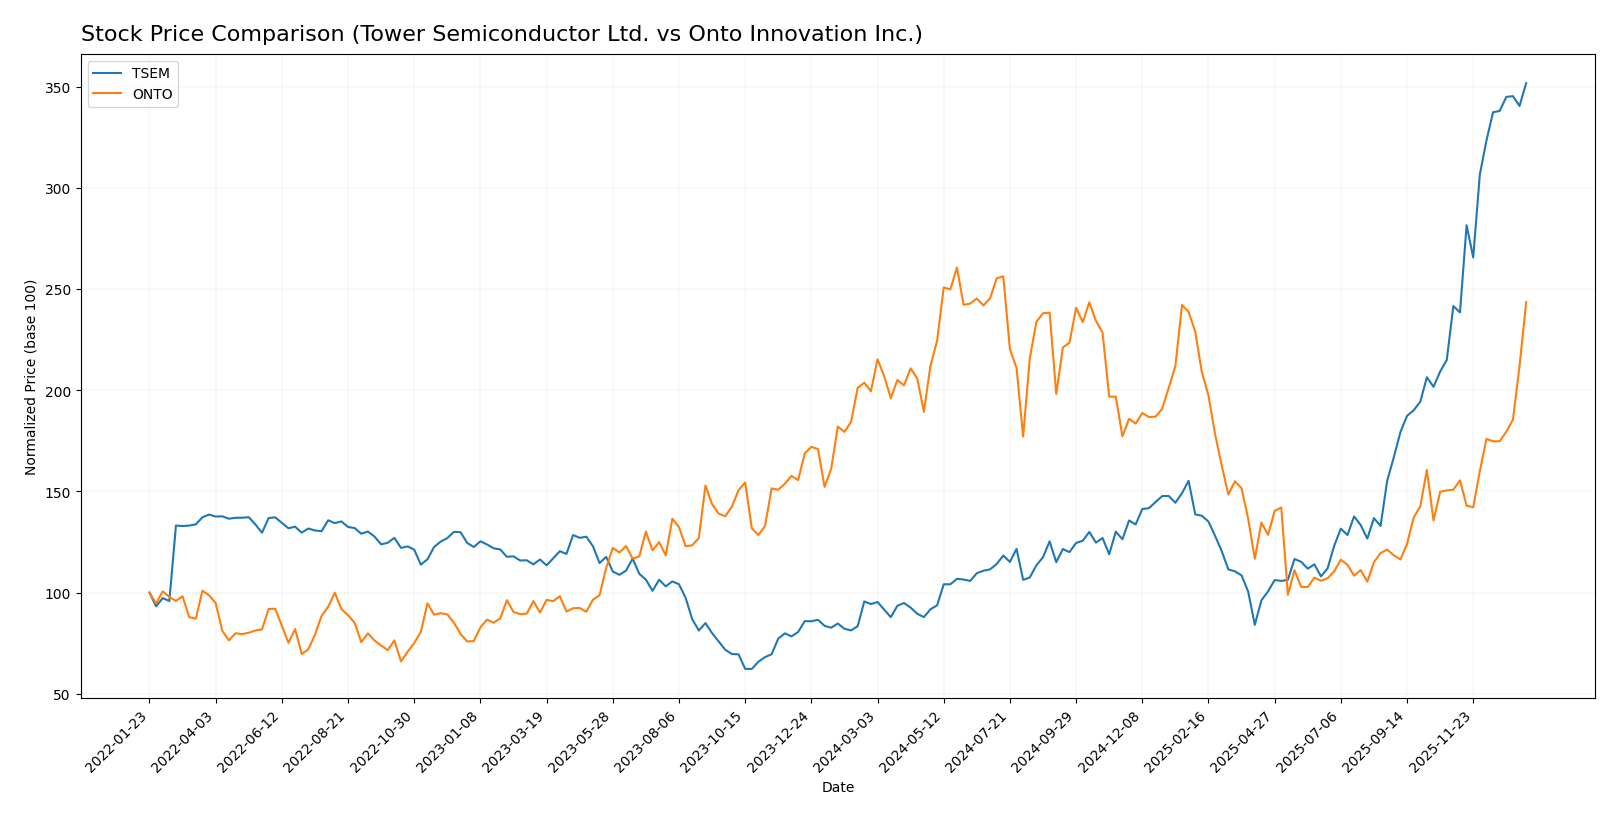
Trend Analysis
Tower Semiconductor Ltd. (TSEM) exhibits a bullish trend over the past 12 months with a 272.71% price increase, characterized by accelerating gains and a standard deviation of 23.67, peaking at 124.0 and bottoming at 29.65.
Onto Innovation Inc. (ONTO) also shows a bullish trend with a 22.07% increase over the same period, supported by acceleration and a higher volatility (std deviation 42.61), reaching a high of 233.14 and a low of 88.5.
Comparing the two, TSEM has delivered the highest market performance with a substantially larger price gain, despite ONTO’s higher volatility and recent stronger short-term price acceleration.
Target Prices
The current target price consensus reflects mixed expectations for these semiconductor companies.
| Company | Target High | Target Low | Consensus |
|---|---|---|---|
| Tower Semiconductor Ltd. | 125 | 66 | 96 |
| Onto Innovation Inc. | 200 | 160 | 178 |
Tower Semiconductor’s consensus target of $96 is slightly below its current price of $124, suggesting limited upside or possible overvaluation. Onto Innovation’s consensus target of $178 is well below its current $218 price, indicating analysts expect a potential price correction.
Analyst Opinions Comparison
This section compares analysts’ ratings and grades for Tower Semiconductor Ltd. (TSEM) and Onto Innovation Inc. (ONTO):
Rating Comparison
TSEM Rating
- Rating: B+, considered very favorable by analysts.
- Discounted Cash Flow Score: Moderate at 3/5.
- ROE Score: Moderate at 3/5, showing average efficiency.
- ROA Score: Favorable at 4/5, indicating effective asset use.
- Debt To Equity Score: Favorable at 4/5, reflecting solid financial stability.
- Overall Score: Moderate at 3/5.
ONTO Rating
- Rating: B+, considered very favorable by analysts.
- Discounted Cash Flow Score: Moderate at 3/5.
- ROE Score: Moderate at 3/5, showing average efficiency.
- ROA Score: Favorable at 4/5, indicating effective asset use.
- Debt To Equity Score: Favorable at 4/5, reflecting solid financial stability.
- Overall Score: Moderate at 3/5.
Which one is the best rated?
Both TSEM and ONTO share identical overall ratings and scores across key financial metrics. Neither company shows a clear advantage based strictly on the provided ratings and scores.
Scores Comparison
Here is a comparison of the Altman Z-Score and Piotroski Score for Tower Semiconductor Ltd. and Onto Innovation Inc.:
TSEM Scores
- Altman Z-Score: 21.06, indicating a safe zone with very low bankruptcy risk.
- Piotroski Score: 7, classified as strong financial health.
ONTO Scores
- Altman Z-Score: 34.16, also in the safe zone showing very low bankruptcy risk.
- Piotroski Score: 4, reflecting average financial strength.
Which company has the best scores?
Based on the provided data, ONTO has a higher Altman Z-Score than TSEM, suggesting lower bankruptcy risk. However, TSEM’s Piotroski Score is stronger, indicating better overall financial health. Both companies show financial safety but differ in strength metrics.
Grades Comparison
The following is a comparison of the recent grades and ratings for Tower Semiconductor Ltd. and Onto Innovation Inc.:
Tower Semiconductor Ltd. Grades
This table summarizes the recent grades assigned to Tower Semiconductor Ltd. by reputable grading companies.
| Grading Company | Action | New Grade | Date |
|---|---|---|---|
| Benchmark | Maintain | Buy | 2026-01-09 |
| Wedbush | Downgrade | Neutral | 2025-12-31 |
| Benchmark | Maintain | Buy | 2025-11-11 |
| Susquehanna | Maintain | Positive | 2025-11-11 |
| Wedbush | Maintain | Outperform | 2025-11-11 |
| Barclays | Maintain | Equal Weight | 2025-11-11 |
| Benchmark | Maintain | Buy | 2025-09-08 |
| Susquehanna | Maintain | Positive | 2025-08-05 |
| Benchmark | Maintain | Buy | 2025-08-05 |
| Benchmark | Maintain | Buy | 2025-08-04 |
The overall trend for Tower Semiconductor shows mostly stable buy and positive ratings, with a single recent downgrade from Wedbush to neutral, indicating cautious optimism.
Onto Innovation Inc. Grades
This table presents the latest grades for Onto Innovation Inc. from recognized grading firms.
| Grading Company | Action | New Grade | Date |
|---|---|---|---|
| Stifel | Maintain | Hold | 2026-01-14 |
| Needham | Maintain | Buy | 2026-01-06 |
| Jefferies | Maintain | Buy | 2025-12-15 |
| B. Riley Securities | Maintain | Buy | 2025-11-18 |
| Needham | Maintain | Buy | 2025-11-18 |
| Evercore ISI Group | Maintain | Outperform | 2025-11-05 |
| Oppenheimer | Maintain | Outperform | 2025-10-14 |
| Stifel | Maintain | Hold | 2025-10-13 |
| B. Riley Securities | Maintain | Buy | 2025-10-10 |
| Jefferies | Upgrade | Buy | 2025-09-23 |
Onto Innovation’s grades reveal a consistent buy and outperform trend, with a few hold ratings reflecting selective analyst caution.
Which company has the best grades?
Both companies carry a consensus “Buy” rating, but Tower Semiconductor’s grades are steadier with multiple buy and positive ratings, while Onto Innovation shows slightly more variability with hold ratings. This suggests Tower Semiconductor may be viewed as a more stable investment option by analysts, potentially affecting investor confidence and risk assessment.
Strengths and Weaknesses
Below is a comparative table highlighting the key strengths and weaknesses of Tower Semiconductor Ltd. (TSEM) and Onto Innovation Inc. (ONTO) based on the latest financial and operational data.
| Criterion | Tower Semiconductor Ltd. (TSEM) | Onto Innovation Inc. (ONTO) |
|---|---|---|
| Diversification | Moderate product range, mostly semiconductor manufacturing | Highly diversified with Systems & Software, Parts, and Services segments |
| Profitability | Net margin 14.47% (favorable); ROIC 6.41% (neutral); ROE 7.83% (unfavorable) | Net margin 20.43% (favorable); ROIC 8.77% (neutral); ROE 10.47% (neutral) |
| Innovation | Steady ROIC growth but overall value destruction (Slightly Unfavorable moat) | Strong ROIC growth; yet value is being shed (Slightly Unfavorable moat) |
| Global presence | Solid but less diversified internationally | Broad global footprint, supported by varied product lines and services |
| Market Share | Stable but limited by competitive pressures | Expanding market share driven by software and systems revenue growth |
Key takeaways: Both companies show improving profitability trends but are currently shedding value, indicating cautious optimism. Onto Innovation offers greater diversification and higher profitability, while Tower Semiconductor maintains steady operational metrics with room for efficiency gains. Investors should weigh growth potential against the risk of value erosion.
Risk Analysis
Below is a comparative table highlighting key risks for Tower Semiconductor Ltd. (TSEM) and Onto Innovation Inc. (ONTO) based on the most recent 2024 data:
| Metric | Tower Semiconductor Ltd. (TSEM) | Onto Innovation Inc. (ONTO) |
|---|---|---|
| Market Risk | Moderate (Beta 0.876, stable range) | Higher (Beta 1.461, volatile range) |
| Debt level | Very low (Debt/Equity 0.07) | Very low (Debt/Equity 0.01) |
| Regulatory Risk | Moderate (global semiconductor regulations exposure) | Moderate (US technology sector regulations) |
| Operational Risk | Moderate (diverse fab services, 5613 employees) | Moderate (smaller scale, 1551 employees) |
| Environmental Risk | Moderate (manufacturing footprint in Israel and Asia) | Moderate (manufacturing and software development in US) |
| Geopolitical Risk | Elevated (Israeli base, geopolitical tensions in region) | Moderate (US-based, less geopolitical exposure) |
In synthesis, Onto Innovation exhibits higher market volatility risk due to its elevated beta and narrower operational scale, but both companies maintain low debt levels, reducing financial risk. Tower Semiconductor faces more significant geopolitical risk due to its Israel headquarters amid regional tensions, which could impact supply chains and operations. Investors should weigh these factors carefully, considering Onto’s stronger net margins but higher valuation multiples, alongside Tower’s stable financial footing but geopolitical vulnerabilities.
Which Stock to Choose?
Tower Semiconductor Ltd. (TSEM) shows a favorable income statement overall, with a 13.47% revenue growth and 152.56% net income growth over 2020-2024, yet recent one-year metrics indicate declines. Its financial ratios are slightly favorable, with strong liquidity and low debt, though some ratios like ROE and asset turnover appear less favorable. The company’s rating is very favorable (B+), supported by strong Altman Z-Score and Piotroski Score, despite a slightly unfavorable moat due to ROIC below WACC.
Onto Innovation Inc. (ONTO) demonstrates a fully favorable income statement, marked by robust 77.42% revenue growth and 550.02% net income growth overall, alongside positive one-year gains. The financial ratios are neutral overall, with strong margins and low debt, but elevated valuation multiples and a higher WACC weigh negatively. Its rating matches TSEM’s at very favorable (B+), with an excellent Altman Z-Score but a moderate Piotroski Score, and a similarly slightly unfavorable moat reflecting ROIC below WACC.
Considering ratings and financial evaluations, TSEM might appeal to investors prioritizing financial stability and value creation with its strong balance sheet and profitability improvement trend. ONTO could be more attractive to growth-oriented investors focusing on robust income growth and operational expansion, despite higher valuation and moderate financial health scores. Both stocks show potential but entail distinct profiles aligned with different investment strategies.
Disclaimer: Investment carries a risk of loss of initial capital. The past performance is not a reliable indicator of future results. Be sure to understand risks before making an investment decision.
Go Further
I encourage you to read the complete analyses of Tower Semiconductor Ltd. and Onto Innovation Inc. to enhance your investment decisions: