Home > Comparison > Technology > TXN vs ONTO
The strategic rivalry between Texas Instruments Incorporated and Onto Innovation Inc. shapes the semiconductor industry’s future. Texas Instruments operates as a capital-intensive industrial giant, focusing on analog and embedded processing products. Onto Innovation, by contrast, specializes in high-precision process control tools and software for wafer manufacturing. This analysis dissects their competing business models to identify which offers a superior risk-adjusted trajectory for a diversified portfolio in this dynamic technology sector.
Table of contents
Companies Overview
Texas Instruments and Onto Innovation stand as key players in the semiconductor landscape, each shaping critical technology domains.
Texas Instruments Incorporated: Analog and Embedded Processing Leader
Texas Instruments dominates the semiconductor industry with a focus on analog and embedded processing products. Its revenue primarily stems from power management and signal processing solutions across industrial, automotive, and personal electronics markets. In 2026, TI emphasizes expanding its power product portfolio and enhancing microcontroller offerings to sustain its broad market footprint.
Onto Innovation Inc.: Process Control and Metrology Specialist
Onto Innovation excels in process control tools and analytical software for semiconductor manufacturing. Its core revenue derives from defect inspection systems, lithography, and yield management software used globally by chipmakers. The company’s 2026 strategy centers on advancing lithography and metrology solutions to meet rising precision demands in advanced packaging and device fabrication.
Strategic Collision: Similarities & Divergences
Both firms operate within semiconductors but pursue distinct philosophies: Texas Instruments focuses on broad, diversified analog and embedded solutions, while Onto Innovation targets specialized process control and manufacturing precision. Their primary battleground lies in semiconductor production efficiency versus end-device integration. Investors face contrasting profiles—TI offers scale and stability, Onto Innovation presents niche growth potential with higher volatility.
Income Statement Comparison
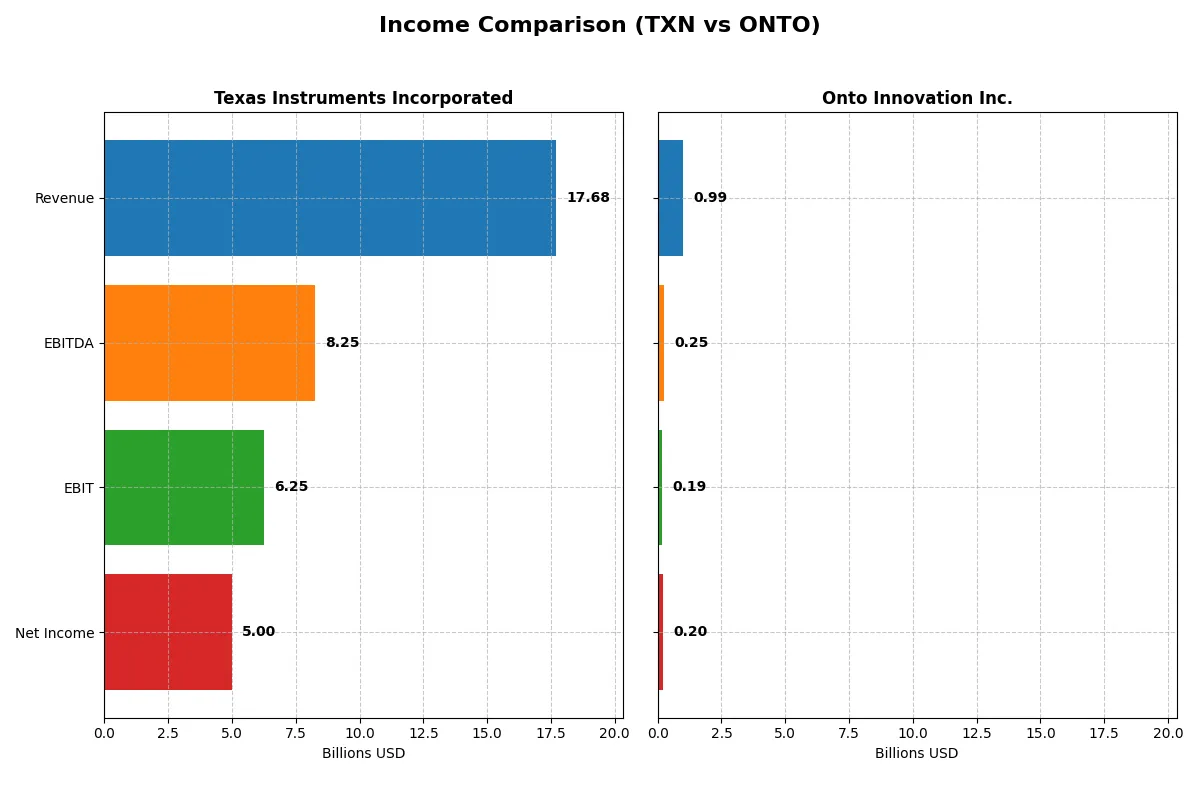
This data dissects the core profitability and scalability of both corporate engines to reveal who dominates the bottom line:
| Metric | Texas Instruments Incorporated (TXN) | Onto Innovation Inc. (ONTO) |
|---|---|---|
| Revenue | 17.7B | 987M |
| Cost of Revenue | 7.6B | 472M |
| Operating Expenses | 4.1B | 328M |
| Gross Profit | 10.1B | 515M |
| EBITDA | 8.3B | 249M |
| EBIT | 6.3B | 187M |
| Interest Expense | 543M | 0 |
| Net Income | 5.0B | 202M |
| EPS | 5.45 | 4.09 |
| Fiscal Year | 2025 | 2024 |
Income Statement Analysis: The Bottom-Line Duel
This income statement comparison reveals how efficiently Texas Instruments and Onto Innovation convert revenue into profit and growth.
Texas Instruments Incorporated Analysis
Texas Instruments shows a mixed revenue trend, peaking at 20B in 2022 before declining to 17.7B in 2025. Net income fell sharply from 8.7B in 2022 to 5B in 2025, compressing net margins to 28.3%. Despite this, gross margin remains strong at 57%, and EBIT margin holds favorably at 35%, signaling resilient operational efficiency amid recent headwinds.
Onto Innovation Inc. Analysis
Onto Innovation presents robust growth, expanding revenue from 556M in 2020 to 987M in 2024. Net income surged impressively by over 550%, reaching 202M in 2024, boosting net margins to 20.4%. Its gross margin at 52% and EBIT margin near 19% improved significantly, reflecting accelerating profitability and efficient expense management over the last year.
Growth Momentum vs. Scale and Margin Strength
Onto Innovation outpaces Texas Instruments with higher revenue and net income growth rates, showcasing dynamic expansion and margin improvement. Texas Instruments commands superior scale and margin levels but struggles with declining net income and margin contraction. Investors favoring growth and momentum may find Onto’s profile more compelling, while those prioritizing scale and established profitability may lean toward Texas Instruments.
Financial Ratios Comparison
These vital ratios act as a diagnostic tool to expose the underlying fiscal health, valuation premiums, and capital efficiency of these companies:
| Ratios | Texas Instruments (TXN) | Onto Innovation (ONTO) |
|---|---|---|
| ROE | 30.7% | 10.5% |
| ROIC | 16.5% | 8.8% |
| P/E | 31.5 | 41.8 |
| P/B | 9.7 | 4.4 |
| Current Ratio | 4.35 | 8.69 |
| Quick Ratio | 2.83 | 7.00 |
| D/E (Debt-to-Equity) | 0.86 | 0.008 |
| Debt-to-Assets | 40.6% | 0.7% |
| Interest Coverage | 11.1 | 0 |
| Asset Turnover | 0.51 | 0.47 |
| Fixed Asset Turnover | 1.44 | 7.16 |
| Payout Ratio | 100.0% | 0% |
| Dividend Yield | 3.17% | 0% |
| Fiscal Year | 2025 | 2024 |
Efficiency & Valuation Duel: The Vital Signs
Ratios act as a company’s DNA, unveiling hidden risks and operational excellence that raw numbers alone cannot capture.
Texas Instruments Incorporated
Texas Instruments delivers strong profitability with a 30.7% ROE and a solid 28.3% net margin. The stock trades at a stretched P/E of 31.5 and a high P/B of 9.7, indicating premium valuation. It rewards shareholders with a 3.17% dividend yield, reflecting disciplined capital allocation alongside steady reinvestment in R&D.
Onto Innovation Inc.
Onto Innovation shows moderate profitability with a 10.5% ROE and a 20.4% net margin. The valuation appears stretched, with a P/E at 41.8 and P/B of 4.4. It does not pay dividends, instead focusing capital on growth and innovation, supported by favorable debt metrics and a strong quick ratio of 7.0.
Premium Valuation vs. Operational Safety
Texas Instruments balances superior profitability with a premium valuation but compensates with shareholder dividends and robust R&D. Onto Innovation trades at higher multiples with lower returns but maintains financial safety through minimal debt. Investors seeking income and efficiency may prefer Texas Instruments; growth-focused investors might lean toward Onto’s profile.
Which one offers the Superior Shareholder Reward?
Texas Instruments (TXN) delivers consistent dividends with a 3.17% yield and a near 100% payout ratio, supported by ample free cash flow (~$2.9/share). TXN also executes moderate buybacks, balancing shareholder returns and reinvestment. Onto Innovation (ONTO) pays no dividends but reinvests heavily in growth and R&D, with buybacks less prominent. TXN’s dividend model appears more sustainable given its strong cash coverage and stable margins. I conclude TXN offers a more attractive total return profile in 2026, blending reliable income and capital appreciation.
Comparative Score Analysis: The Strategic Profile
The radar chart reveals the fundamental DNA and trade-offs of Texas Instruments and Onto Innovation, highlighting their distinct financial strengths and vulnerabilities:
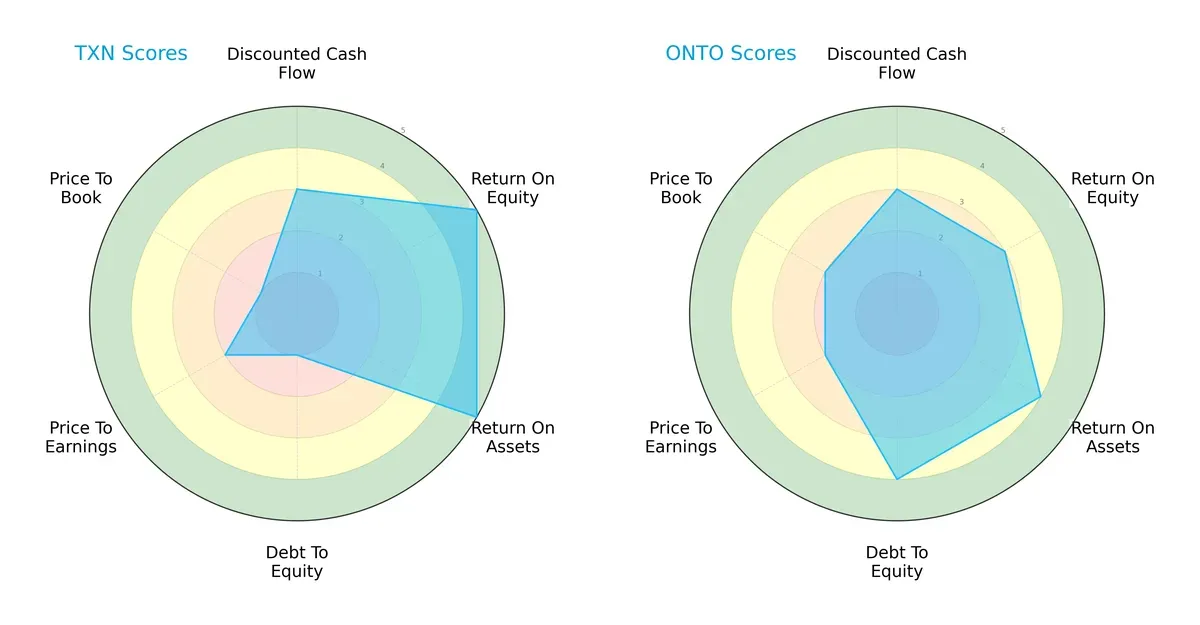
Texas Instruments excels in profitability metrics, boasting top ROE and ROA scores of 5 each, while Onto Innovation demonstrates better financial stability with a debt-to-equity score of 4 versus Texas Instruments’ weak 1. Texas Instruments shows valuation weaknesses (P/B score 1), reflecting potential market undervaluation, whereas Onto Innovation maintains more balanced valuation metrics. Overall, Texas Instruments relies on its operational efficiency, while Onto Innovation presents a more balanced financial profile.
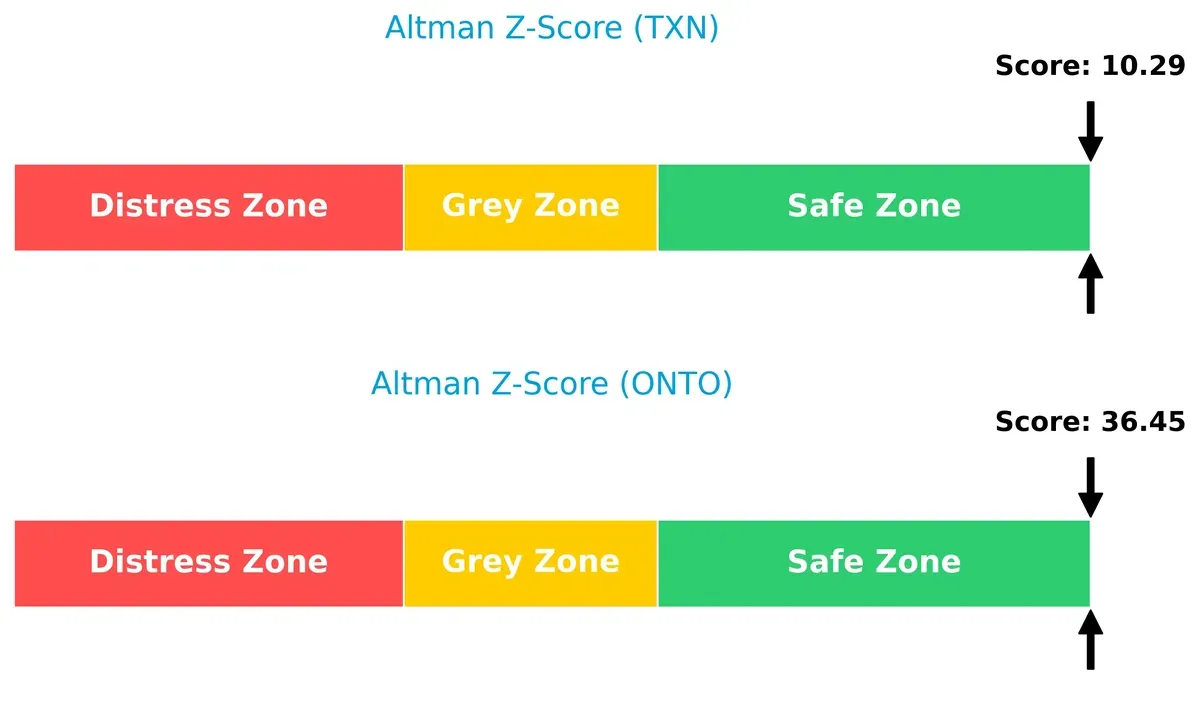
Bankruptcy Risk: Solvency Showdown
Texas Instruments and Onto Innovation both occupy the safe zone on the Altman Z-Score scale, but Onto Innovation’s score of 36.45 far exceeds Texas Instruments’ 10.29, indicating superior long-term solvency and lower bankruptcy risk in this cycle:
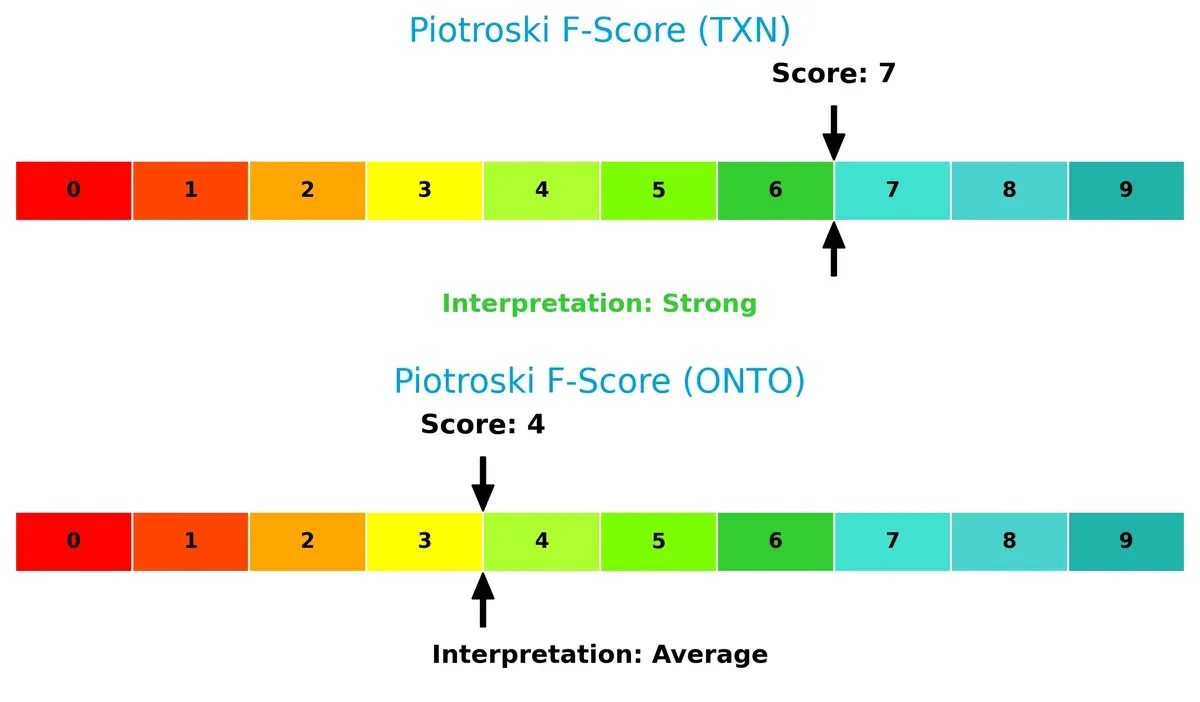
Financial Health: Quality of Operations
Texas Instruments scores a strong 7 on the Piotroski F-Score, signaling robust internal financial health. Onto Innovation’s average score of 4 suggests moderate financial strength and potential red flags in operational efficiency or liquidity:
How are the two companies positioned?
This section dissects the operational DNA of Texas Instruments and Onto Innovation by comparing their revenue distribution and internal dynamics. The goal is to confront their economic moats to reveal which business model holds the most resilient competitive advantage today.
Revenue Segmentation: The Strategic Mix
This visual comparison dissects how Texas Instruments and Onto Innovation diversify their income streams and where their primary sector bets lie:
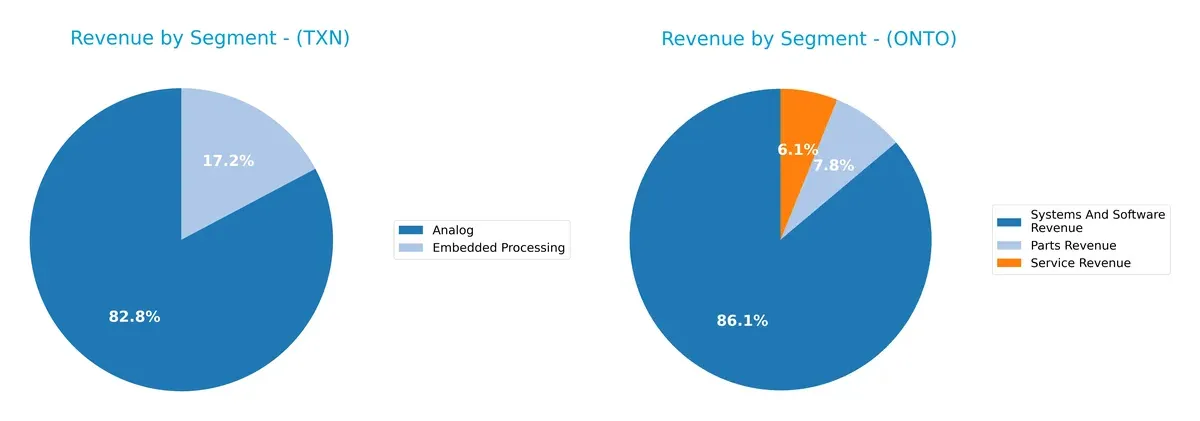
Texas Instruments anchors revenue in Analog, generating $12.2B in 2024, dwarfing its $2.5B Embedded Processing segment. Onto Innovation pivots around Systems and Software, with $850M in 2024, complemented by smaller Parts and Service revenues near $76M and $60M. TI’s concentration signals infrastructure dominance but carries concentration risk. Onto’s broader spread reduces risk but lacks TI’s scale and moat strength.
Strengths and Weaknesses Comparison
This table compares the strengths and weaknesses of Texas Instruments Incorporated (TXN) and Onto Innovation Inc. (ONTO):
TXN Strengths
- High net margin of 28.28%
- Strong ROE at 30.73%
- Favorable quick ratio at 2.83
- Solid dividend yield at 3.17%
- Diverse global presence with significant US and Asia sales
ONTO Strengths
- Favorable net margin of 20.43%
- Very low debt-to-equity ratio at 0.01
- Infinite interest coverage ratio
- High fixed asset turnover at 7.16
- Favorable quick ratio at 7.0
TXN Weaknesses
- Unfavorable price-to-earnings at 31.53
- High price-to-book at 9.69
- Unfavorable current ratio at 4.35
- Moderate debt level with 40.62% debt-to-assets
- Neutral asset turnover at 0.51
ONTO Weaknesses
- Unfavorable WACC at 10.8%
- Unfavorable PE at 41.76
- Unfavorable PB at 4.37
- Unfavorable current ratio at 8.69
- Zero dividend yield
- Unfavorable asset turnover at 0.47
TXN demonstrates robust profitability and strong global diversification but faces valuation and liquidity concerns. ONTO shows financial conservatism with low leverage and asset efficiency strengths but is challenged by higher costs of capital and valuation metrics. These contrasts highlight differing strategic focuses for the two companies.
The Moat Duel: Analyzing Competitive Defensibility
A structural moat is the sole shield preserving long-term profits from relentless competitive erosion. Let’s dissect these moats:
Texas Instruments Incorporated: Intangible Assets and Cost Advantage
Texas Instruments leverages its vast intangible assets and cost advantage, reflected in a strong 35% EBIT margin. Its mature analog and embedded processing segments sustain stable profitability. In 2026, product innovations in power management could reinforce this moat but declining ROIC signals caution.
Onto Innovation Inc.: Growing Operational Efficiency Amid Rising Competition
Onto Innovation relies on operational efficiency and niche process control technology. Unlike Texas Instruments, it shows a rising ROIC despite current value destruction. Its 21% revenue growth and expanding software portfolio suggest potential to deepen its moat through advanced semiconductor process solutions.
Battle of Scale vs. Growth: Texas Instruments’ Legacy Moat Faces Onto Innovation’s Momentum
Texas Instruments holds a wider, established moat with superior margins but faces declining capital returns. Onto Innovation’s moat is narrower and currently less profitable but strengthens rapidly. I believe Texas Instruments remains better positioned to defend market share in 2026, though Onto’s momentum demands close monitoring.
Which stock offers better returns?
The past year shows clear bullish momentum for both stocks, with Texas Instruments accelerating strongly and Onto Innovation displaying higher volatility and notable price swings.
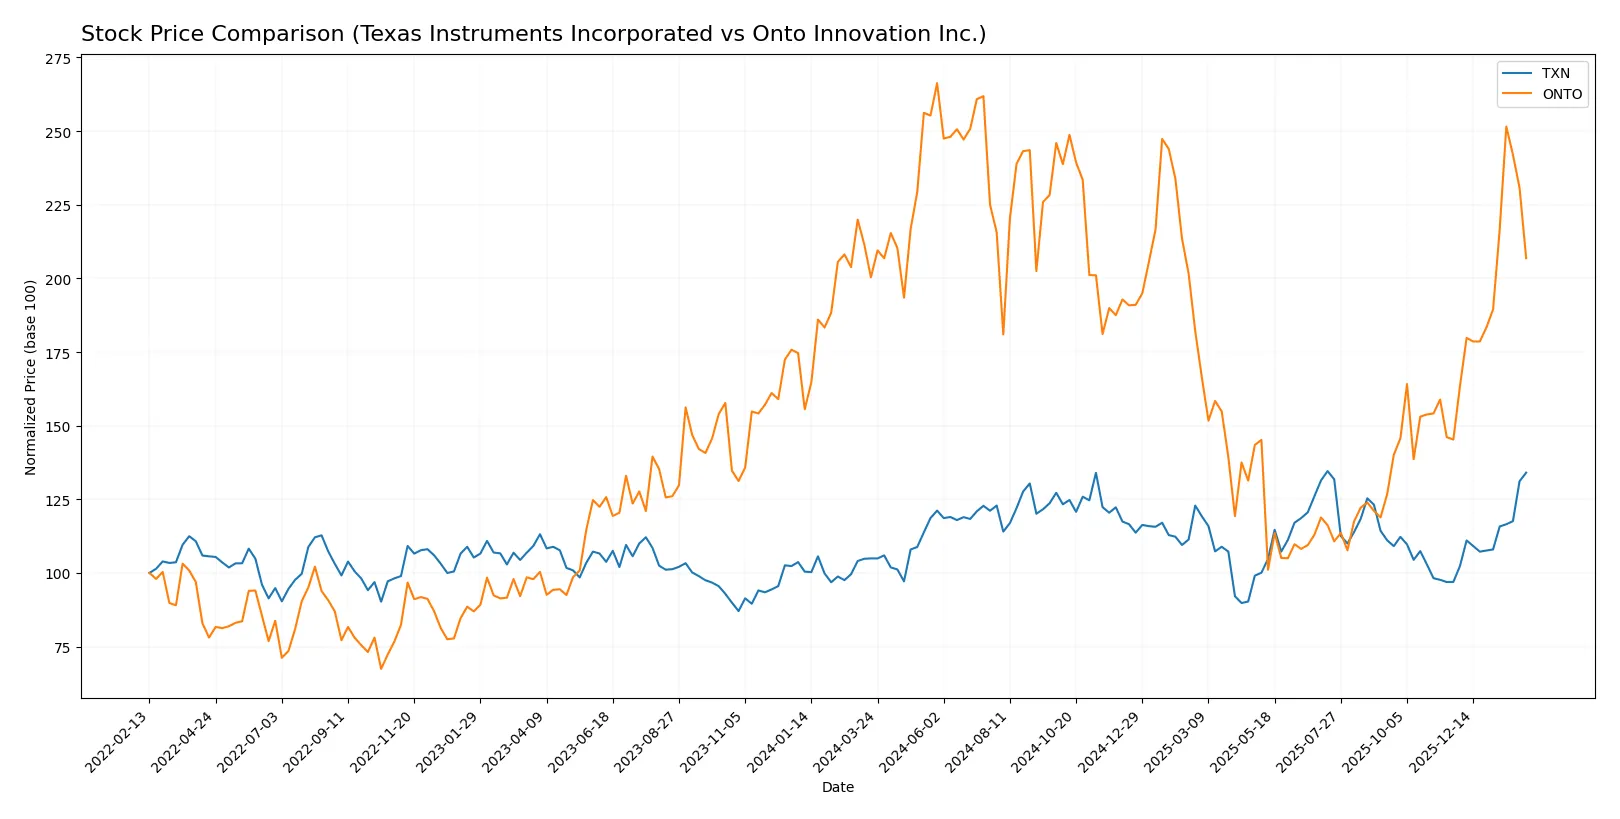
Trend Comparison
Texas Instruments posted a 27.73% price increase over the past year, reflecting a bullish trend with accelerating gains and a volatility level marked by a 16.18 standard deviation. The stock reached a high of 221.25 and a low of 147.6.
Onto Innovation gained 3.24% over the same period, also bullish with acceleration, but experienced much higher volatility at 42.97 standard deviation. The stock’s price ranged between 88.5 and 233.14.
Texas Instruments outperformed Onto Innovation substantially, delivering the highest market returns with a more consistent upward trajectory and lower volatility.
Target Prices
Analysts present a balanced target price consensus for Texas Instruments and Onto Innovation, reflecting moderate upside potential.
| Company | Target Low | Target High | Consensus |
|---|---|---|---|
| Texas Instruments Incorporated | 160 | 260 | 204.64 |
| Onto Innovation Inc. | 160 | 260 | 191.67 |
The consensus targets for both stocks suggest modest appreciation from current prices of $220.45 for Texas Instruments and $183.24 for Onto Innovation. Analysts expect steady sector performance with some valuation upside.

Don’t Let Luck Decide Your Entry Point
Optimize your entry points with our advanced ProRealTime indicators. You’ll get efficient buy signals with precise price targets for maximum performance. Start outperforming now!
How do institutions grade them?
Institutional grades for Texas Instruments Incorporated and Onto Innovation Inc. reflect recent analyst opinions from leading firms:
Texas Instruments Incorporated Grades
Below is a summary of recent grade actions from major grading companies for Texas Instruments Incorporated:
| Grading Company | Action | New Grade | Date |
|---|---|---|---|
| Jefferies | Maintain | Hold | 2026-01-28 |
| Cantor Fitzgerald | Maintain | Neutral | 2026-01-28 |
| Goldman Sachs | Maintain | Sell | 2026-01-28 |
| Truist Securities | Maintain | Hold | 2026-01-28 |
| Deutsche Bank | Maintain | Hold | 2026-01-28 |
| Stifel | Maintain | Hold | 2026-01-28 |
| UBS | Maintain | Buy | 2026-01-28 |
| B of A Securities | Upgrade | Neutral | 2026-01-28 |
| Wells Fargo | Maintain | Equal Weight | 2026-01-28 |
| JP Morgan | Maintain | Overweight | 2026-01-28 |
Onto Innovation Inc. Grades
The following table shows recent analyst ratings for Onto Innovation Inc.:
| Grading Company | Action | New Grade | Date |
|---|---|---|---|
| Needham | Maintain | Buy | 2026-01-20 |
| B. Riley Securities | Maintain | Buy | 2026-01-15 |
| Stifel | Maintain | Hold | 2026-01-14 |
| Needham | Maintain | Buy | 2026-01-06 |
| Jefferies | Maintain | Buy | 2025-12-15 |
| Needham | Maintain | Buy | 2025-11-18 |
| B. Riley Securities | Maintain | Buy | 2025-11-18 |
| Evercore ISI Group | Maintain | Outperform | 2025-11-05 |
| Oppenheimer | Maintain | Outperform | 2025-10-14 |
| Stifel | Maintain | Hold | 2025-10-13 |
Which company has the best grades?
Onto Innovation Inc. consistently receives Buy and Outperform ratings, indicating stronger analyst confidence. Texas Instruments shows mixed ratings, including Hold and Sell grades, implying more cautious sentiment from analysts. This divergence may influence investor perception of growth potential and risk.
Risks specific to each company
The following categories identify critical pressure points and systemic threats facing both firms in the 2026 market environment:
1. Market & Competition
Texas Instruments Incorporated
- Dominates mature analog and embedded semiconductor markets with strong brand moat.
Onto Innovation Inc.
- Faces intense competition in niche process control tools with limited scale advantages.
2. Capital Structure & Debt
Texas Instruments Incorporated
- Moderate leverage (D/E 0.86), interest coverage strong at 11.5x, but debt levels warrant caution.
Onto Innovation Inc.
- Minimal debt (D/E 0.01), excellent interest coverage, signaling conservative financial risk profile.
3. Stock Volatility
Texas Instruments Incorporated
- Beta near 1.0 indicates market-like volatility, relatively stable for tech sector standards.
Onto Innovation Inc.
- Higher beta at 1.48 implies greater stock price swings and elevated investor risk.
4. Regulatory & Legal
Texas Instruments Incorporated
- Subject to global tech export controls and IP litigation risks due to scale and footprint.
Onto Innovation Inc.
- Faces regulatory scrutiny tied to manufacturing and software compliance in semiconductor equipment.
5. Supply Chain & Operations
Texas Instruments Incorporated
- Benefits from diversified supplier base and vertical integration, mitigating disruptions.
Onto Innovation Inc.
- Smaller scale heightens exposure to supply bottlenecks and component shortages.
6. ESG & Climate Transition
Texas Instruments Incorporated
- Advanced ESG programs with clear carbon reduction targets support sustainable operations.
Onto Innovation Inc.
- Emerging ESG initiatives but less mature, posing potential transitional risks.
7. Geopolitical Exposure
Texas Instruments Incorporated
- Significant exposure to US-China tensions impacting semiconductor supply chains.
Onto Innovation Inc.
- More limited geographic footprint reduces direct geopolitical risks but not immune.
Which company shows a better risk-adjusted profile?
Texas Instruments’ largest risk is its moderately high debt level amid global macro uncertainties. Onto Innovation’s most impactful risk is its elevated stock volatility reflecting market sensitivity. Despite higher leverage concerns, Texas Instruments offers a more balanced risk-adjusted profile due to its scale, stable markets, and superior financial strength. Onto’s smaller size and high beta increase vulnerability. The recent 8.35% drop in Onto’s stock price versus Texas Instruments’ milder 2.1% dip underscores this disparity in risk tolerance.
Final Verdict: Which stock to choose?
Texas Instruments Incorporated’s core superpower lies in its consistent value creation through efficient capital allocation and robust profitability, evidenced by a strong moat. Its key point of vigilance is the declining ROIC trend, which might pressure future returns. It fits well in portfolios seeking stable, dividend-yielding, and slightly favorable growth.
Onto Innovation Inc. stands out for its growth momentum and improving profitability, underpinned by a rising ROIC despite currently shedding value. Its strategic moat centers on innovation-driven expansion and a pristine balance sheet, offering better financial safety relative to Texas Instruments. It suits investors targeting growth at a reasonable price with a higher risk appetite.
If you prioritize enduring value creation and dividend income, Texas Instruments outshines due to its strong operational efficiency and market position. However, if you seek accelerating growth with improving fundamentals and can tolerate valuation and profitability risks, Onto Innovation offers better upside potential. Both present distinct analytical scenarios for different investor profiles.
Disclaimer: Investment carries a risk of loss of initial capital. The past performance is not a reliable indicator of future results. Be sure to understand risks before making an investment decision.
Go Further
I encourage you to read the complete analyses of Texas Instruments Incorporated and Onto Innovation Inc. to enhance your investment decisions: