Home > Comparison > Technology > TER vs ONTO
The strategic rivalry between Teradyne, Inc. and Onto Innovation Inc. shapes the semiconductor sector’s evolution. Teradyne operates as a diversified test equipment leader with a broad industrial automation footprint. Onto Innovation focuses on precision process control and metrology tools essential for chip manufacturing. This analysis pits Teradyne’s scale and automation against Onto’s niche specialization to identify which offers superior risk-adjusted potential for a balanced portfolio.
Table of contents
Companies Overview
Teradyne and Onto Innovation stand as pivotal players in the semiconductor equipment sector, shaping technology manufacturing worldwide.
Teradyne, Inc.: Leader in Automated Test Equipment
Teradyne commands the semiconductor testing market with its automatic test equipment spanning semiconductor, system, industrial automation, and wireless test segments. Its revenue relies heavily on wafer and device package testing for diverse applications, from automotive to cloud computing. In 2026, the company sharpens focus on expanding industrial automation and advanced wireless testing platforms, reinforcing its technological breadth and market reach.
Onto Innovation Inc.: Specialist in Process Control Solutions
Onto Innovation excels in process control tools for macro defect inspection, optical metrology, and lithography systems. It generates revenue by supplying semiconductor manufacturers with standalone inspection tools and a software portfolio for yield management and process control. The firm’s 2026 strategy prioritizes enhancing integrated software suites and analytical services to improve manufacturing precision and yield control for advanced device makers.
Strategic Collision: Similarities & Divergences
Both companies operate in semiconductor equipment but diverge in approach: Teradyne offers a broad automated test ecosystem while Onto Innovation focuses on process control precision and defect management. Their primary battleground lies in serving semiconductor fabs’ quality assurance needs. Teradyne’s scale and diversified segments contrast with Onto’s niche specialization, creating distinct risk and growth profiles for investors seeking exposure to semiconductor manufacturing technology.
Income Statement Comparison
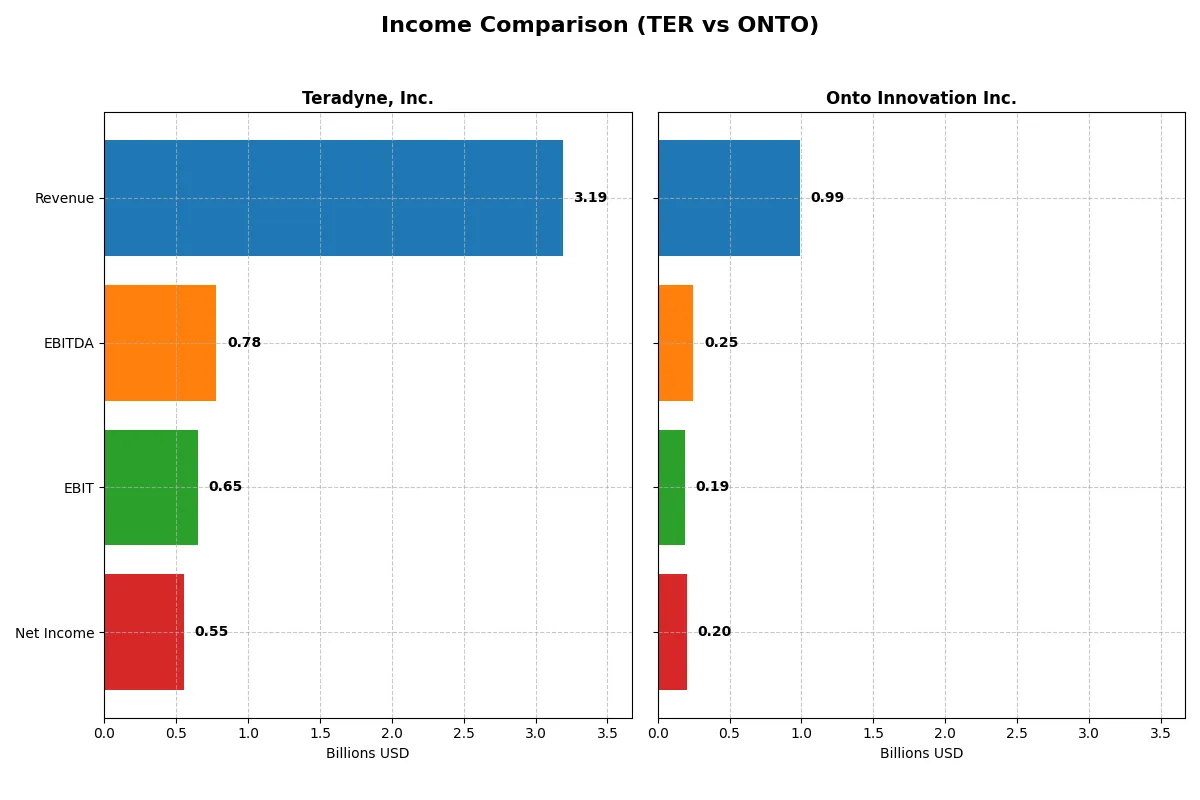
This data dissects the core profitability and scalability of both corporate engines to reveal who dominates the bottom line:
| Metric | Teradyne, Inc. (TER) | Onto Innovation Inc. (ONTO) |
|---|---|---|
| Revenue | 3.19B | 987M |
| Cost of Revenue | 1.32B | 472M |
| Operating Expenses | 1.17B | 328M |
| Gross Profit | 1.87B | 515M |
| EBITDA | 780M | 249M |
| EBIT | 653M | 187M |
| Interest Expense | 8.02M | 0 |
| Net Income | 554M | 202M |
| EPS | 3.49 | 4.09 |
| Fiscal Year | 2025 | 2024 |
Income Statement Analysis: The Bottom-Line Duel
This income statement comparison reveals which company runs a more efficient and profitable corporate engine through their revenue and margin dynamics.
Teradyne, Inc. Analysis
Teradyne’s revenue grew steadily from 2.67B in 2023 to 3.19B in 2025, but net income declined sharply from 1.01B in 2021 to 554M in 2025. Gross margin remains strong above 58%, and EBIT margin holds at a healthy 20.5%. However, net margin fell below 18%, reflecting pressure on profitability despite solid top-line momentum.
Onto Innovation Inc. Analysis
Onto Innovation posted robust revenue growth from 556M in 2020 to 987M in 2024, with net income surging fivefold to 202M. Its gross margin of 52% and EBIT margin near 19% underpin improving operational efficiency. Notably, net margin expanded to over 20%, highlighting accelerating profitability and efficient expense control in the latest fiscal year.
Margin Strength vs. Growth Trajectory
Teradyne delivers superior scale and consistent gross margins but faces declining net income and margin erosion over five years. Onto Innovation, while smaller, exhibits explosive growth and expanding profitability, posting all favorable margin and growth metrics. For investors, Onto’s growth profile offers a compelling case, whereas Teradyne’s scale and margin stability cater to more conservative preferences.
Financial Ratios Comparison
These vital ratios act as a diagnostic tool to expose the underlying fiscal health, valuation premiums, and capital efficiency of the companies compared below:
| Ratios | Teradyne, Inc. (TER) | Onto Innovation Inc. (ONTO) |
|---|---|---|
| ROE | 19.8% (2025) | 10.5% (2024) |
| ROIC | 18.4% (2025) | 8.8% (2024) |
| P/E | 54.6x (2025) | 41.8x (2024) |
| P/B | 10.8x (2025) | 4.4x (2024) |
| Current Ratio | 1.76 (2025) | 8.69 (2024) |
| Quick Ratio | 1.41 (2025) | 7.00 (2024) |
| D/E | 0.12 (2025) | 0.01 (2024) |
| Debt-to-Assets | 8.3% (2025) | 0.7% (2024) |
| Interest Coverage | 86.4x (2025) | 0x (2024) |
| Asset Turnover | 0.76 (2025) | 0.47 (2024) |
| Fixed Asset Turnover | 4.99 (2025) | 7.16 (2024) |
| Payout Ratio | 13.8% (2025) | 0% (2024) |
| Dividend Yield | 0.25% (2025) | 0% (2024) |
| Fiscal Year | 2025 | 2024 |
Efficiency & Valuation Duel: The Vital Signs
Financial ratios act as a company’s DNA, revealing hidden risks and operational excellence beyond surface-level numbers.
Teradyne, Inc.
Teradyne posts a strong 19.8% ROE and a healthy 17.4% net margin, signaling robust profitability. However, its P/E of 54.6 and P/B of 10.8 suggest an expensive valuation that may stretch expectations. Shareholders receive a modest 0.25% dividend yield, reflecting a focus on balanced capital allocation rather than aggressive payouts.
Onto Innovation Inc.
Onto Innovation shows a solid net margin of 20.4% but a lower 10.5% ROE, indicating less efficient equity use. Its P/E of 41.8 and P/B of 4.4 mark the stock as pricey but less stretched than Teradyne. Onto pays no dividends, emphasizing reinvestment into growth and R&D to build future value.
Premium Valuation vs. Operational Safety
Teradyne offers superior profitability and stronger balance sheet metrics but at a notably higher valuation multiple. Onto Innovation trades cheaper but with weaker returns and a neutral overall ratio standing. Investors seeking operational safety may prefer Teradyne, while those favoring growth reinvestment could lean toward Onto.
Which one offers the Superior Shareholder Reward?
Teradyne, Inc. (TER) pays a modest dividend yield around 0.25%-0.50% with a conservative payout ratio near 14%, backed by strong free cash flow coverage above 2x. Its buyback program is aggressive, enhancing total shareholder return sustainably. Onto Innovation Inc. (ONTO) pays no dividend, instead reinvesting heavily in growth, supported by robust free cash flow and near-zero debt. Onto’s buybacks are minimal, focusing on capital allocation to R&D and acquisitions. I see Teradyne’s balanced distribution—modest dividends plus active buybacks—as delivering superior shareholder reward in 2026, given its sustainable cash returns and value discipline. Onto’s reinvestment strategy suits growth investors but lacks immediate income or buyback-driven capital return.
Comparative Score Analysis: The Strategic Profile
The radar chart reveals the fundamental DNA and trade-offs of Teradyne, Inc. and Onto Innovation Inc., highlighting their financial strengths and vulnerabilities:
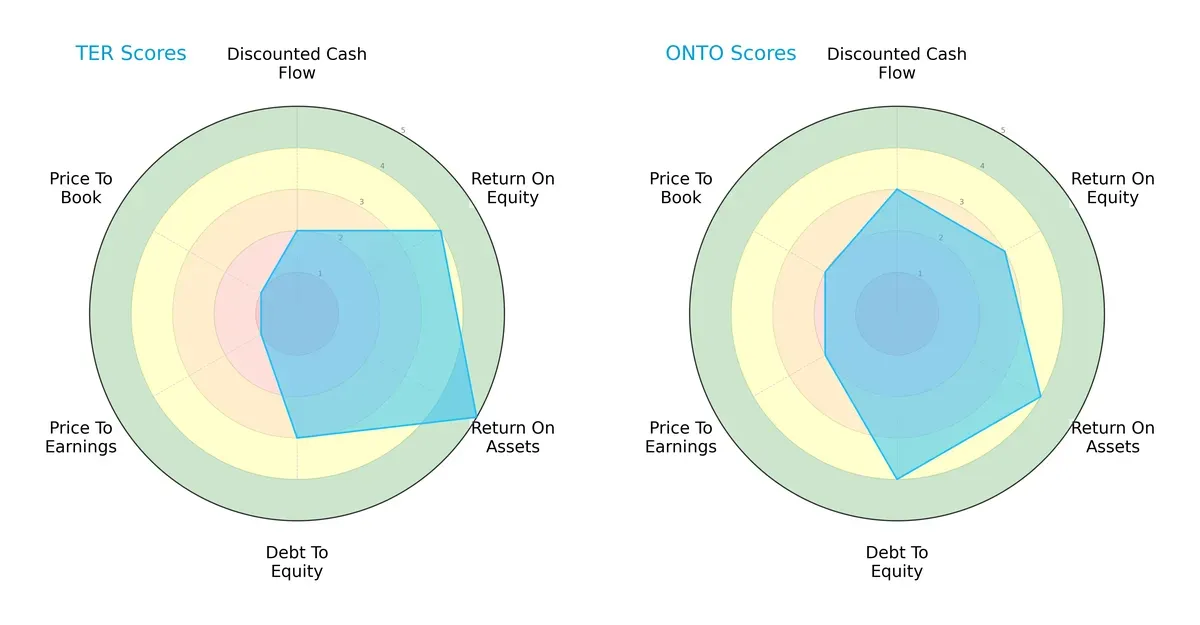
Teradyne excels in return on assets (5) and return on equity (4), showing operational efficiency. Onto Innovation scores higher on debt-to-equity (4) and valuation metrics, indicating more balanced financial risk and moderate market pricing. Teradyne’s weakness lies in valuation (PE/PB scores both 1), suggesting potential overvaluation or market skepticism. Onto Innovation presents a more balanced profile, relying less on operational extremes and more on solid capital structure.
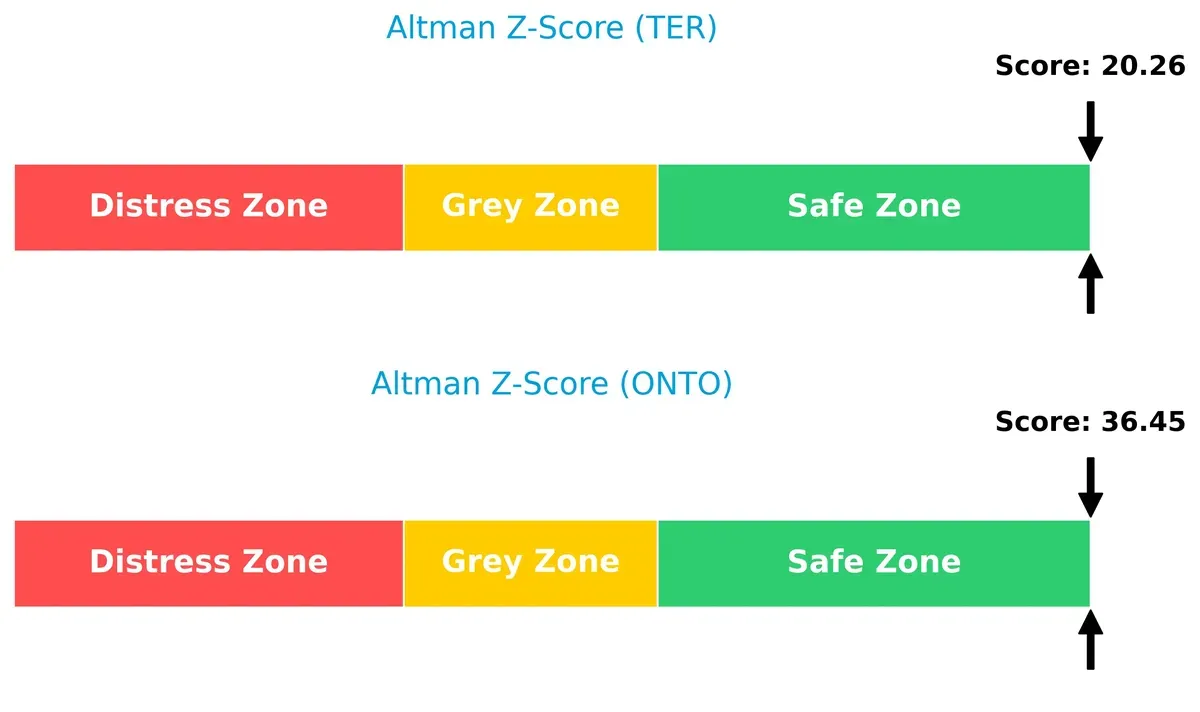
Bankruptcy Risk: Solvency Showdown
Teradyne’s Altman Z-Score is 20.3, while Onto Innovation’s is 36.5, both well within the safe zone for long-term survival in this economic cycle:
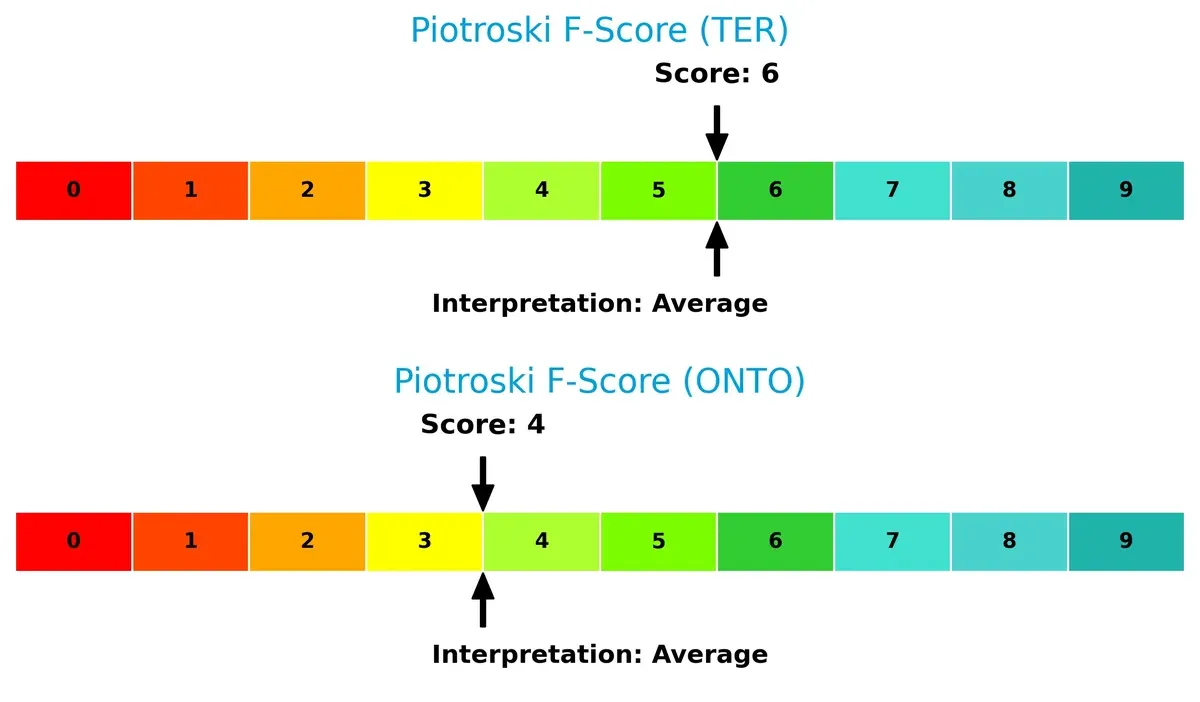
Financial Health: Quality of Operations
Teradyne holds a Piotroski F-Score of 6 compared to Onto Innovation’s 4, indicating stronger internal financial health and fewer red flags in profitability and efficiency metrics:
How are the two companies positioned?
This section dissects the operational DNA of Teradyne and Onto Innovation by comparing their revenue distribution and internal dynamics. The goal is to confront their economic moats to identify the more resilient, sustainable competitive advantage today.
Revenue Segmentation: The Strategic Mix
This comparison dissects how Teradyne and Onto Innovation diversify income streams and reveals their primary sector bets as of 2024:
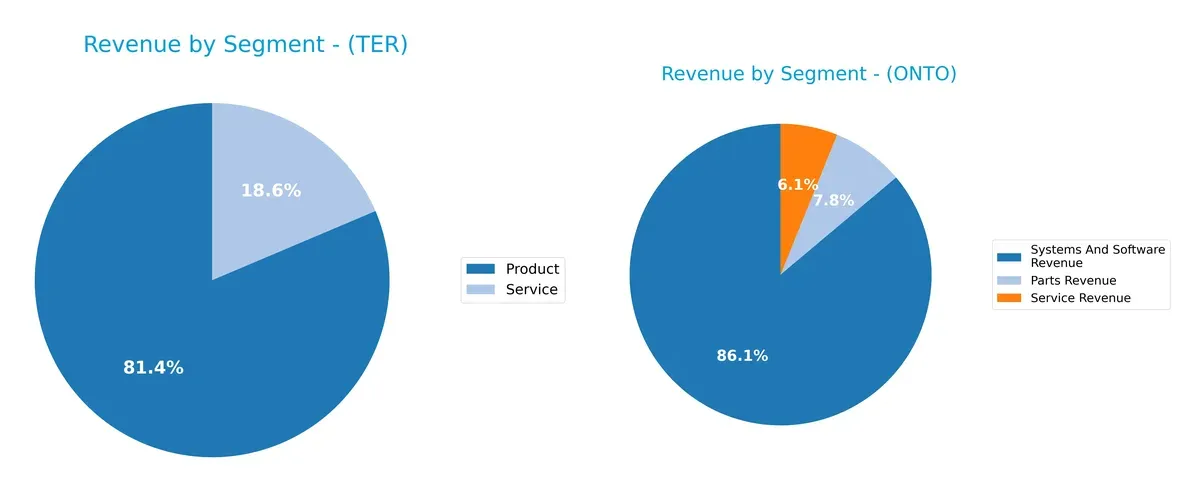
Teradyne anchors 2.3B in Product revenue and 525M in Services, showing a strong product dominance with moderate service diversification. Onto Innovation pivots around 850M from Systems and Software, with smaller Parts (77M) and Services (60M) revenues. Teradyne’s concentration in products suggests infrastructure dominance and potential concentration risk. Onto’s broader segmentation signals ecosystem lock-in and resilience against sector shocks.
Strengths and Weaknesses Comparison
This table compares the strengths and weaknesses of Teradyne and Onto Innovation based on diversification, profitability, financials, innovation, global presence, and market share:
TER Strengths
- Strong profitability with high net margin and ROE
- Favorable liquidity and low debt levels
- Solid innovation indicated by fixed asset turnover
- Diversified global presence across Asia, US, and Europe
ONTO Strengths
- Highest net margin among peers
- Strong fixed asset turnover reflecting operational efficiency
- Extremely low debt levels and infinite interest coverage
- Consistent revenue from Systems and Software segment
TER Weaknesses
- Elevated valuation multiples (P/E and P/B) may limit upside
- WACC exceeds ROIC, indicating potential capital cost issues
- Dividend yield is minimal, limiting income appeal
- Moderate asset turnover suggests room for efficiency gains
ONTO Weaknesses
- Current ratio unusually high, possibly indicating inefficient asset use
- Neutral ROE and ROIC suggest modest profitability
- WACC remains above ROIC, challenging value creation
- Unfavorable low dividend yield and asset turnover
Both companies show strengths in profitability and conservative leverage. Teradyne benefits from broader global diversification and stronger returns, while Onto Innovation excels in operational efficiency and margin. Each faces valuation and capital efficiency challenges that may influence strategic priorities.
The Moat Duel: Analyzing Competitive Defensibility
A structural moat protects long-term profits from competition’s erosion. Without it, gains quickly vanish. Let’s dissect the competitive moats of Teradyne and Onto Innovation:
Teradyne, Inc.: Switching Costs and Product Breadth
Teradyne’s moat stems from high switching costs and diverse test platforms. Its 6% ROIC premium over WACC signals value creation despite declining profitability. New automation products in 2026 could reinforce this edge.
Onto Innovation Inc.: Emerging Efficiency and Growth Potential
Onto relies on process control software and analytical tools as its moat, contrasting Teradyne’s hardware focus. Its ROIC remains below WACC, indicating value destruction, but rapid ROIC growth hints at rising efficiency and expansion opportunities.
Moat Battle: Established Switching Costs vs. Nascent Operational Growth
Teradyne holds a wider moat with consistent value creation and entrenched customer relationships. Onto’s improving ROIC shows promise but lacks the durable advantage needed to defend market share long-term. Teradyne stands better prepared to sustain its lead.
Which stock offers better returns?
Stock price trends over the past year reveal strong gains and dynamic trading volumes, highlighting divergent momentum and acceleration patterns between Teradyne, Inc. and Onto Innovation Inc.
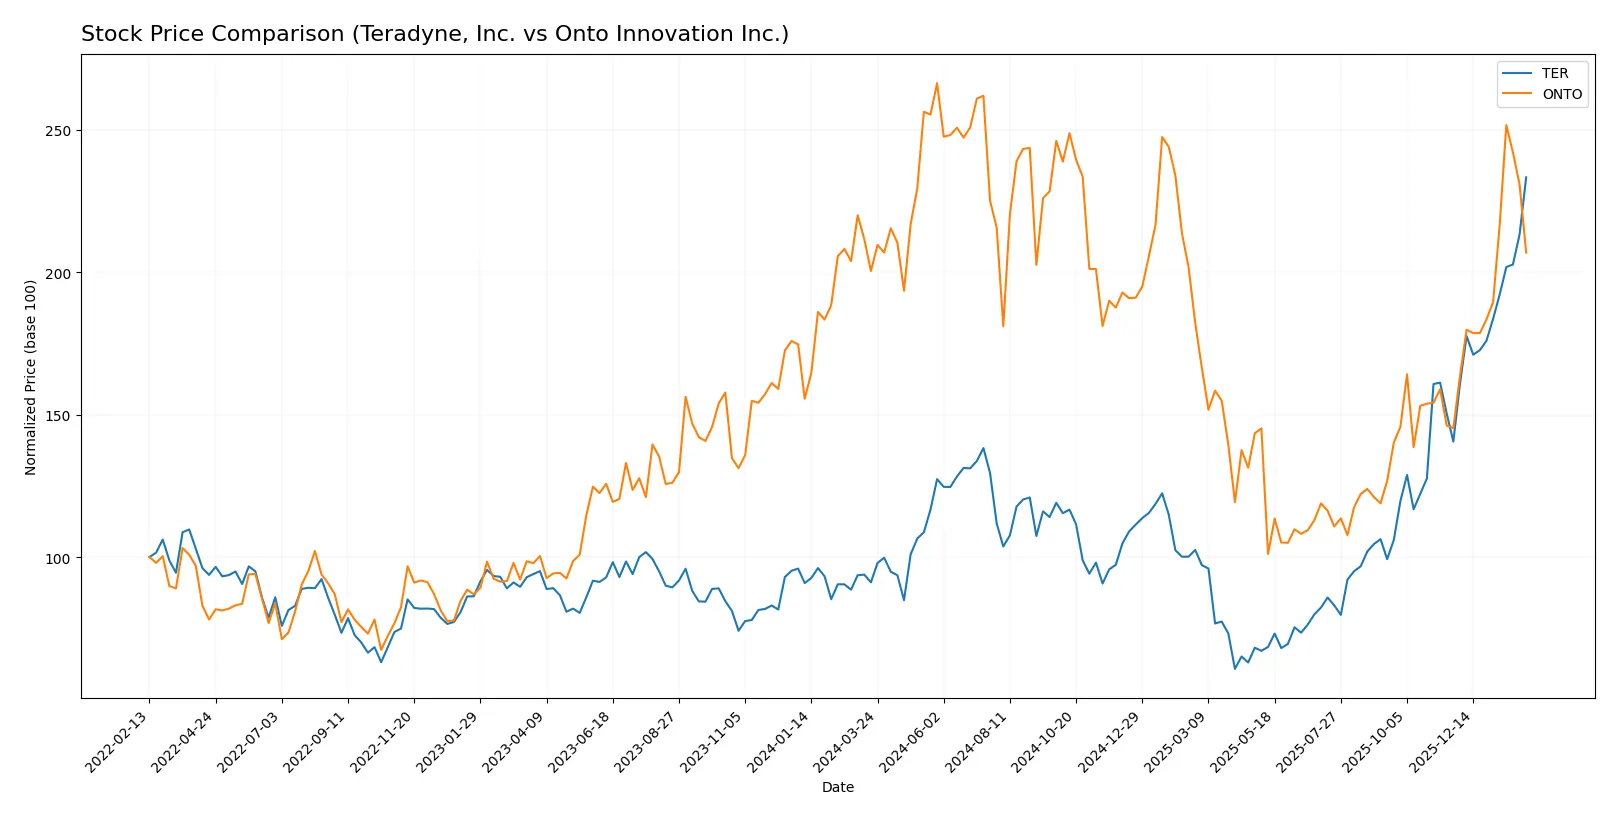
Trend Comparison
Teradyne, Inc. shows a pronounced bullish trend with a 156% price increase over 12 months. The trend accelerates, peaking at 264, with high volatility (39.01 std dev).
Onto Innovation Inc. also posts a bullish trend but with a modest 3.24% gain over the year. Acceleration is present, yet volatility remains elevated at 42.97 std dev.
Teradyne clearly outperformed Onto Innovation, delivering substantially higher returns and stronger buyer dominance across the analyzed period.
Target Prices
Analysts present a varied but optimistic price consensus for Teradyne, Inc. and Onto Innovation Inc.
| Company | Target Low | Target High | Consensus |
|---|---|---|---|
| Teradyne, Inc. | 175 | 335 | 276.08 |
| Onto Innovation Inc. | 160 | 260 | 191.67 |
Teradyne’s consensus target at 276.08 suggests modest upside from the current 265.27 price. Onto Innovation’s 191.67 target indicates room for growth above its 181.45 market price.

Don’t Let Luck Decide Your Entry Point
Optimize your entry points with our advanced ProRealTime indicators. You’ll get efficient buy signals with precise price targets for maximum performance. Start outperforming now!
How do institutions grade them?
The following tables summarize recent institutional grades for Teradyne, Inc. and Onto Innovation Inc.:
Teradyne, Inc. Grades
Here are the latest grades assigned by recognized financial institutions for Teradyne, Inc.:
| Grading Company | Action | New Grade | Date |
|---|---|---|---|
| Evercore ISI Group | maintain | Outperform | 2026-02-04 |
| Cantor Fitzgerald | maintain | Overweight | 2026-02-04 |
| Stifel | maintain | Buy | 2026-02-04 |
| Evercore ISI Group | maintain | Outperform | 2026-02-03 |
| Cantor Fitzgerald | maintain | Overweight | 2026-02-02 |
| Stifel | maintain | Buy | 2026-01-30 |
| UBS | maintain | Buy | 2026-01-26 |
| B of A Securities | maintain | Buy | 2026-01-22 |
| Stifel | maintain | Buy | 2026-01-14 |
| B of A Securities | maintain | Buy | 2026-01-13 |
Onto Innovation Inc. Grades
This table shows recent grades for Onto Innovation Inc. from reputable grading firms:
| Grading Company | Action | New Grade | Date |
|---|---|---|---|
| Needham | maintain | Buy | 2026-01-20 |
| B. Riley Securities | maintain | Buy | 2026-01-15 |
| Stifel | maintain | Hold | 2026-01-14 |
| Needham | maintain | Buy | 2026-01-06 |
| Jefferies | maintain | Buy | 2025-12-15 |
| Needham | maintain | Buy | 2025-11-18 |
| B. Riley Securities | maintain | Buy | 2025-11-18 |
| Evercore ISI Group | maintain | Outperform | 2025-11-05 |
| Oppenheimer | maintain | Outperform | 2025-10-14 |
| Stifel | maintain | Hold | 2025-10-13 |
Which company has the best grades?
Teradyne consistently earns “Buy” to “Outperform” grades from top firms, reflecting strong institutional confidence. Onto Innovation also receives mostly “Buy” and some “Outperform” ratings but includes “Hold” grades. Teradyne’s more uniformly positive ratings suggest greater consensus, which may impact investor perception of stability and potential.
Risks specific to each company
The following categories identify the critical pressure points and systemic threats facing both firms in the 2026 market environment:
1. Market & Competition
Teradyne, Inc.
- Dominates with diversified test equipment and automation segments, serving broad semiconductor markets.
Onto Innovation Inc.
- Focused on process control tools and metrology, a niche vulnerable to specialized competitors.
2. Capital Structure & Debt
Teradyne, Inc.
- Maintains low debt-to-equity (0.12), strong interest coverage (81.4x), signaling financial stability.
Onto Innovation Inc.
- Extremely low leverage (D/E 0.01) with infinite interest coverage, indicating minimal financial risk.
3. Stock Volatility
Teradyne, Inc.
- Beta of 1.82 indicates higher volatility than the market, raising risk in turbulent cycles.
Onto Innovation Inc.
- Beta of 1.48 suggests moderate volatility, less reactive to market swings than Teradyne.
4. Regulatory & Legal
Teradyne, Inc.
- Exposure to global semiconductor regulations, including export controls, presents compliance risks.
Onto Innovation Inc.
- Faces regulatory scrutiny in advanced metrology and semiconductor process control segments.
5. Supply Chain & Operations
Teradyne, Inc.
- Complex global supply chain; vulnerable to semiconductor fabrication disruptions and logistics bottlenecks.
Onto Innovation Inc.
- Smaller scale with focused supply chain, but dependent on semiconductor manufacturers’ capital spending patterns.
6. ESG & Climate Transition
Teradyne, Inc.
- Larger firm likely under greater pressure to meet ESG standards and reduce carbon footprint.
Onto Innovation Inc.
- Faces rising expectations for sustainability in manufacturing and energy use, yet less visible publicly.
7. Geopolitical Exposure
Teradyne, Inc.
- Significant US-China trade tensions impact semiconductor testing and automation sales.
Onto Innovation Inc.
- Geopolitical risks present but less pronounced due to smaller global footprint.
Which company shows a better risk-adjusted profile?
Teradyne carries a higher market volatility risk and geopolitical exposure but boasts superior financial stability and diversified operations. Onto Innovation has lower leverage and volatility but faces operational concentration and weaker capital efficiency. Teradyne’s robust interest coverage and broader market presence tilt its risk-adjusted profile more favorably.
Teradyne’s most impactful risk is its elevated market volatility and geopolitical tensions affecting semiconductor supply chains. Onto Innovation’s critical risk lies in operational concentration and weaker asset efficiency. Despite Teradyne’s higher beta, its strong debt management and scale provide a safer financial cushion. Onto’s recent drop in volume and moderate Piotroski score highlight operational vulnerability amid market pressures.
Final Verdict: Which stock to choose?
Teradyne, Inc. excels as a cash-generating powerhouse with a proven ability to create value above its cost of capital. Its declining ROIC trend is a point of vigilance that suggests cautious monitoring. Teradyne fits well in an Aggressive Growth portfolio seeking operational strength and market leadership.
Onto Innovation Inc. offers a strategic moat rooted in accelerating profitability and expanding returns on invested capital. It carries a more conservative financial profile with stronger liquidity but currently sheds value relative to capital cost. Onto suits a GARP portfolio focused on improving fundamentals with moderate risk tolerance.
If you prioritize sustained value creation and operational efficiency, Teradyne outshines due to its robust economic moat and cash flow generation. However, if you seek improving profitability with better balance sheet safety, Onto presents a compelling case for methodical growth investors willing to weather transitional phases. Both scenarios demand careful risk assessment aligned with your investment horizon.
Disclaimer: Investment carries a risk of loss of initial capital. The past performance is not a reliable indicator of future results. Be sure to understand risks before making an investment decision.
Go Further
I encourage you to read the complete analyses of Teradyne, Inc. and Onto Innovation Inc. to enhance your investment decisions: