Investors seeking strong opportunities in the semiconductor sector often consider Taiwan Semiconductor Manufacturing Company Limited (TSM) and Onto Innovation Inc. (ONTO). Both operate within the semiconductor industry but focus on different aspects: TSM is a global leader in chip manufacturing, while ONTO specializes in advanced process control and inspection technologies. By comparing their market positions and innovation strategies, this article will help you identify which company presents the most compelling investment potential.

Table of contents
Companies Overview
I will begin the comparison between Taiwan Semiconductor Manufacturing Company Limited (TSM) and Onto Innovation Inc. (ONTO) by providing an overview of these two companies and their main differences.
Taiwan Semiconductor Manufacturing Company Limited Overview
TSM is a leading semiconductor manufacturer headquartered in Hsinchu City, Taiwan. Founded in 1987, it specializes in wafer fabrication processes including CMOS logic, mixed-signal, and embedded memory technologies. Its products serve diverse markets such as high-performance computing, smartphones, IoT, automotive, and digital consumer electronics, positioning it as a key player in global semiconductor manufacturing.
Onto Innovation Inc. Overview
ONTO, based in Wilmington, Massachusetts, was founded in 1940 and focuses on process control tools and analytical software for semiconductor manufacturing. It offers solutions including macro defect inspection, lithography systems, and yield management software. Serving semiconductor and advanced packaging manufacturers worldwide, ONTO supports various applications from silicon wafers to MEMS and power devices, emphasizing process optimization and quality control.
Key similarities and differences
Both TSM and ONTO operate within the semiconductor industry but occupy distinct niches. TSM is primarily a wafer foundry producing integrated circuits for broad end markets, while ONTO provides process control equipment and software to enhance semiconductor manufacturing yield and quality. TSM’s scale is significantly larger with a market cap over 1.6T USD and 65K employees, compared to ONTO’s 10B USD market cap and 1.5K employees, reflecting different roles along the semiconductor value chain.
Income Statement Comparison
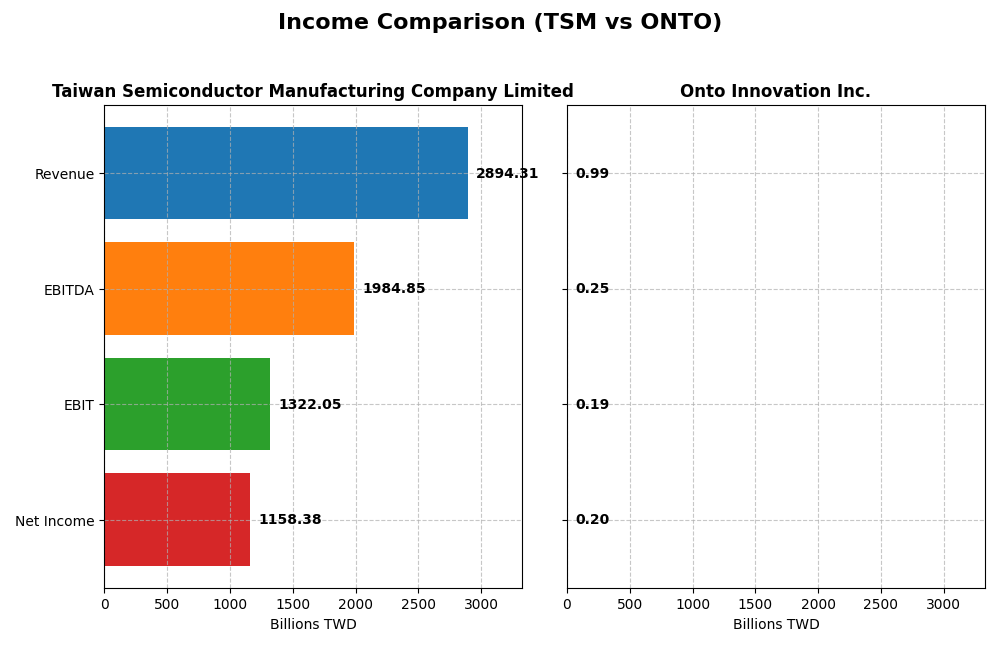
The table below presents a side-by-side comparison of key income statement metrics for Taiwan Semiconductor Manufacturing Company Limited and Onto Innovation Inc. for the fiscal year 2024.
| Metric | Taiwan Semiconductor Manufacturing Company Limited | Onto Innovation Inc. |
|---|---|---|
| Market Cap | 1.70T TWD | 9.91B USD |
| Revenue | 2.89T TWD | 987M USD |
| EBITDA | 1.98T TWD | 249M USD |
| EBIT | 1.32T TWD | 187M USD |
| Net Income | 1.16T TWD | 202M USD |
| EPS | 223.4 TWD | 4.09 USD |
| Fiscal Year | 2024 | 2024 |
Income Statement Interpretations
Taiwan Semiconductor Manufacturing Company Limited
From 2020 to 2024, Taiwan Semiconductor Manufacturing Company Limited (TSM) demonstrated strong revenue and net income growth, with revenue increasing by 116.11% and net income by 126.8%. Margins remained stable and favorable, with a gross margin of 56.12% and net margin near 40%. In 2024, revenue growth slowed to 33.89%, while net margin growth was neutral at 1.58%, signaling consistent profitability.
Onto Innovation Inc.
Onto Innovation Inc. (ONTO) showed robust growth over 2020–2024, with revenue rising 77.42% and net income surging by 550.02%. Margins improved significantly, highlighted by a gross margin of 52.19% and a net margin of 20.43%. The latest year saw a 21.01% revenue increase and a strong 37.55% net margin growth, reflecting accelerating profitability and operational efficiency.
Which one has the stronger fundamentals?
Both companies exhibit favorable fundamentals with strong income growth and improving margins. TSM benefits from larger scale and higher absolute margins, maintaining stable profitability. ONTO shows exceptional net income growth and margin expansion but from a smaller base. The comparison highlights TSM’s strong stability versus ONTO’s rapid growth and margin improvement, each appealing to different investor profiles.
Financial Ratios Comparison
The table below presents a side-by-side comparison of key financial ratios for Taiwan Semiconductor Manufacturing Company Limited (TSM) and Onto Innovation Inc. (ONTO) based on their most recent fiscal year data.
| Ratios | Taiwan Semiconductor Manufacturing Company Limited (TSM) | Onto Innovation Inc. (ONTO) |
|---|---|---|
| ROE | 27.29% | 10.47% |
| ROIC | 19.99% | 8.77% |
| P/E | 29.04 | 41.76 |
| P/B | 7.92 | 4.37 |
| Current Ratio | 2.36 | 8.69 |
| Quick Ratio | 2.14 | 7.00 |
| D/E (Debt to Equity) | 0.25 | 0.01 |
| Debt-to-Assets | 15.65% | 0.72% |
| Interest Coverage | 126.0 | 0 |
| Asset Turnover | 0.43 | 0.47 |
| Fixed Asset Turnover | 0.88 | 7.16 |
| Payout Ratio | 31.34% | 0% |
| Dividend Yield | 1.08% | 0% |
Interpretation of the Ratios
Taiwan Semiconductor Manufacturing Company Limited
Taiwan Semiconductor Manufacturing Company Limited displays predominantly strong financial ratios, with a net margin of 40.02% and a favorable return on equity at 27.29%. The company maintains a solid current ratio of 2.36 and low debt levels, while concerns arise from its high price-to-earnings and price-to-book ratios. It pays dividends with a 1.08% yield, indicating moderate shareholder returns supported by sustainable free cash flow coverage.
Onto Innovation Inc.
Onto Innovation Inc. shows mixed ratios, featuring a favorable net margin at 20.43% and a strong interest coverage ratio, but a higher weighted average cost of capital at 10.61% and unfavorable price multiples. The current ratio is unusually high, which may indicate inefficiency. Onto Innovation does not pay dividends, likely focusing on reinvestment and growth, consistent with its high research and development expense ratio.
Which one has the best ratios?
Taiwan Semiconductor Manufacturing Company Limited holds a more favorable overall ratio profile, with stronger profitability, leverage, and liquidity measures. Onto Innovation Inc. presents a more neutral stance, affected by valuation concerns and an unbalanced current ratio. Thus, Taiwan Semiconductor Manufacturing Company Limited’s ratios are generally more robust compared to Onto Innovation’s.
Strategic Positioning
This section compares the strategic positioning of TSM and ONTO, including market position, key segments, and exposure to technological disruption:
TSM
- Leading global semiconductor foundry with strong competitive pressure in diverse markets
- Focuses on wafer fabrication for high performance computing, smartphones, IoT, automotive
- Invests in technology startups; exposed to semiconductor manufacturing process innovations
ONTO
- Smaller semiconductor process control tools provider facing competition in niche markets
- Designs and manufactures process control tools, software, and services for semiconductor fabs
- Exposed to disruption in optical metrology and process control software within semiconductor industry
TSM vs ONTO Positioning
TSM operates a diversified business centered on wafer fabrication across global high-tech sectors, offering scale advantages. ONTO concentrates on process control tools and software with a narrower product scope, focusing on specialized semiconductor manufacturing processes.
Which has the best competitive advantage?
TSM shows a slightly favorable moat by creating value despite declining profitability, indicating a moderate competitive advantage. ONTO has a slightly unfavorable moat, currently shedding value but improving profitability, suggesting a weaker competitive position.
Stock Comparison
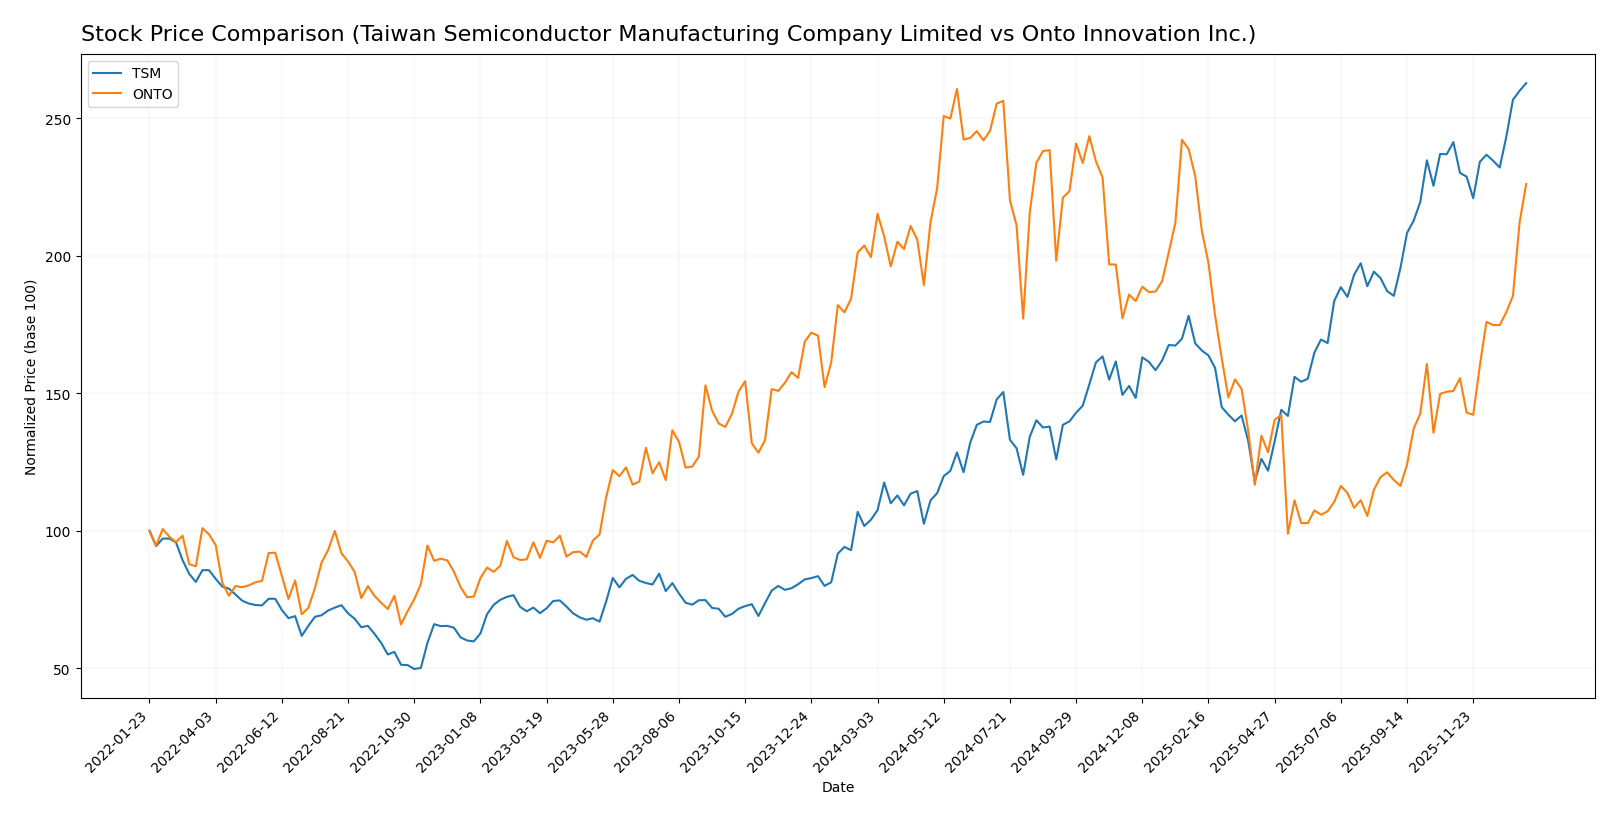
The stock price movements of Taiwan Semiconductor Manufacturing Company Limited (TSM) and Onto Innovation Inc. (ONTO) over the past year reveal distinct bullish trends, with TSM showing strong acceleration and higher volatility, while ONTO demonstrates a notable recent surge in price and buyer dominance.
Trend Analysis
Taiwan Semiconductor Manufacturing Company Limited (TSM) experienced a bullish trend over the past 12 months with a 152.54% price increase, marked by acceleration and a high standard deviation of 51.25. The stock ranged between 127.7 and 327.11.
Onto Innovation Inc. (ONTO) also showed a bullish trend with a 13.31% price increase over the same period, supported by acceleration and a standard deviation of 42.43. The recent period saw a stronger 49.83% rise indicating increased buyer dominance.
Comparing both, TSM delivered the highest market performance over the past year with a significantly larger price increase, despite ONTO’s recent strong upward momentum and increasing volume trend.
Target Prices
The current analyst consensus presents clear target price ranges for both Taiwan Semiconductor Manufacturing Company Limited and Onto Innovation Inc.
| Company | Target High | Target Low | Consensus |
|---|---|---|---|
| Taiwan Semiconductor Manufacturing Company Limited | 400 | 330 | 361.25 |
| Onto Innovation Inc. | 200 | 160 | 178 |
Analysts expect TSM’s price to rise from 327.11 toward the consensus of 361.25, indicating moderate upside potential. Onto Innovation’s consensus target of 178 is below its current price of 202.21, suggesting a possible price correction.
Analyst Opinions Comparison
This section compares analysts’ ratings and grades for Taiwan Semiconductor Manufacturing Company Limited (TSM) and Onto Innovation Inc. (ONTO):
Rating Comparison
TSM Rating
- Rating: A- indicating a very favorable overall assessment
- Discounted Cash Flow Score: 5, very favorable, strong valuation based on future cash flow
- Return on Equity Score: 5, very favorable, excellent profit generation from equity
- Return on Assets Score: 5, very favorable, highly effective asset utilization
- Debt To Equity Score: 3, moderate, moderate financial risk
- Overall Score: 4, favorable overall financial standing
ONTO Rating
- Rating: B+ indicating a very favorable overall assessment
- Discounted Cash Flow Score: 3, moderate, neutral valuation based on cash flow
- Return on Equity Score: 3, moderate, average efficiency in generating profits
- Return on Assets Score: 4, favorable, good asset utilization
- Debt To Equity Score: 4, favorable, relatively lower financial risk
- Overall Score: 3, moderate overall financial standing
Which one is the best rated?
Based on the provided ratings and scores, TSM is better rated overall with higher marks in discounted cash flow, return on equity, and return on assets. ONTO shows moderate to favorable scores but generally ranks below TSM on key financial metrics.
Scores Comparison
Here is a comparison of the Altman Z-Score and Piotroski Score for the two companies:
TSM Scores
- Altman Z-Score: 2.94, indicating moderate bankruptcy risk in grey zone.
- Piotroski Score: 8, showing very strong financial health.
ONTO Scores
- Altman Z-Score: 34.16, indicating very low bankruptcy risk in safe zone.
- Piotroski Score: 4, indicating average financial strength.
Which company has the best scores?
ONTO’s Altman Z-Score is significantly higher, placing it in the safe zone, while TSM’s is in the grey zone. Conversely, TSM has a much stronger Piotroski Score than ONTO, reflecting better financial health by that metric.
Grades Comparison
The following is a comparison of the most recent reliable grades for the two companies:
Taiwan Semiconductor Manufacturing Company Limited Grades
Here are the latest grades assigned by established financial analysts for TSM:
| Grading Company | Action | New Grade | Date |
|---|---|---|---|
| Bernstein | Maintain | Outperform | 2025-12-08 |
| Needham | Maintain | Buy | 2025-10-27 |
| Barclays | Maintain | Overweight | 2025-10-17 |
| Needham | Maintain | Buy | 2025-10-16 |
| Susquehanna | Maintain | Positive | 2025-10-10 |
| Barclays | Maintain | Overweight | 2025-10-09 |
| Barclays | Maintain | Overweight | 2025-09-16 |
| Needham | Maintain | Buy | 2025-07-17 |
| Susquehanna | Maintain | Positive | 2025-07-14 |
| Needham | Maintain | Buy | 2025-07-01 |
The overall trend shows consistently positive ratings, predominantly “Buy” or equivalent, indicating strong analyst confidence.
Onto Innovation Inc. Grades
Below are the recent grades provided by recognized grading companies for ONTO:
| Grading Company | Action | New Grade | Date |
|---|---|---|---|
| Needham | Maintain | Buy | 2026-01-06 |
| Jefferies | Maintain | Buy | 2025-12-15 |
| Needham | Maintain | Buy | 2025-11-18 |
| B. Riley Securities | Maintain | Buy | 2025-11-18 |
| Evercore ISI Group | Maintain | Outperform | 2025-11-05 |
| Oppenheimer | Maintain | Outperform | 2025-10-14 |
| Stifel | Maintain | Hold | 2025-10-13 |
| B. Riley Securities | Maintain | Buy | 2025-10-10 |
| Jefferies | Upgrade | Buy | 2025-09-23 |
| Benchmark | Maintain | Buy | 2025-08-08 |
The consensus is predominantly “Buy,” with some “Outperform” ratings and a single “Hold,” suggesting generally favorable analyst views.
Which company has the best grades?
Both TSM and ONTO have received mostly “Buy” and equivalent grades from analysts, but TSM’s ratings are consistently positive with no “Hold” grades, while ONTO has a mix including “Hold.” This implies TSM has slightly stronger analyst endorsement, potentially signaling lower perceived risk for investors.
Strengths and Weaknesses
Below is a comparative overview of key strengths and weaknesses for Taiwan Semiconductor Manufacturing Company Limited (TSM) and Onto Innovation Inc. (ONTO) based on the latest financial and operational data.
| Criterion | Taiwan Semiconductor Manufacturing Company Limited (TSM) | Onto Innovation Inc. (ONTO) |
|---|---|---|
| Diversification | High product diversification with strong wafer segment and other products totaling over 3.8T TWD in 2024 | Moderate diversification with systems, software, parts, and service revenues around 1B USD in 2024 |
| Profitability | Strong profitability: Net margin 40.02%, ROE 27.29%, ROIC 20%, consistent value creation | Moderate profitability: Net margin 20.43%, ROE 10.47%, ROIC 8.77%, currently shedding value but improving |
| Innovation | Leading semiconductor technology, strong R&D focus, maintaining competitive edge | Focus on innovation in semiconductor process control and metrology, showing improving returns |
| Global presence | Extensive global footprint as the world’s largest contract chipmaker | Smaller global presence, niche market focus in semiconductor equipment |
| Market Share | Market leader in semiconductor foundry with dominant wafer production | Smaller market share, growing presence in specialized semiconductor manufacturing tools |
Key takeaways: TSM excels with strong profitability, global scale, and market leadership but faces a slight decline in ROIC trend. ONTO shows improving profitability and innovation but still operates at a smaller scale with less diversification and currently destroys value. Investors should weigh TSM’s stability against ONTO’s growth potential and risk profile.
Risk Analysis
Below is a comparison table of key risks for Taiwan Semiconductor Manufacturing Company Limited (TSM) and Onto Innovation Inc. (ONTO) as of 2024-2026:
| Metric | Taiwan Semiconductor Manufacturing Company Limited (TSM) | Onto Innovation Inc. (ONTO) |
|---|---|---|
| Market Risk | High beta (1.274) indicating sensitivity to market swings; semiconductor cyclicality | Higher beta (1.461), more volatile, smaller market cap increases risk |
| Debt level | Low debt-to-equity (0.25) and debt-to-assets (15.65%), strong interest coverage | Very low debt (D/E 0.01), excellent interest coverage |
| Regulatory Risk | Moderate, geopolitical tensions in Taiwan-China relations could affect operations | Moderate, US-based but exposed to export controls and tech regulations |
| Operational Risk | Complex manufacturing with high capex; supply chain disruptions possible | Lower scale but dependent on semiconductor equipment demand and tech innovation |
| Environmental Risk | Growing focus on sustainability; energy-intensive manufacturing | Moderate, focus on precision tools with less environmental footprint |
| Geopolitical Risk | High due to Taiwan location amid US-China tech rivalry | Moderate, US-based but affected by global semiconductor trade policies |
The most impactful risks for TSM stem from geopolitical tensions in Taiwan and market cyclicality in semiconductors, while Onto Innovation faces higher volatility and regulatory uncertainties but benefits from very low debt and a stable financial profile. Investors should weigh geopolitical risks heavily for TSM and monitor market demand shifts closely for ONTO.
Which Stock to Choose?
Taiwan Semiconductor Manufacturing Company Limited (TSM) displays a strong income evolution with a 33.89% revenue growth in 2024 and favorable profitability metrics, including a 40.02% net margin and 27.29% ROE. Its debt levels are moderate with a net debt to EBITDA ratio of -0.54 and a very favorable overall rating of A-, supported by strong financial ratios and a slightly favorable MOAT despite a declining ROIC trend.
Onto Innovation Inc. (ONTO) shows solid income growth with a 21.01% revenue increase and consistently favorable margins, including a 20.43% net margin. Financial ratios are mixed, with some favorable debt metrics but a neutral global ratio evaluation and a slightly unfavorable MOAT due to ROIC below WACC, despite an improving profitability trend. Its overall rating is B+, reflecting moderate scores across key financial metrics.
For investors prioritizing stability and established profitability, TSM’s favorable rating and income statement strength might appear more attractive, whereas those focused on growth potential and improving profitability could find ONTO’s rising ROIC and dynamic earnings growth more compelling. The choice could thus depend on the investor’s risk tolerance and strategic preference.
Disclaimer: Investment carries a risk of loss of initial capital. The past performance is not a reliable indicator of future results. Be sure to understand risks before making an investment decision.
Go Further
I encourage you to read the complete analyses of Taiwan Semiconductor Manufacturing Company Limited and Onto Innovation Inc. to enhance your investment decisions: