Home > Comparison > Technology > STM vs ONTO
The strategic rivalry between STMicroelectronics N.V. and Onto Innovation Inc. shapes the semiconductor sector’s evolution. STMicroelectronics operates as a diversified semiconductor manufacturer with a broad product portfolio and global scale. Onto Innovation specializes in high-precision process control tools, offering niche technological solutions. This analysis contrasts their growth trajectories and capital allocation strategies to identify which company presents superior risk-adjusted potential for a balanced, technology-focused portfolio.
Table of contents
Companies Overview
STMicroelectronics and Onto Innovation stand as key players shaping the semiconductor industry landscape in 2026.
STMicroelectronics: Global Semiconductor Powerhouse
STMicroelectronics dominates as a global semiconductor designer and manufacturer with a diverse portfolio spanning automotive ICs, MEMS sensors, and microcontrollers. Its revenue engine revolves around integrated circuit sales across automotive, industrial, and personal electronics markets. In 2026, the company focuses on expanding its automotive and analog semiconductor segments to capture growing demand in electric vehicles and IoT devices.
Onto Innovation: Precision Process Control Leader
Onto Innovation excels as a specialist in semiconductor process control tools, offering inspection, lithography, and analytical software solutions. It generates revenue through sales and support of advanced metrology and defect inspection equipment vital for wafer and device manufacturing. The company’s 2026 strategy centers on enhancing software integration and expanding device packaging capabilities to improve yield management for chip manufacturers.
Strategic Collision: Similarities & Divergences
STMicroelectronics pursues a broad-based semiconductor product strategy, while Onto Innovation concentrates on niche process control technologies. Their primary battleground lies in supporting semiconductor production—STM with components, Onto with manufacturing precision tools. This contrast creates distinct investment profiles: STM’s scale and diversified product moat versus Onto’s specialized technological edge within a smaller market niche.
Income Statement Comparison
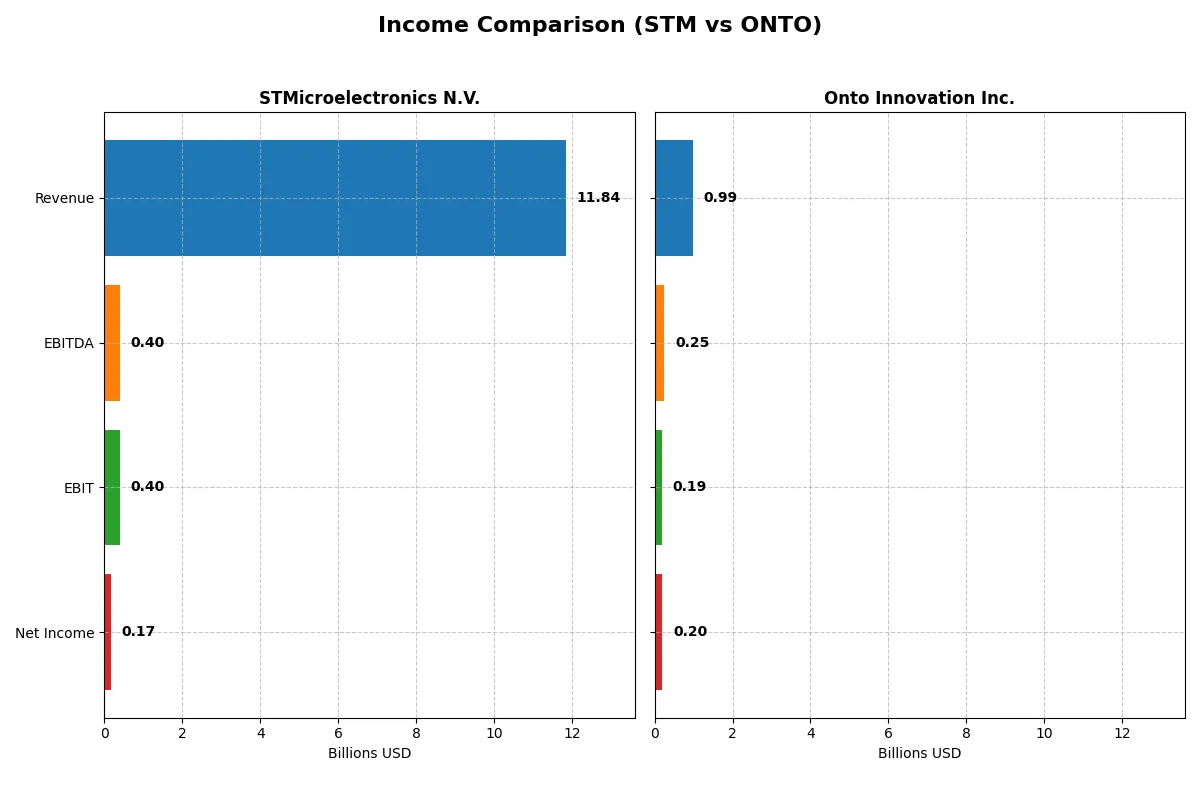
The following data dissects the core profitability and scalability of both corporate engines to reveal who dominates the bottom line:
| Metric | STMicroelectronics N.V. (STM) | Onto Innovation Inc. (ONTO) |
|---|---|---|
| Revenue | 11.8B | 987M |
| Cost of Revenue | 7.8B | 472M |
| Operating Expenses | 3.7B | 328M |
| Gross Profit | 4.0B | 515M |
| EBITDA | 401M | 249M |
| EBIT | 401M | 187M |
| Interest Expense | 0 | 0 |
| Net Income | 167M | 202M |
| EPS | 0.19 | 4.09 |
| Fiscal Year | 2025 | 2024 |
Income Statement Analysis: The Bottom-Line Duel
This income statement comparison reveals which company operates with greater efficiency and sustainable profitability through recent market cycles.
STMicroelectronics N.V. Analysis
STMicroelectronics shows a declining revenue trend from 17.3B in 2023 to 11.8B in 2025, with net income falling steeply from 4.2B to 167M. Gross margin contracts to 33.9%, reflecting cost pressures, while net margin slips to 1.4%. The latest year signals weakening momentum and margin compression, undermining operational efficiency.
Onto Innovation Inc. Analysis
Onto Innovation advances revenue from 788M in 2021 to 987M in 2024, with net income rising sharply to 202M. It sustains a robust gross margin above 52% and net margin at 20.4%. The firm accelerates earnings growth and margin expansion, demonstrating strong operational leverage and effective cost management in recent years.
Verdict: Margin Power vs. Revenue Scale
Onto Innovation outperforms STMicroelectronics in profitability and growth, boasting superior margins and consistent earnings momentum. STMicroelectronics suffers from margin erosion and declining net income despite larger scale. Investors seeking efficient profit generators should find Onto’s profile more attractive, while ST’s challenges warrant cautious scrutiny.
Financial Ratios Comparison
These vital ratios act as a diagnostic tool to expose the underlying fiscal health, valuation premiums, and capital efficiency of the companies analyzed:
| Ratios | STMicroelectronics N.V. (STM) | Onto Innovation Inc. (ONTO) |
|---|---|---|
| ROE | 8.9% (2024) | 10.5% (2024) |
| ROIC | 6.3% (2024) | 8.8% (2024) |
| P/E | 14.4 (2024) | 41.8 (2024) |
| P/B | 1.29 (2024) | 4.37 (2024) |
| Current Ratio | 3.11 (2024) | 8.69 (2024) |
| Quick Ratio | 2.37 (2024) | 7.00 (2024) |
| D/E | 0.18 (2024) | 0.01 (2024) |
| Debt-to-Assets | 12.8% (2024) | 0.7% (2024) |
| Interest Coverage | 19.7 (2024) | N/A |
| Asset Turnover | 0.54 (2024) | 0.47 (2024) |
| Fixed Asset Turnover | 1.22 (2024) | 7.16 (2024) |
| Payout Ratio | 18.5% (2024) | 0% |
| Dividend Yield | 1.28% (2024) | 0% |
| Fiscal Year | 2024 | 2024 |
Efficiency & Valuation Duel: The Vital Signs
Financial ratios act as a company’s DNA, exposing hidden operational strengths and risks that shape investment outcomes.
STMicroelectronics N.V.
STMicroelectronics shows weak profitability with a 0.93% ROE and 1.41% net margin, signaling operational challenges. Valuation metrics like P/E and P/B are favorable, suggesting the stock is attractively priced. The company pays no dividends, instead reinvesting heavily in R&D, allocating about 16% of revenue to innovation.
Onto Innovation Inc.
Onto Innovation delivers stronger profitability with a 10.47% ROE and a robust 20.43% net margin, but trades at a stretched valuation, with a P/E of 41.76 and P/B of 4.37. It does not distribute dividends, focusing on growth and maintaining a low debt level, while its asset turnover remains modest at 0.47.
Premium Valuation vs. Operational Safety
Both companies present neutral overall ratio profiles, yet Onto Innovation offers higher profitability at a steep premium. STMicroelectronics trades cheaper but struggles with returns. Investors prioritizing growth may lean toward Onto; those valuing operational prudence might prefer STMicroelectronics’ conservative valuation.
Which one offers the Superior Shareholder Reward?
I observe STMicroelectronics (STM) pays a modest dividend yield around 1.28% in 2024, with a conservative payout ratio near 18.5%. Onto Innovation (ONTO) pays no dividends but generates robust free cash flow, reinvesting heavily in growth. STM’s dividend is covered less comfortably due to negative free cash flow in 2025, raising sustainability concerns. Conversely, ONTO’s share buybacks are absent, but its strong free cash flow margin (~87%) and low debt signal capacity for future buybacks or acquisitions. STM executes moderate buybacks historically, supporting shareholder returns alongside dividends. I conclude STM offers a more balanced immediate yield and buyback mix, but ONTO’s reinvestment strategy may yield superior long-term capital gains. For 2026 investors prioritizing income and stability, STM leads; growth-focused investors should watch ONTO’s reinvestment payoff.
Comparative Score Analysis: The Strategic Profile
The radar chart reveals the fundamental DNA and trade-offs of STMicroelectronics N.V. and Onto Innovation Inc., highlighting their distinct financial strengths and weaknesses:
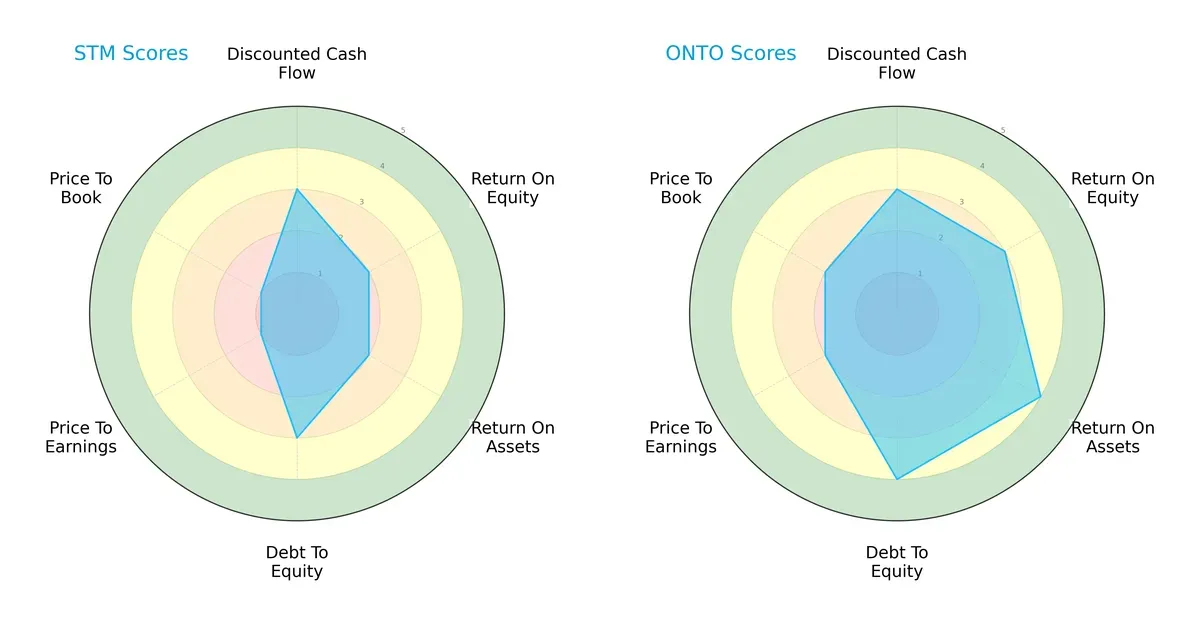
Onto Innovation offers a more balanced profile with favorable ROA (4) and debt-to-equity (4) scores, indicating operational efficiency and lower financial risk. STMicroelectronics leans on moderate DCF (3) and debt-to-equity (3) but suffers from weak valuation metrics (PE/PB scores at 1), signaling possible overvaluation. Onto’s broader strength across profitability and capital structure contrasts with STMicroelectronics’ reliance on select edges.
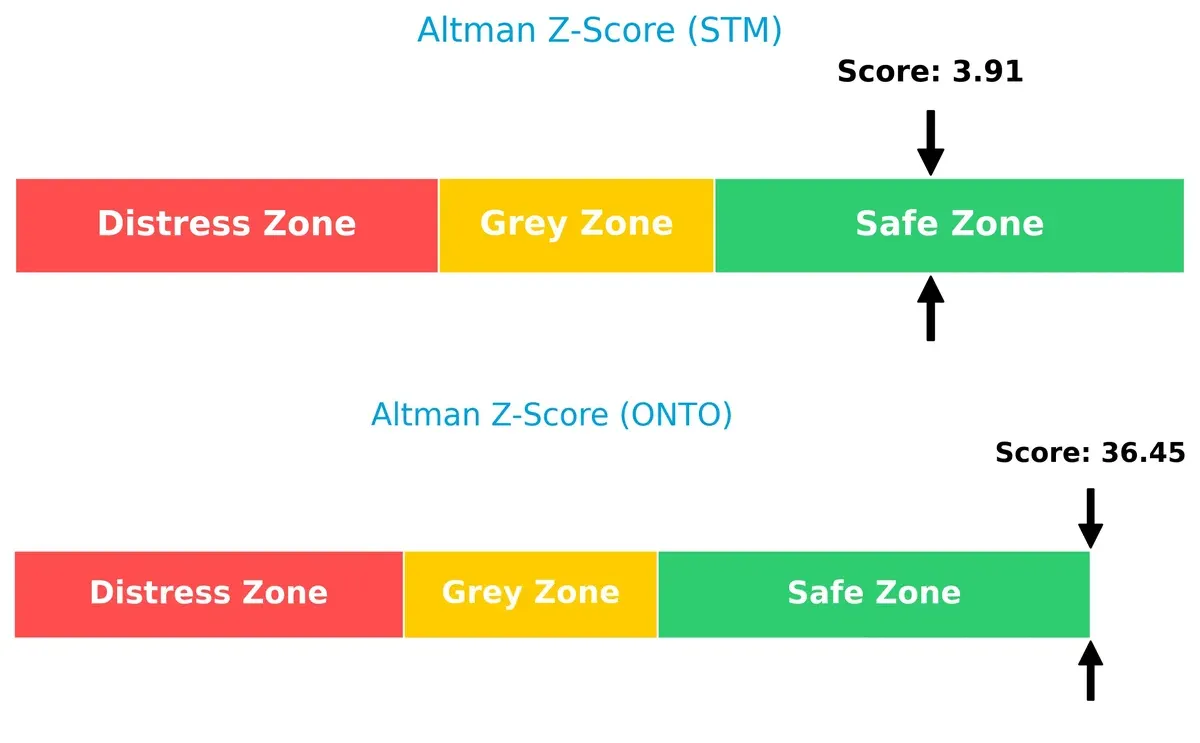
Bankruptcy Risk: Solvency Showdown
Onto Innovation’s Altman Z-Score vastly outperforms STMicroelectronics (36.45 vs. 3.91), both in the safe zone, but Onto’s score implies exceptional resilience and a lower bankruptcy risk in this cycle:
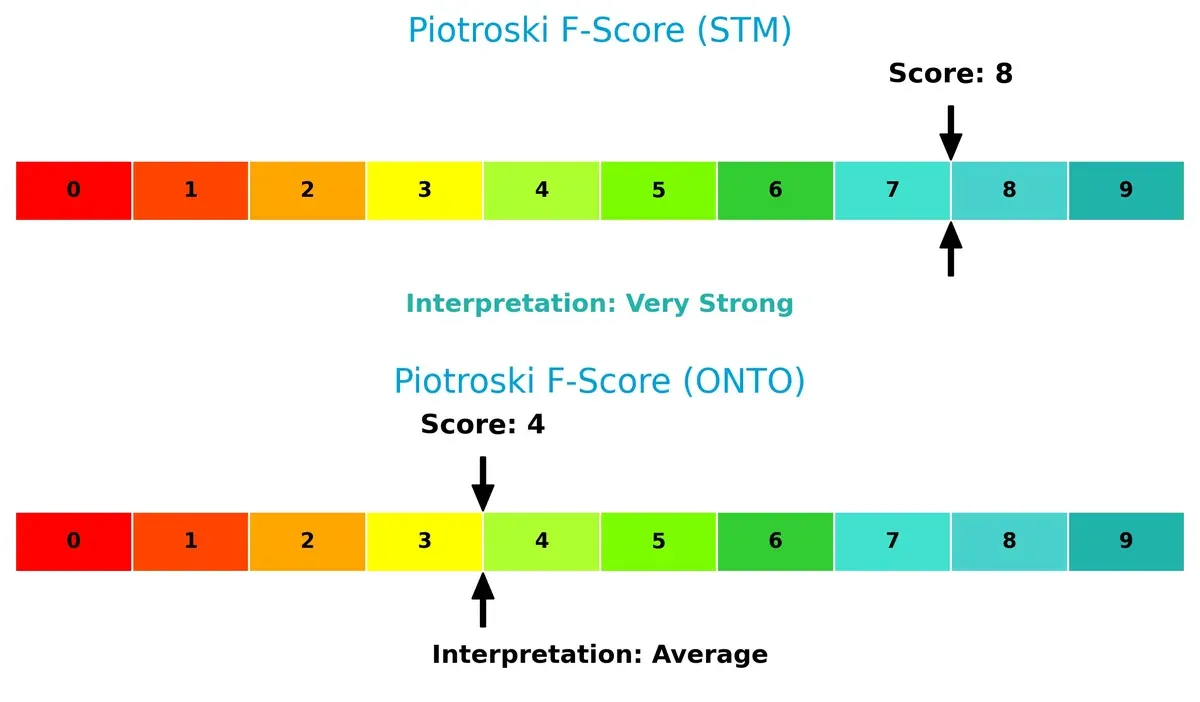
Financial Health: Quality of Operations
STMicroelectronics scores an 8 in Piotroski F-Score, indicating very strong financial health and robust internal metrics. Onto Innovation’s 4 signals average health, highlighting potential red flags in operational efficiency or profitability:
How are the two companies positioned?
This section dissects STM and ONTO’s operational DNA by comparing revenue distribution and internal dynamics. The goal is to confront their economic moats and reveal the more resilient, sustainable competitive advantage today.
Revenue Segmentation: The Strategic Mix
The following visual comparison dissects how STMicroelectronics N.V. and Onto Innovation Inc. diversify their income streams and where their primary sector bets lie:
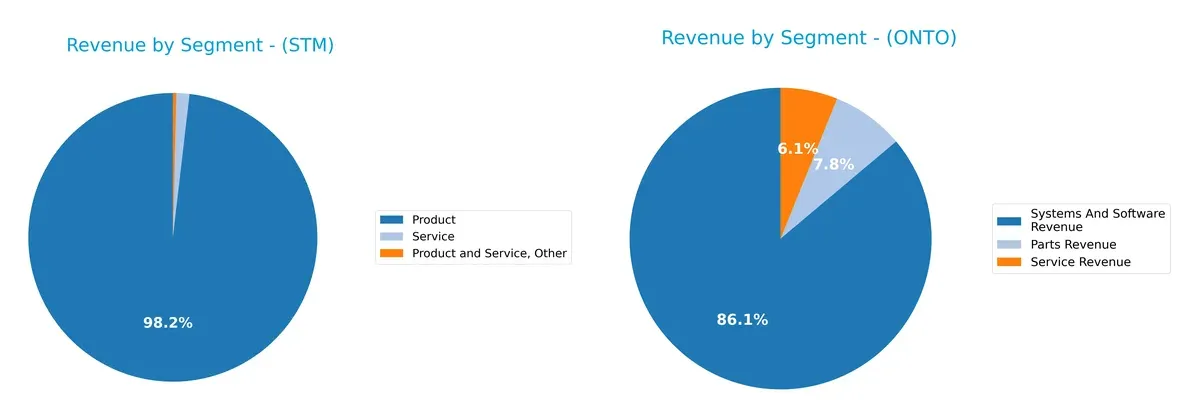
STMicroelectronics anchors its revenue in “Product” sales, generating $13.2B in 2024, dwarfing its $196M services and $52M other segments. Onto Innovation pivots on “Systems And Software Revenue” with $850M, complemented by $76M parts and $60M services. STM’s heavy product reliance signals concentration risk but benefits from industrial scale. Onto’s more balanced segmentation spreads risk and supports ecosystem lock-in through integrated software solutions.
Strengths and Weaknesses Comparison
This table compares the strengths and weaknesses of STMicroelectronics and Onto Innovation based on key financial and market factors:
STM Strengths
- Diversified product segments with strong global footprint
- Favorable debt metrics and interest coverage
- Quick ratio indicates liquidity
- Presence in multiple major markets including US, Asia, and Europe
ONTO Strengths
- High net margin shows profitability
- Strong fixed asset turnover signals efficient asset use
- Favorable debt and interest coverage
- Expanding systems and software revenues with global reach
STM Weaknesses
- Low profitability ratios (net margin, ROE, ROIC)
- Unfavorable current ratio suggests liquidity risk
- Asset turnover below industry norms
- No dividend yield
ONTO Weaknesses
- High WACC indicates costly capital
- Unfavorable valuation multiples (PE, PB)
- Unfavorable current ratio despite strong quick ratio
- No dividend yield
STM demonstrates broad diversification and solid financial stability but struggles with profitability and operational efficiency. ONTO excels in profitability and asset utilization yet faces valuation and capital cost challenges. These contrasts highlight differing strategic priorities and financial health profiles.
The Moat Duel: Analyzing Competitive Defensibility
A structural moat is the only thing protecting long-term profits from relentless competition erosion. Let’s break down the competitive moats of these two semiconductor players:
STMicroelectronics N.V.: Broad Industrial Footprint with Cost Pressure
STM’s moat stems from its diversified product portfolio and scale in automotive and industrial chips. However, declining ROIC and shrinking margins reveal cost pressures and value destruction. In 2026, new analog and power transistor launches aim to stabilize margins but face fierce competition.
Onto Innovation Inc.: Specialized Process Control with Emerging Profitability
ONTO leverages specialized process control tools and software, creating high switching costs for customers. Unlike STM, ONTO shows a rising ROIC trend and expanding margins. Growth in advanced packaging markets could deepen its competitive edge and improve value creation in 2026.
Verdict: Diversification vs. Focused Efficiency
STM’s wide industrial footprint faces margin compression and declining ROIC, signaling a weakening moat. ONTO’s focused niche and improving profitability suggest a deeper, more sustainable moat. I see ONTO better equipped to defend and expand market share over the next cycle.
Which stock offers better returns?
The past year shows contrasting price dynamics: STMicroelectronics N.V. suffered a sharp decline, while Onto Innovation Inc. posted a modest gain amid volatile trading.
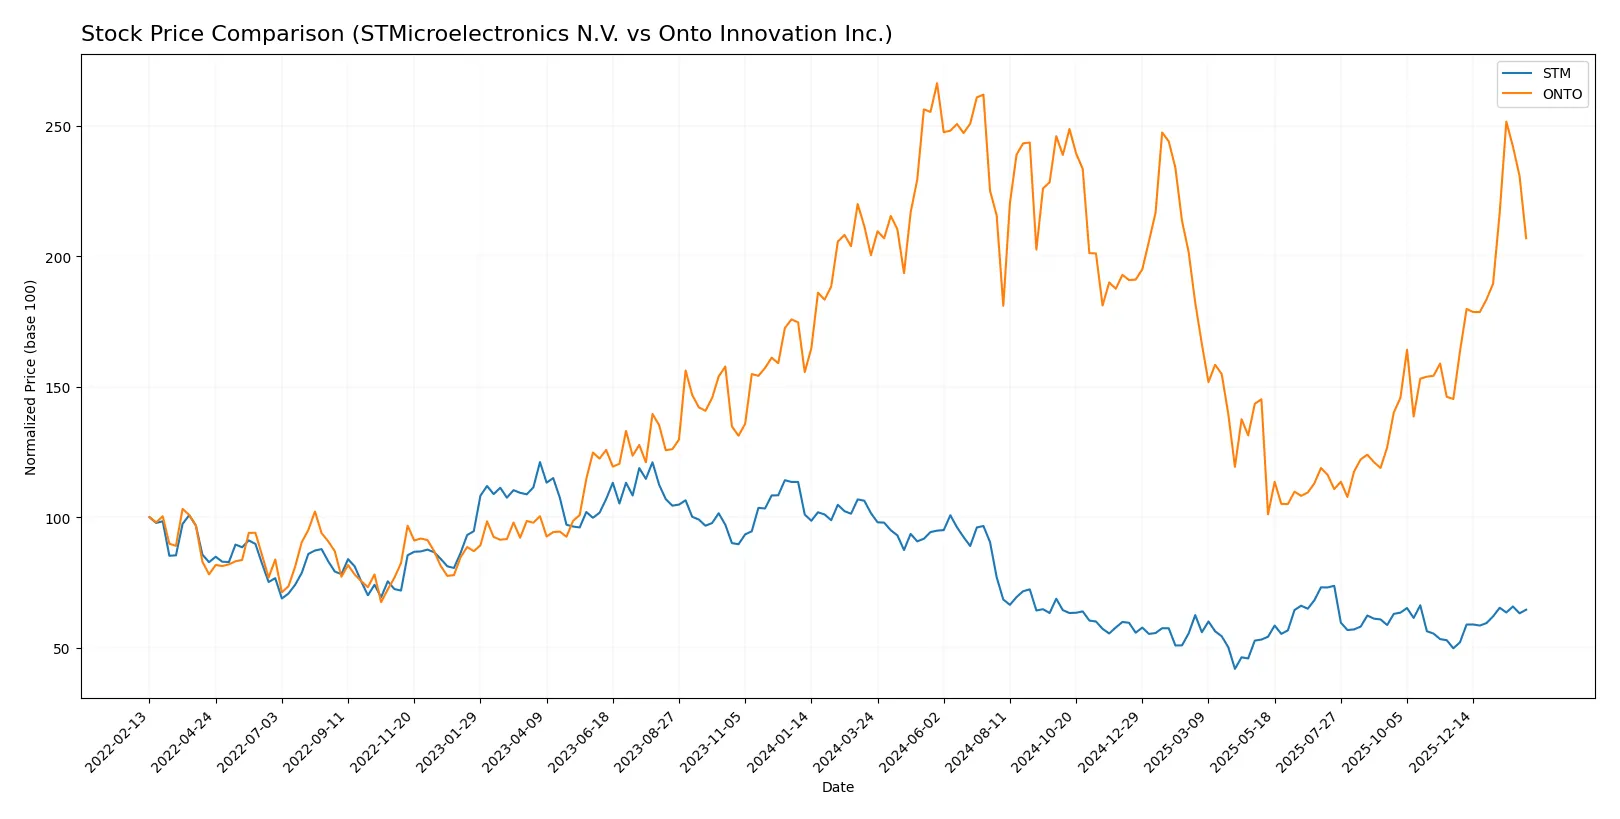
Trend Comparison
STMicroelectronics N.V. experienced a bearish trend over the past 12 months with a -36.44% price drop, accelerating losses, and a volatility of 6.54%. The price ranged from 44.85 to 18.49.
Onto Innovation Inc. showed a bullish trend with a 3.24% gain over 12 months, accelerating upward momentum despite high volatility at 42.97%. The stock ranged between 88.5 and 233.14.
Comparing both, Onto Innovation delivered the highest market performance with a positive return, while STMicroelectronics declined significantly over the past year.
Target Prices
Analyst consensus suggests significant upside potential for both STMicroelectronics N.V. and Onto Innovation Inc.
| Company | Target Low | Target High | Consensus |
|---|---|---|---|
| STMicroelectronics N.V. | 28 | 45 | 37.67 |
| Onto Innovation Inc. | 160 | 260 | 191.67 |
The consensus target prices imply a 32% upside for STMicroelectronics N.V. and a 6% upside for Onto Innovation Inc. relative to their current prices. Analysts expect stronger growth from STMicroelectronics, reflecting optimism in its semiconductor segments.

Don’t Let Luck Decide Your Entry Point
Optimize your entry points with our advanced ProRealTime indicators. You’ll get efficient buy signals with precise price targets for maximum performance. Start outperforming now!
How do institutions grade them?
STMicroelectronics N.V. Grades
The following table lists recent grades from reputable financial institutions for STMicroelectronics N.V.:
| Grading Company | Action | New Grade | Date |
|---|---|---|---|
| TD Cowen | Maintain | Buy | 2025-10-24 |
| Susquehanna | Maintain | Positive | 2025-10-22 |
| Susquehanna | Maintain | Positive | 2025-07-25 |
| Baird | Upgrade | Outperform | 2025-07-22 |
| Susquehanna | Maintain | Positive | 2025-07-22 |
| Jefferies | Upgrade | Buy | 2025-02-19 |
| Bernstein | Downgrade | Market Perform | 2025-02-05 |
| Susquehanna | Maintain | Positive | 2025-01-31 |
| Barclays | Downgrade | Underweight | 2025-01-22 |
| JP Morgan | Downgrade | Neutral | 2024-12-09 |
Onto Innovation Inc. Grades
The following table lists recent grades from reputable financial institutions for Onto Innovation Inc.:
| Grading Company | Action | New Grade | Date |
|---|---|---|---|
| Needham | Maintain | Buy | 2026-01-20 |
| B. Riley Securities | Maintain | Buy | 2026-01-15 |
| Stifel | Maintain | Hold | 2026-01-14 |
| Needham | Maintain | Buy | 2026-01-06 |
| Jefferies | Maintain | Buy | 2025-12-15 |
| Needham | Maintain | Buy | 2025-11-18 |
| B. Riley Securities | Maintain | Buy | 2025-11-18 |
| Evercore ISI Group | Maintain | Outperform | 2025-11-05 |
| Oppenheimer | Maintain | Outperform | 2025-10-14 |
| Stifel | Maintain | Hold | 2025-10-13 |
Which company has the best grades?
Onto Innovation Inc. consistently receives “Buy” and “Outperform” grades with no downgrades, indicating strong institutional confidence. STMicroelectronics shows a mix of upgrades and downgrades, reflecting more varied sentiment. Investors may view Onto Innovation’s steadier grading as a signal of more stable analyst conviction.
Risks specific to each company
The following categories identify the critical pressure points and systemic threats facing both firms in the 2026 market environment:
1. Market & Competition
STMicroelectronics N.V.
- Faces intense pressure from global semiconductor giants and cyclical demand shifts in automotive and industrial sectors.
Onto Innovation Inc.
- Operates in a niche process control market but struggles with volatile demand and strong competition from larger integrated equipment suppliers.
2. Capital Structure & Debt
STMicroelectronics N.V.
- Maintains a conservative debt profile with a low debt-to-equity ratio (0.12), supporting financial stability.
Onto Innovation Inc.
- Exhibits extremely low leverage (debt-to-equity 0.01), minimizing financial risk but potentially underutilizing capital for growth.
3. Stock Volatility
STMicroelectronics N.V.
- Beta at 1.32 indicates moderate volatility, typical for large-cap semiconductors exposed to market cycles.
Onto Innovation Inc.
- Higher beta of 1.48 suggests greater stock price swings, reflecting sensitivity to industry disruptions and investor sentiment.
4. Regulatory & Legal
STMicroelectronics N.V.
- Global operations expose STM to complex regulatory environments, including export controls and environmental compliance risks.
Onto Innovation Inc.
- US-based with stricter domestic regulations but less geographic regulatory complexity; potential legal risks in high-tech patents and IP.
5. Supply Chain & Operations
STMicroelectronics N.V.
- Large-scale manufacturing depends on complex global supply chains vulnerable to geopolitical tensions and semiconductor material shortages.
Onto Innovation Inc.
- Supply chain less complex but reliant on specialized components and advanced manufacturing equipment, susceptible to supplier disruptions.
6. ESG & Climate Transition
STMicroelectronics N.V.
- Faces increasing pressure to reduce carbon footprint across global manufacturing sites and comply with evolving ESG regulations.
Onto Innovation Inc.
- ESG initiatives less mature; climate transition risks could impact capital access and customer preferences in semiconductor equipment markets.
7. Geopolitical Exposure
STMicroelectronics N.V.
- Significant exposure to Europe, Asia, and Americas; geopolitical tensions in Asia-Pacific pose supply and market risks.
Onto Innovation Inc.
- Primarily US-focused but vulnerable to trade tensions affecting semiconductor equipment exports and innovation partnerships.
Which company shows a better risk-adjusted profile?
STMicroelectronics’ primary risk is complex global supply chains amid geopolitical tensions. Onto Innovation’s key risk is volatile market demand amplified by high stock volatility. Despite STM’s moderate financial ratios and broad exposure risks, Onto’s elevated beta and stretched valuation metrics increase its risk profile. STM’s stable debt and solid Altman Z-score (3.9, safe zone) contrast with Onto’s higher valuation multiples and average Piotroski score (4), signaling weaker operational resilience. Overall, STM demonstrates a better risk-adjusted profile given its balanced leverage, strong liquidity, and diversified market footprint.
Final Verdict: Which stock to choose?
STMicroelectronics N.V. (STM) stands out for its robust liquidity and resilient asset base, signaling a cash-rich foundation. However, its shrinking profitability and declining ROIC warn of value erosion. STM suits investors who can tolerate volatility in pursuit of potential turnaround opportunities, fitting an Aggressive Growth profile.
Onto Innovation Inc. (ONTO) leverages a strategic moat via high-margin, asset-light operations and accelerating profitability. Its strong current and quick ratios provide a safety cushion absent in STM. ONTO appeals to those seeking a blend of growth and relative stability, aligning with a GARP (Growth at a Reasonable Price) approach.
If you prioritize turnaround potential and are comfortable with cyclical risks, STM offers a compelling scenario thanks to its solid balance sheet and recovery prospects. However, if you seek consistent profitability and a cleaner balance sheet, ONTO outshines STM by delivering superior margin expansion and operational efficiency. Both carry risks, but their appeal diverges by investor risk tolerance and investment horizon.
Disclaimer: Investment carries a risk of loss of initial capital. The past performance is not a reliable indicator of future results. Be sure to understand risks before making an investment decision.
Go Further
I encourage you to read the complete analyses of STMicroelectronics N.V. and Onto Innovation Inc. to enhance your investment decisions: