In the dynamic semiconductor industry, Qnity Electronics, Inc. and Onto Innovation Inc. stand out as key players driving technological progress. Both companies focus on advanced materials and process control solutions critical to chip manufacturing, making them natural competitors with overlapping markets. This comparison highlights their innovation strategies and growth potential, helping you decide which company could be the most compelling addition to your investment portfolio.
Table of contents
Companies Overview
I will begin the comparison between Qnity Electronics, Inc. and Onto Innovation Inc. by providing an overview of these two companies and their main differences.
Qnity Electronics, Inc. Overview
Qnity Electronics, Inc. specializes in providing electronic solutions and materials essential for semiconductor chip manufacturing and advanced electronic materials. Formerly known as Novus SpinCo 1, Inc., the company rebranded in April 2025. Based in Wilmington, Delaware, Qnity operates within the Technology sector, focusing on semiconductors and trading on the NYSE with a market cap of $19.5B.
Onto Innovation Inc. Overview
Onto Innovation Inc. designs, develops, manufactures, and supports process control tools including macro defect inspection, 2D/3D optical metrology, lithography systems, and analytical software. Founded in 1940 and headquartered in Wilmington, Massachusetts, Onto Innovation serves semiconductor and advanced device manufacturers globally. The company employs about 1,551 people, is listed on the NYSE, and has a market cap of $10.7B.
Key similarities and differences
Both companies operate in the semiconductor industry and trade on the NYSE in the Technology sector. Qnity focuses on providing materials and electronic solutions for chip manufacturing, while Onto Innovation delivers process control tools and software for defect inspection and yield management. Onto Innovation is more established with a larger workforce, whereas Qnity is a newer market participant with a higher market capitalization.
Income Statement Comparison
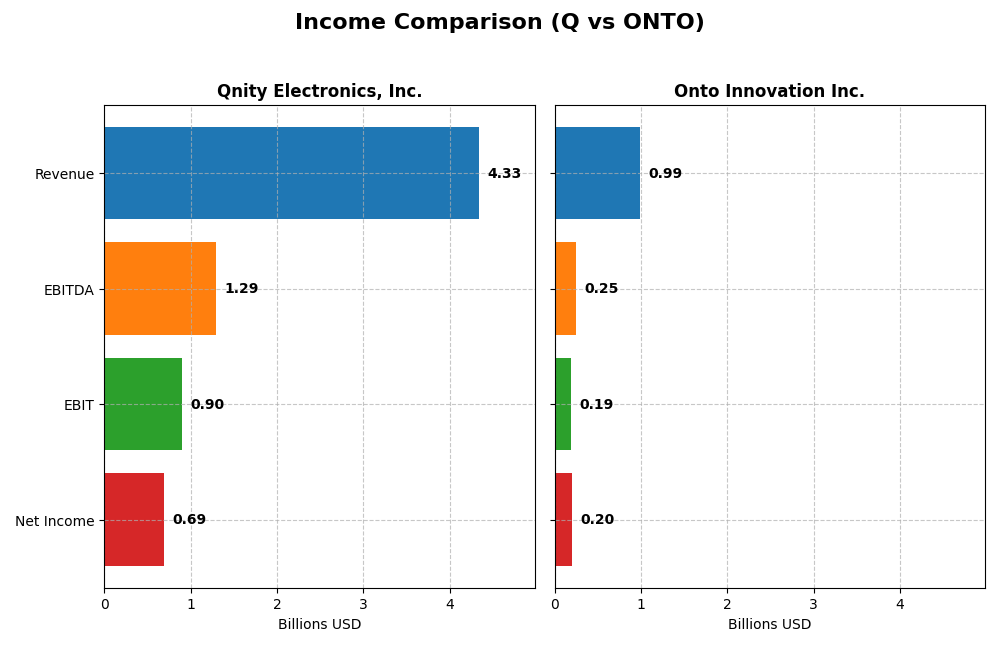
The table below presents a side-by-side comparison of the key income statement metrics for Qnity Electronics, Inc. and Onto Innovation Inc. for their most recent fiscal year 2024.
| Metric | Qnity Electronics, Inc. | Onto Innovation Inc. |
|---|---|---|
| Market Cap | 19.5B | 10.7B |
| Revenue | 4.34B | 987M |
| EBITDA | 1.29B | 249M |
| EBIT | 898M | 187M |
| Net Income | 693M | 202M |
| EPS | 3.31 | 4.09 |
| Fiscal Year | 2024 | 2024 |
Income Statement Interpretations
Qnity Electronics, Inc.
Qnity Electronics’ revenue declined from $4.76B in 2022 to $4.34B in 2024, with net income dropping from $774M to $693M in the same period. Margins showed some contraction overall, though the 2024 net margin remained favorable at 15.99%. The latest year saw moderate revenue growth of 7.43%, with net margin and earnings per share improving significantly, signaling operational efficiency gains.
Onto Innovation Inc.
Onto Innovation’s revenue rose strongly from $557M in 2020 to $987M in 2024, with net income surging from $31M to $202M. Margins improved consistently, with a 2024 net margin at 20.43%, reflecting strong profitability. The recent year showed favorable growth across revenue (21.01%), gross profit, EBIT, and EPS, indicating robust expansion and margin improvement over the period.
Which one has the stronger fundamentals?
Onto Innovation demonstrates stronger fundamentals with consistent revenue and net income growth exceeding 77% and 550% respectively over the period, alongside improving margins. Qnity Electronics, while profitable with favorable margins in 2024, faced revenue and net income declines overall. Onto’s comprehensive favorable growth and margin metrics suggest a more robust income statement trajectory.
Financial Ratios Comparison
The table below presents a side-by-side comparison of key financial ratios for Qnity Electronics, Inc. (Q) and Onto Innovation Inc. (ONTO) based on their most recent fiscal year data from 2024.
| Ratios | Qnity Electronics, Inc. (Q) | Onto Innovation Inc. (ONTO) |
|---|---|---|
| ROE | 6.51% | 10.47% |
| ROIC | 5.92% | 8.77% |
| P/E | 28.8 | 41.76 |
| P/B | 1.88 | 4.37 |
| Current Ratio | 1.77 | 8.69 |
| Quick Ratio | 1.06 | 7.00 |
| D/E | 0.018 | 0.008 |
| Debt-to-Assets | 1.56% | 0.72% |
| Interest Coverage | 3.03 | N/A |
| Asset Turnover | 0.35 | 0.47 |
| Fixed Asset Turnover | 2.59 | 7.16 |
| Payout Ratio | 0% | 0% |
| Dividend Yield | 0% | 0% |
Interpretation of the Ratios
Qnity Electronics, Inc.
Qnity Electronics shows a slightly favorable overall ratio profile with strengths in net margin (15.99%) and liquidity ratios, including a current ratio of 1.77 and low debt levels. However, return on equity (6.51%) and asset turnover (0.35) are weaker points. The company pays a modest dividend of $0.06 per share, but with a zero dividend yield, indicating limited shareholder return via dividends currently.
Onto Innovation Inc.
Onto Innovation presents a mixed ratio evaluation, with a strong net margin of 20.43% and excellent interest coverage, yet it faces unfavorable valuations with a high PE of 41.76 and a price-to-book ratio of 4.37. The current ratio is unusually high at 8.69 but marked unfavorable. Onto does not pay dividends, likely prioritizing reinvestment and R&D in its growth phase.
Which one has the best ratios?
Qnity Electronics appears more balanced with several favorable liquidity and leverage ratios, though returns could improve. Onto Innovation exhibits stronger profitability but higher valuation risks and less favorable liquidity. Both have equal favorable ratio percentages (42.86%), but Qnity’s slightly favorable global opinion contrasts with Onto’s neutral, suggesting different risk-return profiles for investors.
Strategic Positioning
This section compares the strategic positioning of Qnity Electronics, Inc. (Q) and Onto Innovation Inc. (ONTO), focusing on market position, key segments, and exposure to technological disruption:
Q
- Market position in semiconductor materials, stable profitability but no clear competitive advantage.
- Focused on electronic solutions and materials for semiconductor chip manufacturing.
- No explicit data on exposure to technological disruption provided.
ONTO
- Market position in semiconductor process control tools, facing competitive pressure with growing profitability.
- Diversified revenue from parts, services, systems, and software in process control and metrology.
- Products and software subject to rapid technological change in semiconductor manufacturing processes.
Q vs ONTO Positioning
Q concentrates on semiconductor materials with stable but neutral profitability, while ONTO operates diversified segments in process control with growing profitability. Q’s focused approach may limit growth avenues compared to ONTO’s broader exposure and evolving product base.
Which has the best competitive advantage?
Both companies are currently shedding value relative to their cost of capital. Q’s stable profitability indicates a neutral moat, whereas ONTO’s improving ROIC suggests growing profitability despite value destruction, reflecting a slightly unfavorable competitive advantage.
Stock Comparison
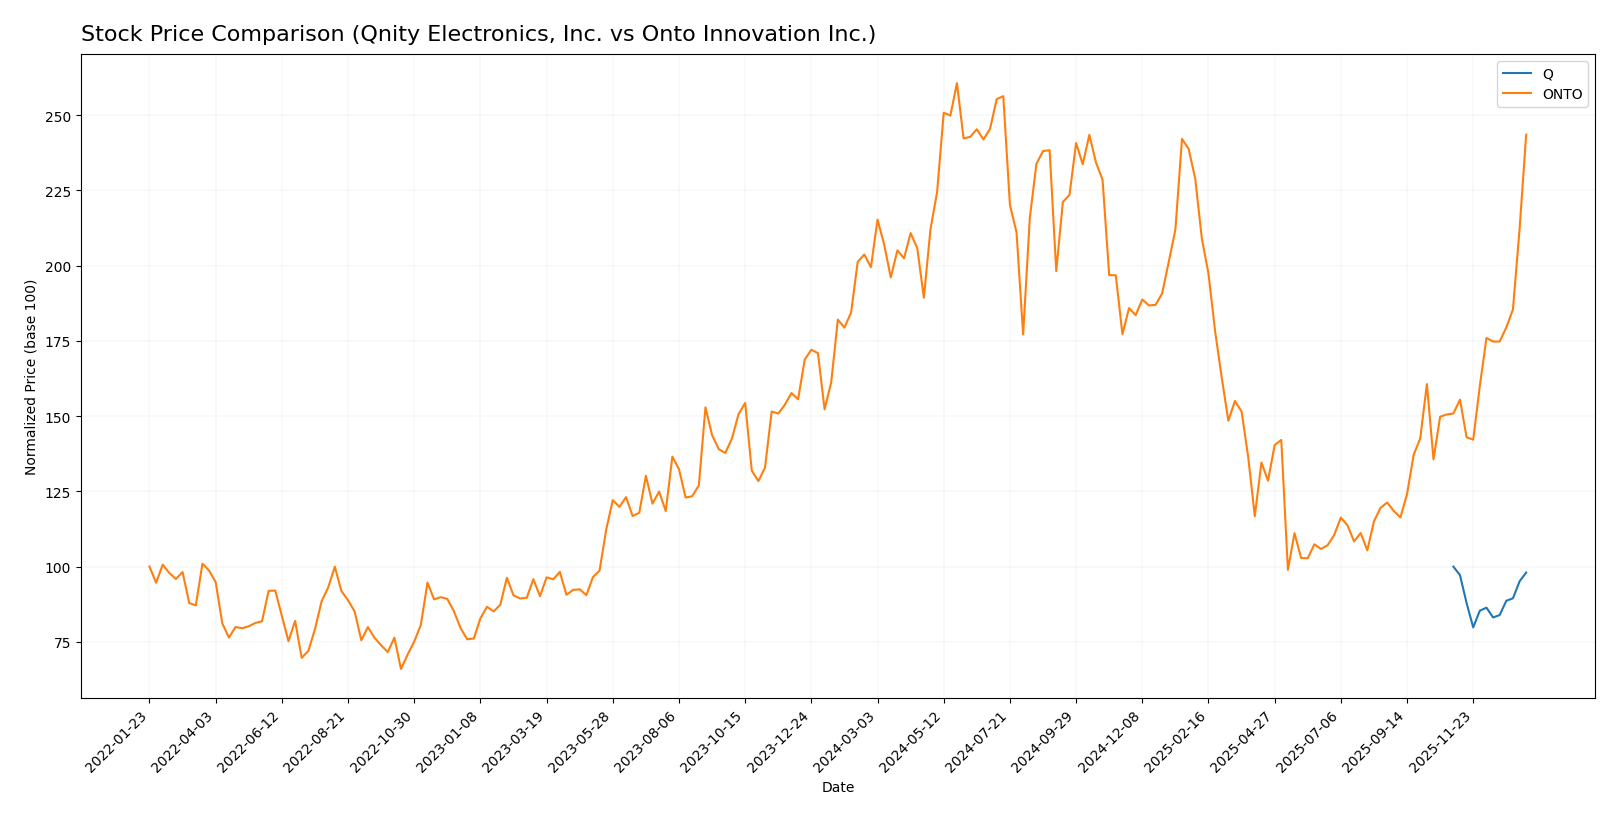
The stock price movements over the past 12 months reveal contrasting dynamics, with Qnity Electronics, Inc. showing slight decline and Onto Innovation Inc. experiencing significant growth and accelerating momentum.
Trend Analysis
Qnity Electronics, Inc. recorded a -1.98% price change over the past year, indicating a neutral to slight bearish trend with stable acceleration and a price range between 75.8 and 95.0. Onto Innovation Inc. posted a strong 22.07% gain with an accelerating bullish trend, displaying high volatility and a price range from 88.5 to 233.14. Comparing both, Onto Innovation delivered the highest market performance with a clear upward trajectory and increasing buyer dominance.
Target Prices
The consensus target prices reflect analysts’ positive outlook for both Qnity Electronics, Inc. and Onto Innovation Inc.
| Company | Target High | Target Low | Consensus |
|---|---|---|---|
| Qnity Electronics, Inc. | 117 | 92 | 105.89 |
| Onto Innovation Inc. | 200 | 160 | 178 |
Analysts expect Qnity Electronics’ stock to rise moderately from its current price of 93.12 USD, while Onto Innovation’s consensus target is below its current price of 217.85 USD, suggesting potential price correction or profit-taking ahead.
Analyst Opinions Comparison
This section compares analysts’ ratings and grades for Qnity Electronics, Inc. (Q) and Onto Innovation Inc. (ONTO):
Rating Comparison
Q Rating
- Rating: B+, classified as Very Favorable by analysts.
- Discounted Cash Flow Score: 4, indicating favorable valuation based on future cash flows.
- ROE Score: 3, reflecting moderate efficiency in generating profit from equity.
- ROA Score: 4, showing favorable asset utilization in generating earnings.
- Debt To Equity Score: 3, indicating moderate financial risk.
- Overall Score: 3, representing a moderate overall financial standing.
ONTO Rating
- Rating: B+, also classified as Very Favorable by analysts.
- Discounted Cash Flow Score: 3, showing a moderate valuation based on cash flows.
- ROE Score: 3, reflecting moderate efficiency in generating profit from equity.
- ROA Score: 4, also showing favorable asset utilization in generating earnings.
- Debt To Equity Score: 4, suggesting favorable financial stability with lower risk.
- Overall Score: 3, representing a moderate overall financial standing.
Which one is the best rated?
Both Q and ONTO share the same overall rating of B+ and an overall score of 3. Q scores better on discounted cash flow, while ONTO has a stronger debt-to-equity score. Their ratings reflect similar moderate financial health with slight differences in specific metrics.
Scores Comparison
Here is the comparison of the Altman Z-Score and Piotroski Score for the two companies:
Q Scores
- Altman Z-Score: Data not available
- Piotroski Score: Data not available
ONTO Scores
- Altman Z-Score: 34.16, indicating a safe zone for bankruptcy risk
- Piotroski Score: 4, reflecting an average financial strength
Which company has the best scores?
Based on the available data, ONTO Innovation shows a very strong Altman Z-Score indicating low bankruptcy risk, while its Piotroski Score is average. Qnity Electronics’ scores are not provided, so no comparison is possible.
Grades Comparison
The following section compares the recent grades assigned to Qnity Electronics, Inc. and Onto Innovation Inc.:
Qnity Electronics, Inc. Grades
This table summarizes the latest grades from reputable grading companies for Qnity Electronics, Inc.
| Grading Company | Action | New Grade | Date |
|---|---|---|---|
| RBC Capital | Maintain | Outperform | 2025-11-25 |
| Mizuho | Maintain | Outperform | 2025-11-20 |
Qnity Electronics, Inc. has consistently received “Outperform” ratings from two well-known firms, indicating a generally positive outlook.
Onto Innovation Inc. Grades
Below are the recent grades from recognized grading companies for Onto Innovation Inc.
| Grading Company | Action | New Grade | Date |
|---|---|---|---|
| Stifel | Maintain | Hold | 2026-01-14 |
| Needham | Maintain | Buy | 2026-01-06 |
| Jefferies | Maintain | Buy | 2025-12-15 |
| B. Riley Securities | Maintain | Buy | 2025-11-18 |
| Needham | Maintain | Buy | 2025-11-18 |
| Evercore ISI Group | Maintain | Outperform | 2025-11-05 |
| Oppenheimer | Maintain | Outperform | 2025-10-14 |
| Stifel | Maintain | Hold | 2025-10-13 |
| B. Riley Securities | Maintain | Buy | 2025-10-10 |
| Jefferies | Upgrade | Buy | 2025-09-23 |
Onto Innovation Inc. exhibits a range of ratings, predominantly “Buy” and “Outperform,” with a few “Hold” ratings, showing a generally favorable but mixed sentiment.
Which company has the best grades?
Onto Innovation Inc. has received a broader volume of positive grades, mostly “Buy” and some “Outperform,” compared to Qnity Electronics’ consistent “Outperform” ratings from fewer sources. Investors may interpret Onto’s higher number of favorable ratings as stronger market confidence, although Qnity’s uniform “Outperform” grades suggest steady optimism.
Strengths and Weaknesses
Below is a comparative overview of the strengths and weaknesses of Qnity Electronics, Inc. (Q) and Onto Innovation Inc. (ONTO) based on recent financial and strategic data:
| Criterion | Qnity Electronics, Inc. (Q) | Onto Innovation Inc. (ONTO) |
|---|---|---|
| Diversification | Moderate product range; limited revenue segmentation | Strong focus on Systems and Software (85% of revenue), with growing parts and service segments |
| Profitability | Net margin 16%, stable profitability but moderate ROIC (5.9%) | Higher net margin (20%) and improving ROIC (8.8%), though currently value-destructive overall |
| Innovation | Neutral ROIC trend, no clear competitive advantage | Growing ROIC trend indicates improving innovation impact and profitability potential |
| Global presence | Stable but limited information on geographic reach | Expanding global footprint supported by diversified product lines and strong systems sales |
| Market Share | Stable but non-dominant; neutral competitive moat | Slightly unfavorable moat status but rapidly increasing profitability suggests gaining market share |
Key takeaways: Qnity Electronics maintains a stable financial position with moderate profitability and diversification, but lacks a strong competitive moat. Onto Innovation shows dynamic growth in profitability and innovation, but still faces challenges in value creation and market dominance. Investors should weigh Onto’s growth potential against its current value destruction risk.
Risk Analysis
Below is a comparative overview of key risks associated with Qnity Electronics, Inc. and Onto Innovation Inc. as of 2026.
| Metric | Qnity Electronics, Inc. (Q) | Onto Innovation Inc. (ONTO) |
|---|---|---|
| Market Risk | Moderate; beta is 0 indicating low volatility | High; beta 1.461 suggests higher volatility |
| Debt level | Very low; debt-to-assets 1.56%, debt/equity 0.02 | Very low; debt-to-assets 0.72%, debt/equity 0.01 |
| Regulatory Risk | Moderate; semiconductor sector faces ongoing regulatory scrutiny | Moderate; similar sector regulatory exposure |
| Operational Risk | Moderate; new IPO in 2025, scaling operations | Moderate; established with 1551 employees, but complexity in manufacturing |
| Environmental Risk | Low; no major environmental liabilities reported | Low; no significant environmental concerns |
| Geopolitical Risk | Moderate; US-based with exposure to global supply chain disruptions | Moderate; US-based, similar global risks |
The most impactful risks are market volatility for Onto Innovation, driven by a high beta, and operational risks for Qnity Electronics given its recent IPO and growth phase. Both companies maintain very low debt levels, which mitigates financial risk substantially. Regulatory and geopolitical risks remain moderate and typical of the semiconductor industry.
Which Stock to Choose?
Qnity Electronics, Inc. shows a stable income with a slightly favorable global income statement and ratio profile. Its profitability is moderate, with low debt levels and a strong current ratio. The company’s rating is very favorable at B+ but its ROIC indicates neutral moat with no clear competitive advantage.
Onto Innovation Inc. presents robust income growth and consistently favorable income statements. Despite a higher debt coverage and more volatile ratios, it maintains strong profitability and a slightly unfavorable moat due to value destruction, yet with improving ROIC. The company also holds a very favorable B+ rating.
Investors focused on stability and moderate risk might find Qnity Electronics’ consistent financials and low debt appealing, while those with a growth-oriented profile could see Onto Innovation’s accelerating income and improving profitability as a positive signal, despite its higher risk profile.
Disclaimer: Investment carries a risk of loss of initial capital. The past performance is not a reliable indicator of future results. Be sure to understand risks before making an investment decision.
Go Further
I encourage you to read the complete analyses of Qnity Electronics, Inc. and Onto Innovation Inc. to enhance your investment decisions: