In the fast-evolving semiconductor industry, Onto Innovation Inc. and Nova Ltd. stand out as key players specializing in process control technologies. Both companies develop advanced metrology and inspection solutions critical for chip manufacturing, targeting overlapping markets and driving innovation in wafer and packaging processes. For investors seeking growth in this essential tech sector, this article will analyze which company presents the most compelling investment opportunity today.
Table of contents
Companies Overview
I will begin the comparison between Onto Innovation and Nova by providing an overview of these two companies and their main differences.
Onto Innovation Overview
Onto Innovation Inc. specializes in the design, development, and manufacture of process control tools for the semiconductor industry. Its product range includes macro defect inspection, 2D/3D optical metrology, lithography systems, and analytical software. The company supports semiconductor and advanced packaging manufacturers globally, offering solutions for process and yield management as well as device packaging and testing.
Nova Overview
Nova Ltd. develops and sells process control systems for semiconductor manufacturing, focusing on metrology platforms for dimensional, film, and chemical measurements. Its products serve multiple manufacturing stages such as lithography, etch, and advanced packaging. Headquartered in Israel, Nova caters to integrated circuit sectors including logic, foundries, memory manufacturers, and process equipment makers worldwide.
Key similarities and differences
Both Onto Innovation and Nova operate in the semiconductor process control industry, providing critical metrology and inspection solutions. Onto Innovation emphasizes defect inspection and lithography with integrated software, while Nova concentrates on dimensional and chemical metrology across various production steps. Their geographic presence differs, with Onto based in the US and Nova in Israel, reflecting distinct market footprints and operational strategies.
Income Statement Comparison
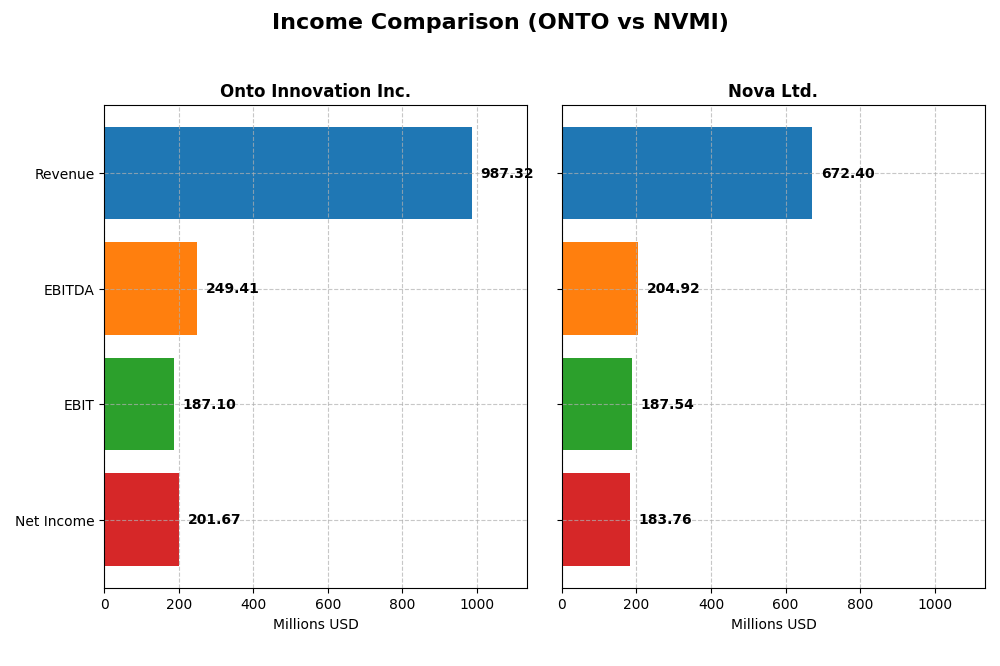
Below is a side-by-side comparison of the most recent fiscal year income statement metrics for Onto Innovation Inc. and Nova Ltd., providing a snapshot of their financial performance in 2024.
| Metric | Onto Innovation Inc. | Nova Ltd. |
|---|---|---|
| Market Cap | 8.13B | 10.25B |
| Revenue | 987M | 672M |
| EBITDA | 249M | 205M |
| EBIT | 187M | 188M |
| Net Income | 202M | 185M |
| EPS | 4.09 | 6.31 |
| Fiscal Year | 2024 | 2024 |
Income Statement Interpretations
Onto Innovation Inc.
Onto Innovation’s revenue increased from 556M in 2020 to 987M in 2024, showing a 77% growth over five years. Net income rose sharply to 202M in 2024 from 31M in 2020, with net margin expanding to 20.4%. The 2024 year saw favorable growth in revenue (+21%) and net income (+37.5%), alongside improved EBIT margin at 19%, reflecting operational efficiency gains.
Nova Ltd.
Nova Ltd. exhibited strong revenue growth from 269M in 2020 to 672M in 2024, a 150% increase overall. Net income rose to 185M in 2024 from 48M in 2020, with a net margin of 27.3%. The latest year showed a robust 30% revenue growth and 20% EBIT increase, though net margin growth was neutral at 3.8%, indicating some margin pressure despite solid top-line expansion.
Which one has the stronger fundamentals?
Both companies demonstrate favorable income statement trends with strong revenue and net income growth. Onto Innovation shows exceptional net margin improvement and high net income growth rates, while Nova Ltd. maintains higher gross and EBIT margins with larger revenue growth. Nova’s slight net margin stagnation contrasts with Onto’s margin expansion, suggesting nuanced strengths in each firm’s fundamentals.
Financial Ratios Comparison
Below is a comparison of key financial ratios for Onto Innovation Inc. and Nova Ltd. based on their most recent fiscal year data from 2024.
| Ratios | Onto Innovation Inc. (ONTO) | Nova Ltd. (NVMI) |
|---|---|---|
| ROE | 10.5% | 19.8% |
| ROIC | 8.8% | 13.4% |
| P/E | 41.8 | 31.2 |
| P/B | 4.37 | 6.18 |
| Current Ratio | 8.69 | 2.32 |
| Quick Ratio | 7.00 | 1.92 |
| D/E | 0.008 | 0.25 |
| Debt-to-Assets | 0.7% | 17.0% |
| Interest Coverage | 0 (not reported) | 116.2 |
| Asset Turnover | 0.47 | 0.48 |
| Fixed Asset Turnover | 7.16 | 5.06 |
| Payout ratio | 0% | 0% |
| Dividend yield | 0% | 0% |
Interpretation of the Ratios
Onto Innovation Inc.
Onto Innovation shows a mixed ratio profile with strengths in debt management, interest coverage, and liquidity, highlighted by a very high current ratio of 8.69 and a debt-to-equity of 0.01. However, valuation metrics such as PE at 41.76 and PB at 4.37 are unfavorable, alongside a weak asset turnover of 0.47. The company does not pay dividends, reflecting a possible reinvestment strategy or focus on growth.
Nova Ltd.
Nova Ltd. demonstrates generally strong financial ratios, including favorable net margin at 27.33%, ROE at 19.81%, and ROIC at 13.39%. Liquidity ratios like current ratio (2.32) and quick ratio (1.92) are also favorable, though its valuation multiples remain high with a PE of 31.2 and PB at 6.18. Similar to Onto, Nova Ltd. does not distribute dividends, indicating possible reinvestment or growth prioritization.
Which one has the best ratios?
Comparing the two, Nova Ltd. exhibits a more favorable overall ratio profile with higher profitability, better liquidity, and stronger returns on equity and invested capital. Onto Innovation’s strengths lie in its conservative leverage and liquidity, but it faces challenges in valuation and asset utilization. Nova’s ratios suggest a more balanced financial health despite some elevated valuation metrics.
Strategic Positioning
This section compares the strategic positioning of Onto Innovation Inc. and Nova Ltd. based on market position, key segments, and exposure to technological disruption:
Onto Innovation Inc.
- Operates in semiconductors with notable competitive pressure on NYSE.
- Focuses on process control tools, metrology, lithography, and software for semiconductor manufacturing.
- Exposure to disruption through advanced packaging and process control software innovation.
Nova Ltd.
- Larger market cap, listed on NASDAQ, facing strong sector competition.
- Offers metrology platforms for diverse semiconductor process control steps and equipment manufacturers.
- Exposure linked to semiconductor metrology and process control technologies across multiple manufacturing stages.
Onto Innovation Inc. vs Nova Ltd. Positioning
Onto Innovation maintains a diversified product portfolio including systems, software, parts, and services, while Nova concentrates on product sales. Onto’s broad offering supports multiple semiconductor applications, whereas Nova targets integrated circuit production and process equipment sectors.
Which has the best competitive advantage?
Based on MOAT evaluation, Nova Ltd. shows a slightly favorable position with growing profitability, indicating improving competitive advantage. Onto Innovation is slightly unfavorable, currently destroying value despite increasing ROIC.
Stock Comparison
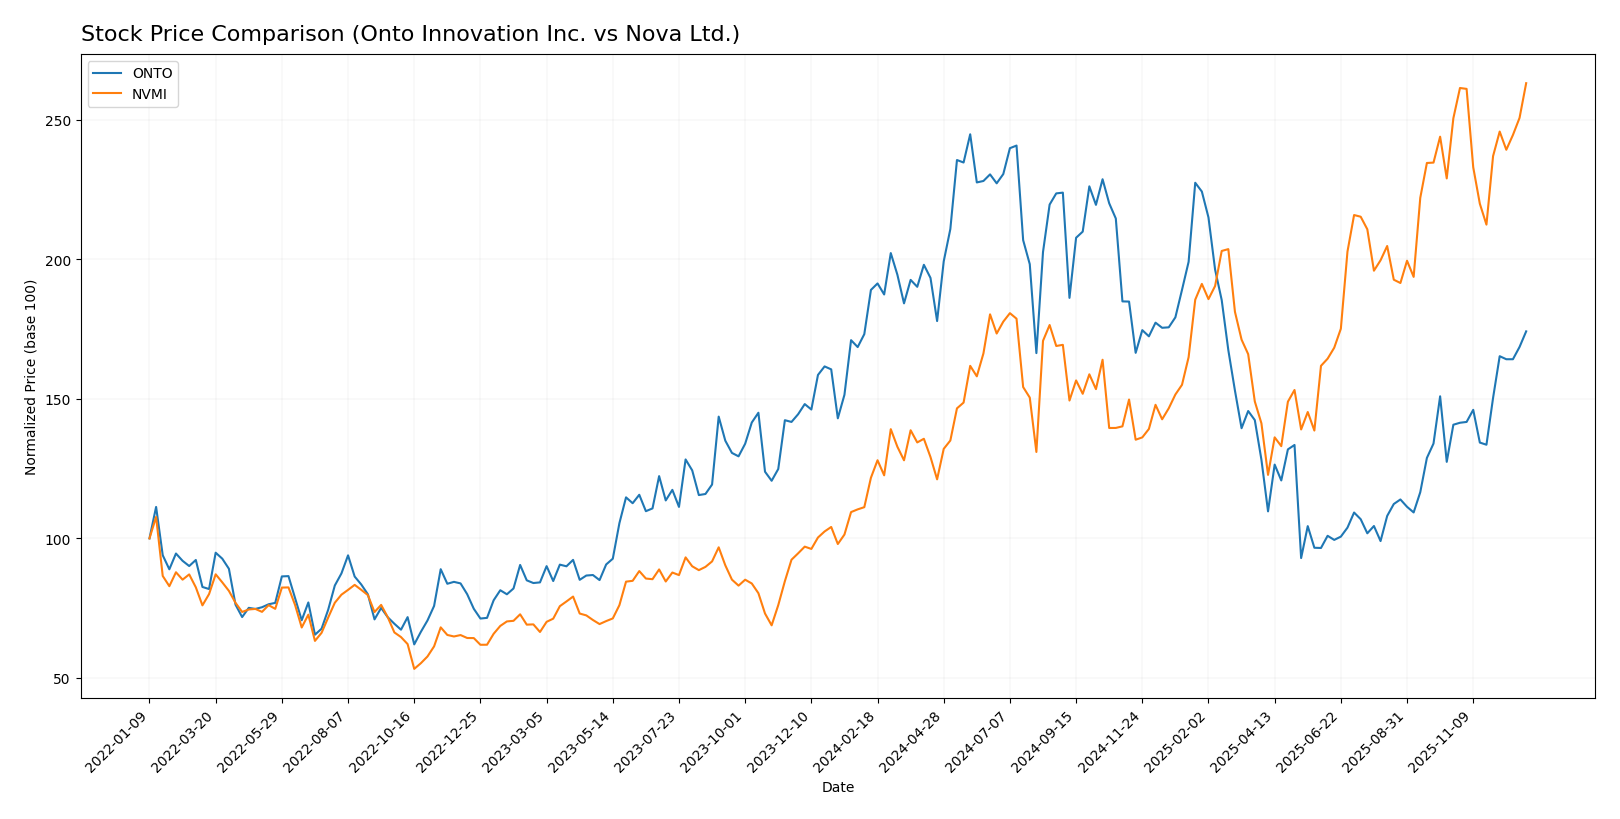
The past year has seen Onto Innovation Inc. experience a bearish trend with accelerating decline, while Nova Ltd. displayed a strong bullish trend with decelerating gains, reflecting distinct trading dynamics and volatility profiles.
Trend Analysis
Onto Innovation Inc.’s stock price dropped by 7.86% over the past 12 months, marking a bearish trend with accelerating decline and high volatility (std dev 42.23). The price fluctuated between 88.5 and 233.14 during this period.
Nova Ltd. showed a 116.2% price increase over the same period, indicating a bullish trend with deceleration and higher volatility (std dev 50.36). Its price ranged from 159.92 to 347.34.
Comparing both, Nova Ltd. delivered the highest market performance with a strong bullish trend, while Onto Innovation faced a significant bearish correction despite recent short-term recovery.
Target Prices
Analysts present a bullish consensus on both Onto Innovation Inc. and Nova Ltd., reflecting positive market sentiment.
| Company | Target High | Target Low | Consensus |
|---|---|---|---|
| Onto Innovation Inc. | 200 | 120 | 166 |
| Nova Ltd. | 390 | 335 | 362.5 |
The target consensus for Onto Innovation Inc. is slightly above the current price of 165.87 USD, suggesting moderate upside potential. Nova Ltd.’s consensus target of 362.5 USD is above its current price of 347.34 USD, indicating expectations of further gains.
Analyst Opinions Comparison
This section compares analysts’ ratings and grades for Onto Innovation Inc. and Nova Ltd.:
Rating Comparison
ONTO Rating
- Rating: B+, considered Very Favorable overall.
- Discounted Cash Flow Score: Moderate at 3, indicating average valuation.
- ROE Score: Moderate at 3, showing average efficiency in generating equity returns.
- ROA Score: Favorable at 4, indicating good asset utilization.
- Debt To Equity Score: Favorable at 4, reflecting stronger balance sheet.
- Overall Score: Moderate at 3, reflecting balanced performance.
NVMI Rating
- Rating: B-, considered Very Favorable overall.
- Discounted Cash Flow Score: Moderate at 3, indicating average valuation.
- ROE Score: Favorable at 4, showing better efficiency in generating equity returns.
- ROA Score: Very Favorable at 5, indicating excellent asset utilization.
- Debt To Equity Score: Very Unfavorable at 1, indicating higher financial risk.
- Overall Score: Moderate at 3, reflecting balanced performance.
Which one is the best rated?
Based strictly on the data, Onto Innovation holds a higher overall rating of B+ versus B- for Nova Ltd. However, Nova shows superior ROE and ROA scores, while Onto has a stronger debt to equity position. Both have equal overall scores.
Scores Comparison
Here is a comparison of the Altman Z-Score and Piotroski Score for Onto Innovation Inc. and Nova Ltd.:
ONTO Scores
- Altman Z-Score of 27.4 indicates a very strong safe zone.
- Piotroski Score of 4 reflects average financial strength.
NVMI Scores
- Altman Z-Score of 6.5 places the company securely in safe zone.
- Piotroski Score of 7 indicates strong financial health.
Which company has the best scores?
Nova Ltd. shows a solid Altman Z-Score within the safe zone and a strong Piotroski Score of 7, while Onto Innovation has a much higher Altman Z-Score but only an average Piotroski Score of 4. Overall, Nova demonstrates stronger combined scores.
Grades Comparison
The following tables summarize the latest grades assigned by reputable grading companies for Onto Innovation Inc. and Nova Ltd.:
Onto Innovation Inc. Grades
This table presents recent grades given by established financial analysts to Onto Innovation Inc.:
| Grading Company | Action | New Grade | Date |
|---|---|---|---|
| Jefferies | Maintain | Buy | 2025-12-15 |
| B. Riley Securities | Maintain | Buy | 2025-11-18 |
| Needham | Maintain | Buy | 2025-11-18 |
| Evercore ISI Group | Maintain | Outperform | 2025-11-05 |
| Oppenheimer | Maintain | Outperform | 2025-10-14 |
| Stifel | Maintain | Hold | 2025-10-13 |
| B. Riley Securities | Maintain | Buy | 2025-10-10 |
| Jefferies | Upgrade | Buy | 2025-09-23 |
| B. Riley Securities | Maintain | Buy | 2025-08-08 |
| Benchmark | Maintain | Buy | 2025-08-08 |
Onto Innovation Inc. shows a strong consensus with mostly “Buy” and “Outperform” grades, reflecting positive analyst sentiment with few neutral positions.
Nova Ltd. Grades
This table shows recent grades from respected grading firms for Nova Ltd.:
| Grading Company | Action | New Grade | Date |
|---|---|---|---|
| Jefferies | Maintain | Buy | 2025-12-15 |
| Evercore ISI Group | Maintain | Outperform | 2025-11-07 |
| Benchmark | Maintain | Buy | 2025-11-07 |
| B of A Securities | Maintain | Buy | 2025-06-24 |
| Cantor Fitzgerald | Maintain | Overweight | 2025-06-24 |
| Benchmark | Maintain | Buy | 2025-05-09 |
| Citigroup | Maintain | Buy | 2025-05-09 |
| B of A Securities | Maintain | Buy | 2025-04-16 |
| Cantor Fitzgerald | Maintain | Overweight | 2025-03-14 |
| Benchmark | Maintain | Buy | 2025-02-14 |
Nova Ltd. consistently receives “Buy,” “Outperform,” and “Overweight” ratings, indicating steady and favorable analyst coverage without downgrades.
Which company has the best grades?
Both Onto Innovation Inc. and Nova Ltd. have predominantly positive grades from reputable analysts, with Nova Ltd. slightly more consistent in holding only “Buy” or better ratings. This pattern may suggest stronger analyst confidence in Nova Ltd., potentially influencing investor sentiment and portfolio decisions.
Strengths and Weaknesses
Below is a comparison table outlining key strengths and weaknesses of Onto Innovation Inc. (ONTO) and Nova Ltd. (NVMI) based on the latest financial and operational data.
| Criterion | Onto Innovation Inc. (ONTO) | Nova Ltd. (NVMI) |
|---|---|---|
| Diversification | High: Revenue spread across Systems & Software (850M), Parts (77M), and Services (60M) | Low: Primarily product-focused with 538M revenue in products only |
| Profitability | Moderate: Net margin 20.43%, ROIC 8.77%, but ROIC < WACC indicating value destruction | Strong: Net margin 27.33%, ROIC 13.39%, ROIC > WACC indicating value creation |
| Innovation | Growing ROIC trend (+344%), indicating improving profitability and potential innovation | Growing ROIC trend (+70%), steady profitability and competitive improvement |
| Global presence | Strong presence with broad product and service offerings supporting global clients | Solid, but less diversified globally due to focus on product segment |
| Market Share | Moderate: Large Systems & Software segment but lower asset turnover (0.47) | Moderate: Similar asset turnover (0.48), but stronger profitability metrics |
Key takeaways: Onto Innovation shows strong diversification and improving profitability but still struggles with value destruction as ROIC remains below WACC. Nova Ltd. demonstrates more efficient capital use and stronger profit margins, reflecting a more favorable investment profile despite less diversification. Investors should weigh Onto’s growth potential against Nova’s current profitability and operational efficiency.
Risk Analysis
Below is a comparative table outlining key risks for Onto Innovation Inc. (ONTO) and Nova Ltd. (NVMI) based on the latest data from 2024.
| Metric | Onto Innovation Inc. (ONTO) | Nova Ltd. (NVMI) |
|---|---|---|
| Market Risk | Beta 1.47 – Moderate volatility | Beta 1.84 – Higher volatility |
| Debt level | Very low debt (D/E 0.01) – Low leverage | Moderate debt (D/E 0.25) – Manageable leverage |
| Regulatory Risk | US-based, subject to US tech regulations | Israel-based, exposed to international tech regulations |
| Operational Risk | Stable with diversified semiconductor tools | Dependent on semiconductor manufacturing cycles |
| Environmental Risk | Moderate, semiconductor manufacturing impact | Moderate, semiconductor industry environmental scrutiny |
| Geopolitical Risk | Lower, US market focused | Higher, exposure to geopolitical tensions in Middle East and Asia |
The most likely and impactful risks are market volatility for both companies, with Nova Ltd. showing higher beta and geopolitical risk due to its Israel base. Onto Innovation’s extremely low debt reduces financial risk, while Nova’s higher debt requires monitoring. Both face typical semiconductor industry operational and environmental risks.
Which Stock to Choose?
Onto Innovation Inc. (ONTO) shows strong income growth with a 77% revenue increase over five years and a 20.43% net margin in 2024. Its financial ratios are balanced, with favorable debt levels and solid profitability, though some valuation and liquidity ratios appear unfavorable. Its rating is very favorable (B+), supported by a moderate overall score and a safe Altman Z-Score.
Nova Ltd. (NVMI) exhibits robust income growth, nearly 150% revenue rise over five years, with a higher 27.33% net margin. Financial ratios are mostly favorable, especially profitability and liquidity, despite higher debt and some valuation concerns. Its rating is very favorable (B-), with strong Piotroski and Altman Z-Scores indicating financial strength.
Investors favoring growth and profitability might see Nova Ltd. as attractive due to its superior income expansion and stronger financial ratios. Conversely, those prioritizing financial stability and moderate valuation metrics could find Onto Innovation’s profile more aligned with a cautious approach.
Disclaimer: Investment carries a risk of loss of initial capital. The past performance is not a reliable indicator of future results. Be sure to understand risks before making an investment decision.
Go Further
I encourage you to read the complete analyses of Onto Innovation Inc. and Nova Ltd. to enhance your investment decisions: