In the dynamic energy sector, The Williams Companies, Inc. (WMB) and ONEOK, Inc. (OKE) stand out as key players in oil and gas midstream operations. Both headquartered in Tulsa, Oklahoma, they manage extensive pipeline and processing infrastructure, serving overlapping markets with distinct innovation strategies. This comparison will explore their strengths and risks to help you decide which company holds the most promise for your investment portfolio.
Table of contents
Companies Overview
I will begin the comparison between The Williams Companies, Inc. and ONEOK, Inc. by providing an overview of these two companies and their main differences.
The Williams Companies, Inc. Overview
The Williams Companies, Inc. is an energy infrastructure company operating primarily in the United States. It focuses on natural gas transmission, gathering, processing, and marketing, with assets including 30,000 miles of pipelines, 29 processing facilities, and 7 fractionation facilities. Founded in 1908 and headquartered in Tulsa, Oklahoma, Williams serves various segments such as the Gulf of Mexico, Northeast, and West regions.
ONEOK, Inc. Overview
ONEOK, Inc. engages in gathering, processing, storage, and transportation of natural gas and natural gas liquids (NGL) across the United States. The company operates 17,500 miles of gathering pipelines and multiple storage and terminal facilities primarily in the Mid-Continent and Rocky Mountain regions. Founded in 1906 and also based in Tulsa, Oklahoma, ONEOK serves a broad range of energy sector customers including producers and distributors.
Key similarities and differences
Both companies operate in the Oil & Gas Midstream industry with extensive pipeline and processing infrastructure. Williams has a broader geographic footprint including the Gulf of Mexico and Northeast, while ONEOK emphasizes the Mid-Continent and Rocky Mountain regions. Williams operates more processing and fractionation facilities, whereas ONEOK maintains a larger network of gathering pipelines and NGL terminals. Both are headquartered in Tulsa, Oklahoma, and serve diverse energy market participants.
Income Statement Comparison
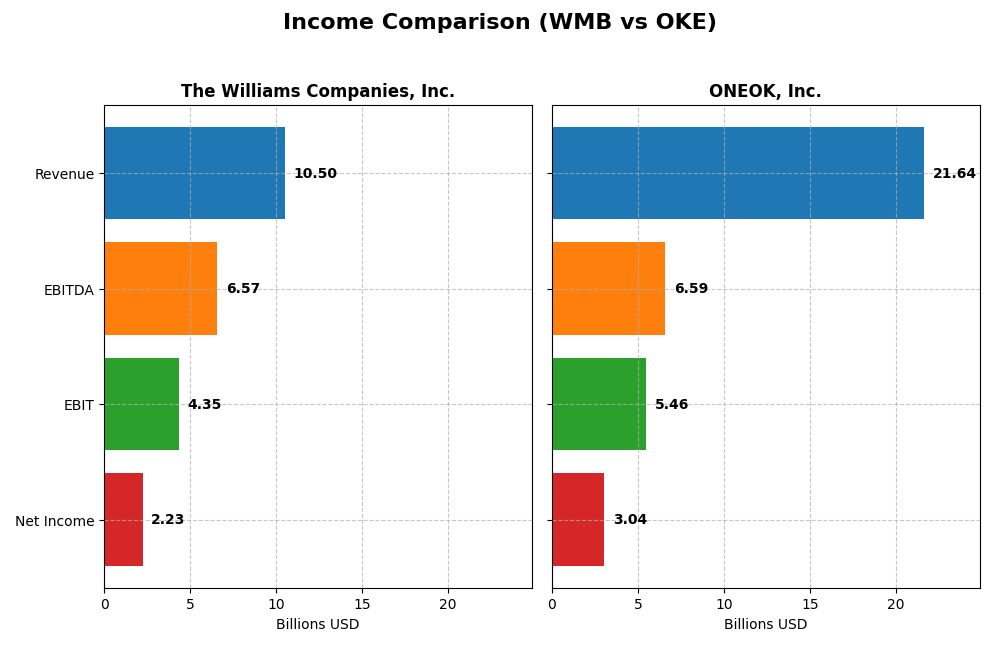
This table compares key income statement metrics for The Williams Companies, Inc. (WMB) and ONEOK, Inc. (OKE) for the fiscal year 2024, providing a snapshot of their financial performance.
| Metric | The Williams Companies, Inc. (WMB) | ONEOK, Inc. (OKE) |
|---|---|---|
| Market Cap | 73.7B | 45.8B |
| Revenue | 10.5B | 21.6B |
| EBITDA | 6.57B | 6.60B |
| EBIT | 4.35B | 5.46B |
| Net Income | 2.23B | 3.04B |
| EPS | 1.82 | 5.19 |
| Fiscal Year | 2024 | 2024 |
Income Statement Interpretations
The Williams Companies, Inc.
The Williams Companies showed positive overall growth in revenue and net income from 2020 to 2024, with revenue increasing by 36% and net income surging 954%. Gross and net margins remained favorable, around 59% and 21%, respectively. However, 2024 saw a decline in revenue by 3.7% and a 27% drop in net margin, indicating a slowdown in profitability despite strong long-term trends.
ONEOK, Inc.
ONEOK experienced robust revenue growth of 156% and a 395% increase in net income over the 2020-2024 period. Gross and EBIT margins stayed favorable at about 23% and 25%, while net margin was 14%. The latest year showed 22% revenue growth and 26% EBIT growth but a slight dip in net margin by 6.75%, reflecting mixed signals in recent profitability.
Which one has the stronger fundamentals?
ONEOK’s income statement reveals a more favorable overall trend, with stronger revenue and EBIT growth and better margin stability, despite a slight recent net margin dip. The Williams Companies demonstrate solid long-term growth but faced notable declines in 2024. Overall, ONEOK’s fundamentals appear more consistently favorable based on income statement metrics.
Financial Ratios Comparison
The table below presents a side-by-side comparison of key financial ratios for The Williams Companies, Inc. (WMB) and ONEOK, Inc. (OKE) based on their most recent fiscal year data for 2024.
| Ratios | The Williams Companies, Inc. (WMB) | ONEOK, Inc. (OKE) |
|---|---|---|
| ROE | 17.9% | 17.8% |
| ROIC | 5.1% | 6.3% |
| P/E | 29.7 | 19.4 |
| P/B | 5.31 | 3.46 |
| Current Ratio | 0.50 | 0.90 |
| Quick Ratio | 0.45 | 0.74 |
| D/E (Debt-to-Equity) | 2.18 | 1.90 |
| Debt-to-Assets | 49.7% | 50.4% |
| Interest Coverage | 2.45 | 3.72 |
| Asset Turnover | 0.19 | 0.34 |
| Fixed Asset Turnover | 0.27 | 0.47 |
| Payout Ratio | 104% | 76% |
| Dividend Yield | 3.51% | 3.93% |
Interpretation of the Ratios
The Williams Companies, Inc.
Williams shows strong profitability with a favorable net margin of 21.18% and return on equity at 17.89%. However, concerns arise from its low liquidity ratios (current ratio 0.5, quick ratio 0.45) and high leverage (debt-to-equity 2.18). Dividend yield is favorable at 3.51%, supported by steady payouts, though high payout risks remain due to negative free cash flow to equity.
ONEOK, Inc.
ONEOK exhibits favorable net margin (14.03%) and ROE (17.82%), with a slightly better return on invested capital than Williams. Liquidity remains below 1 (current ratio 0.9), and debt levels are elevated (debt-to-assets 50.4%). The dividend yield is attractive at 3.93%, with consistent dividends, but the company also contends with negative free cash flow to equity, suggesting caution on distribution sustainability.
Which one has the best ratios?
Both Williams and ONEOK have a similar share of favorable and unfavorable ratios, leading to a slightly unfavorable overall assessment. Williams excels in net margin and ROE but struggles with liquidity and leverage. ONEOK offers a more balanced return on invested capital and dividend yield but faces similar financial structure challenges. Neither company distinctly outperforms in ratio strength.
Strategic Positioning
This section compares the strategic positioning of The Williams Companies, Inc. (WMB) and ONEOK, Inc. (OKE), focusing on market position, key segments, and exposure to technological disruption:
The Williams Companies, Inc.
- Operates 30,000 miles of pipelines with diversified regional assets and moderate competitive pressure.
- Revenue driven by multiple segments: Transmission & Gulf of Mexico, Northeast G&P, West, and Gas & NGL Marketing Services.
- Exposure to technological disruption is implicit in midstream infrastructure, with no explicit innovation-driven disruption noted.
ONEOK, Inc.
- Operates 24,100 miles of pipelines focused mainly in Mid-Continent and Rocky Mountain regions.
- Revenue mainly from Natural Gas Liquids, Gathering & Processing, Refined Products, and Natural Gas Pipelines.
- Similar midstream infrastructure exposure, with no explicit details on technological disruption risks or innovations.
WMB vs OKE Positioning
WMB shows a more diversified regional and segment presence compared to OKE’s concentration in NGL and specific regions. WMB’s broad footprint provides multiple revenue streams, while OKE has stronger focus but less geographic diversity, influencing risk and growth profiles.
Which has the best competitive advantage?
Both companies have slightly unfavorable MOATs; WMB shows improving profitability despite value destruction, whereas OKE is shedding value with declining profitability, indicating neither currently holds a strong competitive advantage.
Stock Comparison
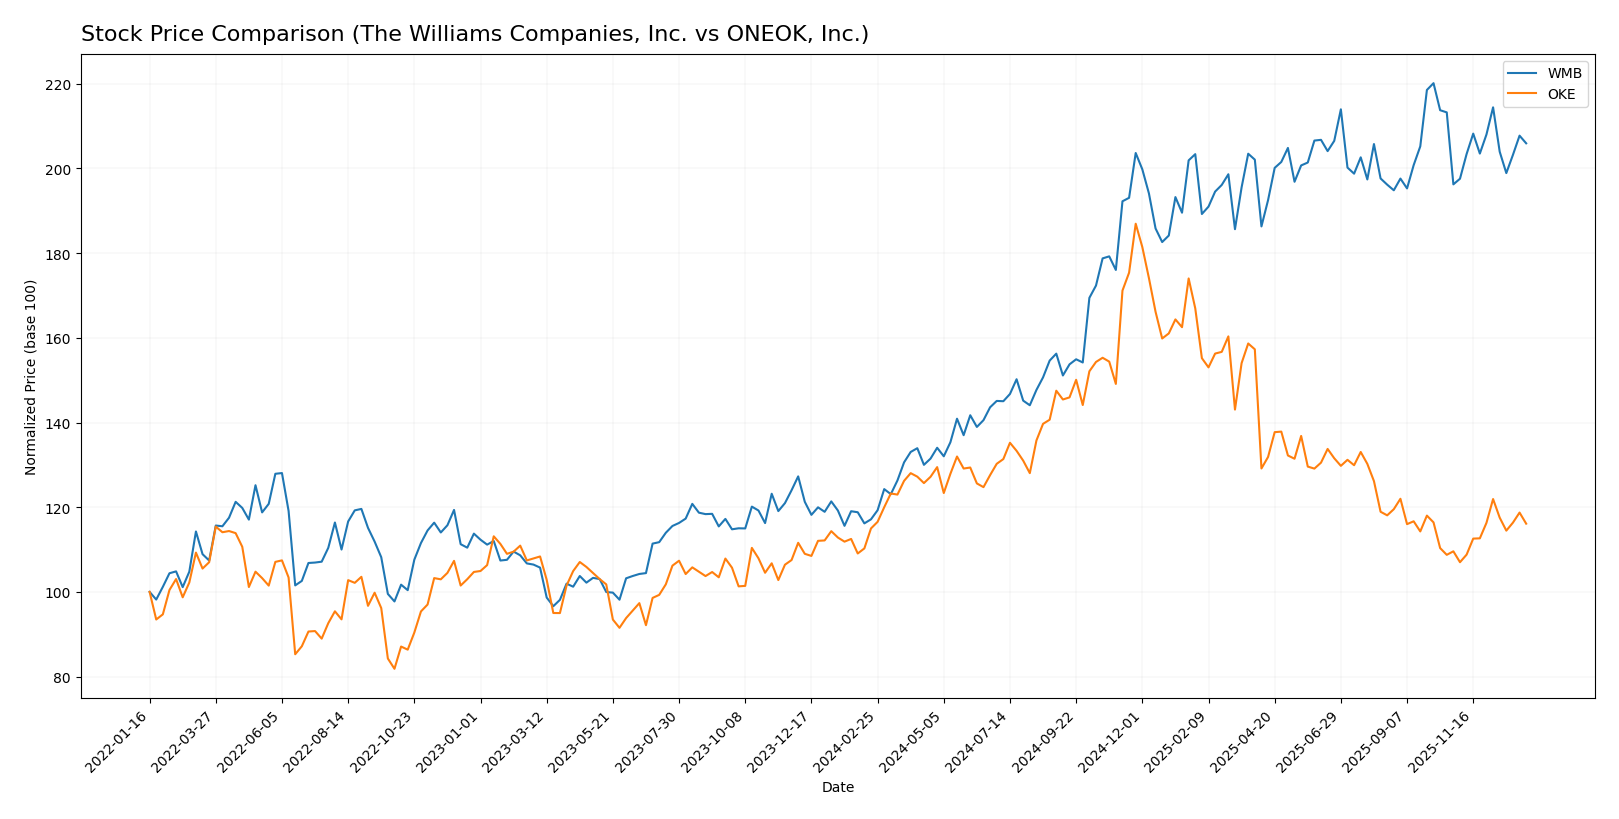
The stock price movements of The Williams Companies, Inc. (WMB) and ONEOK, Inc. (OKE) over the past 12 months reveal contrasting dynamics, with WMB showing strong gains amid decelerating momentum, while OKE exhibits moderate growth with accelerating trend strength.
Trend Analysis
The Williams Companies, Inc. (WMB) posted a 75.81% price increase over the past year, indicating a bullish trend with decelerating momentum. The stock ranged between a low of 34.31 and a high of 64.48, showing significant appreciation despite a standard deviation of 8.61.
ONEOK, Inc. (OKE) recorded a 0.99% price increase over the same period, signaling a neutral trend with accelerating momentum. Its price fluctuated between 67.0 and 117.05, with higher volatility reflected in an 11.52 standard deviation.
Comparing both, WMB delivered the highest market performance with a markedly stronger price appreciation than OKE, despite OKE’s accelerating trend and greater volatility.
Target Prices
Analysts show a positive outlook with clear consensus target prices for both companies.
| Company | Target High | Target Low | Consensus |
|---|---|---|---|
| The Williams Companies, Inc. | 83 | 66 | 72.86 |
| ONEOK, Inc. | 110 | 72 | 86.5 |
The consensus targets for The Williams Companies and ONEOK are notably above their current prices of $60.32 and $72.7, indicating analyst expectations of moderate to strong upside potential.
Analyst Opinions Comparison
This section compares analysts’ ratings and grades for The Williams Companies, Inc. (WMB) and ONEOK, Inc. (OKE):
Rating Comparison
WMB Rating
- Rating: B, categorized as Very Favorable.
- Discounted Cash Flow Score: 5, indicating a very favorable valuation.
- ROE Score: 5, reflecting very efficient profit generation from equity.
- ROA Score: 4, showing favorable asset utilization effectiveness.
- Debt To Equity Score: 1, signaling very unfavorable financial risk level.
- Overall Score: 3, representing a moderate overall financial standing.
OKE Rating
- Rating: B+, categorized as Very Favorable.
- Discounted Cash Flow Score: 5, indicating a very favorable valuation.
- ROE Score: 5, reflecting very efficient profit generation from equity.
- ROA Score: 4, showing favorable asset utilization effectiveness.
- Debt To Equity Score: 1, signaling very unfavorable financial risk level.
- Overall Score: 3, representing a moderate overall financial standing.
Which one is the best rated?
OKE holds a slightly higher rating of B+ compared to WMB’s B, while both share identical scores on overall financial standing, DCF, ROE, ROA, and debt levels. OKE’s rating advantage reflects a marginally better analyst assessment.
Scores Comparison
Here is a comparison of the Altman Z-Score and Piotroski Score for both companies:
WMB Scores
- Altman Z-Score: 1.18, indicating financial distress zone risk of bankruptcy.
- Piotroski Score: 6, representing an average financial strength rating.
OKE Scores
- Altman Z-Score: 1.42, also in the financial distress zone signaling risk.
- Piotroski Score: 6, also indicating average financial strength.
Which company has the best scores?
Both WMB and OKE have Altman Z-Scores in the distress zone, suggesting financial vulnerability. Their Piotroski Scores are equal at 6, reflecting average financial health. Neither company shows a clear advantage based on these scores alone.
Grades Comparison
Here is a comparison of the latest reliable grades assigned to The Williams Companies, Inc. and ONEOK, Inc.:
The Williams Companies, Inc. Grades
This table summarizes recent grades from recognized financial institutions for The Williams Companies, Inc.:
| Grading Company | Action | New Grade | Date |
|---|---|---|---|
| Jefferies | Maintain | Buy | 2026-01-09 |
| Citigroup | Maintain | Buy | 2025-11-13 |
| TD Cowen | Maintain | Buy | 2025-11-06 |
| Jefferies | Maintain | Buy | 2025-11-05 |
| BMO Capital | Maintain | Outperform | 2025-11-05 |
| Barclays | Maintain | Equal Weight | 2025-10-14 |
| Morgan Stanley | Maintain | Overweight | 2025-10-02 |
| Goldman Sachs | Maintain | Neutral | 2025-10-02 |
| UBS | Maintain | Buy | 2025-09-30 |
| Barclays | Maintain | Equal Weight | 2025-09-30 |
Overall, grades for The Williams Companies, Inc. predominantly indicate positive outlooks with multiple Buy and Outperform ratings, while some institutions recommend Neutral or Equal Weight.
ONEOK, Inc. Grades
This table presents recent grades from established grading companies for ONEOK, Inc.:
| Grading Company | Action | New Grade | Date |
|---|---|---|---|
| Scotiabank | Maintain | Sector Outperform | 2025-11-04 |
| Citigroup | Maintain | Buy | 2025-10-31 |
| Wells Fargo | Maintain | Equal Weight | 2025-10-30 |
| TD Cowen | Maintain | Hold | 2025-10-30 |
| Raymond James | Maintain | Outperform | 2025-10-24 |
| Barclays | Maintain | Equal Weight | 2025-10-09 |
| Mizuho | Maintain | Neutral | 2025-08-29 |
| Morgan Stanley | Maintain | Overweight | 2025-08-26 |
| RBC Capital | Maintain | Sector Perform | 2025-08-13 |
| RBC Capital | Maintain | Sector Perform | 2025-08-01 |
ONEOK, Inc.’s ratings show a balanced view with a mix of Buy/Outperform and Hold/Neutral grades, indicating moderate confidence from analysts.
Which company has the best grades?
The Williams Companies, Inc. holds a stronger consensus with 24 Buy ratings and an overall Buy consensus, compared to ONEOK, Inc.’s 19 Buy and 20 Hold ratings resulting in a Hold consensus. This suggests Williams enjoys higher analyst conviction, potentially impacting investor confidence and portfolio decisions.
Strengths and Weaknesses
Below is a comparison of key strengths and weaknesses of The Williams Companies, Inc. (WMB) and ONEOK, Inc. (OKE) based on recent financial and operational data.
| Criterion | The Williams Companies, Inc. (WMB) | ONEOK, Inc. (OKE) |
|---|---|---|
| Diversification | Moderate, with revenues from Gas & NGL Marketing, Northeast G&P, Transmission and Gulf, West segments | High concentration in Natural Gas Liquids, with additional revenues from Gathering, Processing, Pipelines, and Refined Products |
| Profitability | Favorable net margin (21.18%) and ROE (17.89%); ROIC slightly below WACC, indicating slight value destruction but improving | Favorable net margin (14.03%) and ROE (17.82%); ROIC above WACC but declining, signaling decreasing profitability |
| Innovation | Limited data on innovation; industry typically capital intensive with focus on operational efficiency | Similar industry constraints; focus on asset optimization rather than breakthrough innovation |
| Global presence | Primarily North American operations, focused on U.S. markets | Primarily U.S.-based, strong presence in natural gas liquids market |
| Market Share | Significant presence in gas marketing and pipeline segments with steady revenue growth in key areas | Leading in natural gas liquids gathering and processing, with strong market share in midstream services |
Key takeaway: Both companies operate predominantly in the U.S. midstream energy sector with slightly unfavorable value creation metrics. WMB shows improving profitability trends despite value shedding, while OKE faces declining profitability but maintains strong market leadership in natural gas liquids. Investors should weigh operational strengths against financial risks in their portfolios.
Risk Analysis
Below is a comparative table summarizing the key risk factors for The Williams Companies, Inc. (WMB) and ONEOK, Inc. (OKE) based on the most recent data from 2024.
| Metric | The Williams Companies, Inc. (WMB) | ONEOK, Inc. (OKE) |
|---|---|---|
| Market Risk | Moderate beta (0.658) indicates lower volatility | Higher beta (0.92) suggests more sensitivity to market swings |
| Debt level | High debt-to-equity (2.18), debt-to-assets 49.66% (neutral) | High debt-to-equity (1.9), debt-to-assets 50.4% (unfavorable) |
| Regulatory Risk | Exposure to US energy regulations, pipeline operations | Similar regulatory exposure, with interstate and intrastate pipelines |
| Operational Risk | Large pipeline network (30,000 miles) with processing facilities | Extensive pipeline and storage assets, potential operational disruptions |
| Environmental Risk | Midstream oil & gas infrastructure, risk of spills and emissions | Similar environmental footprint, risks from NGL handling and transportation |
| Geopolitical Risk | Primarily US-focused, limited international exposure | US-focused, but regional geopolitical tensions could affect operations |
In synthesis, both companies face significant debt-related risks and operational challenges inherent to the midstream oil and gas sector. WMB has a lower market volatility but shows signs of financial distress with an Altman Z-Score in the distress zone. OKE also resides in the distress zone financially but carries slightly higher market risk. Regulatory and environmental risks remain impactful for both due to their infrastructure-heavy operations. Investors should weigh these risks carefully, considering the sector’s sensitivity to economic cycles and regulatory changes.
Which Stock to Choose?
The Williams Companies, Inc. (WMB) shows a mixed income evolution with favorable long-term growth but recent declines in revenue and profitability. Its financial ratios indicate strong net margin and ROE but weak liquidity and high valuation multiples. WMB carries moderate debt with a very favorable rating overall.
ONEOK, Inc. (OKE) displays solid income growth with recent revenue increases and strong profitability metrics. Its financial ratios reflect favorable net margin and ROE, though liquidity and debt ratios remain unfavorable. OKE also holds a very favorable rating but with slightly better valuation metrics than WMB.
For investors, WMB’s improving profitability and strong ROE might appeal to those prioritizing quality and value creation despite short-term challenges. Conversely, OKE’s steady income growth and favorable earnings could be more attractive for growth-oriented investors willing to accept moderate financial risks. Both stocks present slightly unfavorable financial ratios, suggesting cautious evaluation aligned with individual risk tolerance.
Disclaimer: Investment carries a risk of loss of initial capital. The past performance is not a reliable indicator of future results. Be sure to understand risks before making an investment decision.
Go Further
I encourage you to read the complete analyses of The Williams Companies, Inc. and ONEOK, Inc. to enhance your investment decisions: