In the complex world of energy midstream, ONEOK, Inc. (OKE) and Targa Resources Corp. (TRGP) stand out as key players shaping the natural gas and liquids transportation landscape. Both companies operate extensive pipeline networks and processing facilities, competing in overlapping markets with distinct approaches to innovation and asset management. This article will analyze their strengths and risks to help you decide which company offers the most compelling investment opportunity in 2026.

Table of contents
Companies Overview
I will begin the comparison between ONEOK and Targa Resources by providing an overview of these two companies and their main differences.
ONEOK Overview
ONEOK, Inc. focuses on gathering, processing, storage, and transportation of natural gas in the US. It operates extensive natural gas pipelines and NGL facilities across multiple states, serving various energy market participants. Founded in 1906 and headquartered in Tulsa, Oklahoma, ONEOK is a well-established player in the oil and gas midstream sector with a market cap of approximately 45.8B USD.
Targa Resources Overview
Targa Resources Corp. owns and operates midstream energy assets in North America, specializing in gathering, processing, and transporting natural gas, NGLs, and crude oil. The company also provides logistics, storage, and marketing services, mainly focused on the Gulf Coast region. Incorporated in 2005 and based in Houston, Texas, Targa has a market cap near 38.0B USD and operates a vast pipeline network and storage facilities.
Key similarities and differences
Both companies operate in the oil and gas midstream industry, offering natural gas gathering, processing, and transportation services, as well as handling natural gas liquids. ONEOK has a longer history and a broader geographical footprint across central US states, while Targa Resources emphasizes Gulf Coast operations with a diversified portfolio including crude oil logistics. Targa also focuses more on marketing and wholesale services compared to ONEOK’s stronger pipeline infrastructure presence.
Income Statement Comparison
The following table presents a side-by-side comparison of key income statement metrics for ONEOK, Inc. and Targa Resources Corp. for the fiscal year 2024.

| Metric | ONEOK, Inc. (OKE) | Targa Resources Corp. (TRGP) |
|---|---|---|
| Market Cap | 45.8B | 38.0B |
| Revenue | 21.6B | 16.6B |
| EBITDA | 6.6B | 4.1B |
| EBIT | 5.5B | 2.7B |
| Net Income | 3.0B | 1.3B |
| EPS | 5.19 | 5.77 |
| Fiscal Year | 2024 | 2024 |
Income Statement Interpretations
ONEOK, Inc.
ONEOK’s revenue increased significantly from 2020 to 2024, growing 156% overall, with net income rising nearly 395% over the same period. Margins remained generally favorable, with a 23.34% gross margin and a 14.03% net margin in 2024. The latest year showed strong revenue growth of 22.41%, though gross profit and net margin declined slightly, indicating some margin pressure despite higher top-line gains.
Targa Resources Corp.
Targa Resources experienced steady revenue growth of 101% from 2020 to 2024, with net income increasing by 182%. Its 2024 gross margin stood at 20%, considered neutral, while the net margin was a favorable 7.64%. The most recent year saw moderate revenue growth of 6.45%, accompanied by a significant 44% rise in net margin and a 57% boost in EPS, reflecting improved profitability and operational efficiency.
Which one has the stronger fundamentals?
Both companies present favorable overall income statement evaluations, each with 71% favorable metrics. ONEOK leads with higher margins, stronger revenue growth, and a more substantial net income increase over the period. Conversely, Targa Resources shows more marked recent improvements in net margin and EPS growth but operates with lower margins. The choice depends on preference for margin strength versus recent profitability momentum.
Financial Ratios Comparison
The table below presents a side-by-side comparison of key financial ratios for ONEOK, Inc. (OKE) and Targa Resources Corp. (TRGP) based on their most recent fiscal year 2024 data.
| Ratios | ONEOK, Inc. (OKE) | Targa Resources Corp. (TRGP) |
|---|---|---|
| ROE | 17.8% | 48.97% |
| ROIC | 6.29% | 11.83% |
| P/E | 19.4 | 30.96 |
| P/B | 3.46 | 15.16 |
| Current Ratio | 0.90 | 0.72 |
| Quick Ratio | 0.74 | 0.62 |
| D/E (Debt to Equity) | 1.90 | 5.50 |
| Debt-to-Assets | 50.4% | 62.7% |
| Interest Coverage | 3.72 | 3.84 |
| Asset Turnover | 0.34 | 0.73 |
| Fixed Asset Turnover | 0.47 | 0.92 |
| Payout ratio | 76.2% | 48.5% |
| Dividend yield | 3.93% | 1.57% |
Interpretation of the Ratios
ONEOK, Inc.
ONEOK shows a mixed ratio profile with favorable net margin (14.03%) and ROE (17.82%), but weaker liquidity indicated by a current ratio of 0.9 and high debt levels (debt-to-assets 50.4%). Asset turnover is low, reflecting efficiency challenges. The dividend yield is attractive at 3.93%, supported by stable payouts, though payout sustainability should be monitored given some financial constraints.
Targa Resources Corp.
Targa Resources exhibits strong returns with ROE at 48.97% and ROIC at 11.83%, but struggles with liquidity (current ratio 0.72) and high leverage (debt-to-assets 62.75%). Valuation multiples are elevated, with a high P/E of 30.96 and P/B of 15.16. Dividend yield is modest at 1.57%, reflecting a cautious distribution approach amid growth investments and debt servicing.
Which one has the best ratios?
Both companies face notable liquidity and leverage challenges, reflected in unfavorable current ratios and high debt levels. ONEOK’s ratios indicate somewhat better profitability and dividend yield, while Targa Resources delivers superior ROE and ROIC but with higher financial risk and valuation multiples. Overall, each firm shows strengths and weaknesses, leading to a similarly cautious outlook on their financial ratios.
Strategic Positioning
This section compares the strategic positioning of ONEOK, Inc. and Targa Resources Corp., including market position, key segments, and exposure to technological disruption:
ONEOK, Inc.
- Large US midstream player with $45.8B market cap, facing moderate competitive pressure.
- Diversified segments: natural gas liquids, gathering & processing, pipelines, refined products.
- Operates extensive pipeline and storage assets, no explicit mention of technology disruption.
Targa Resources Corp.
- Mid-sized US midstream firm with $38B market cap, also in a competitive energy sector.
- Focus on gathering & processing, plus logistics & transportation segments.
- Owns broad pipeline network and processing plants, no explicit technological disruption noted.
ONEOK vs Targa Resources Positioning
ONEOK pursues a diversified business model across multiple midstream segments, offering varied revenue sources but potentially higher complexity. Targa concentrates on gathering, processing, and logistics, allowing focused operations but less diversification.
Which has the best competitive advantage?
Targa shows a very favorable moat with growing ROIC above WACC, indicating durable competitive advantage and efficient capital use. ONEOK’s slightly unfavorable moat and declining ROIC suggest challenges in sustaining value creation.
Stock Comparison
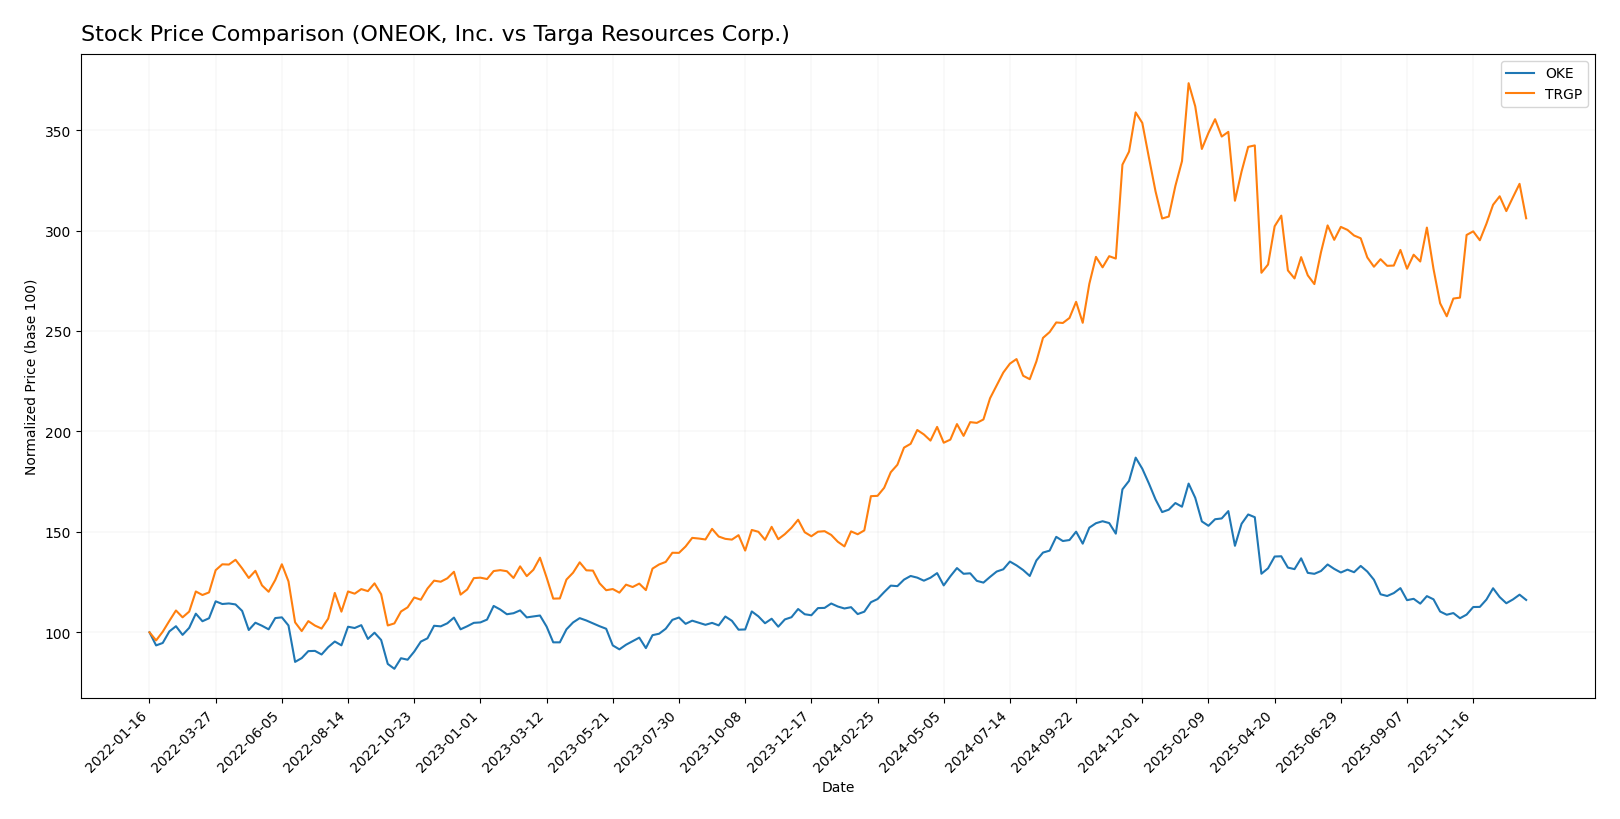
The stock price movements of ONEOK, Inc. (OKE) and Targa Resources Corp. (TRGP) over the past 12 months reveal distinct bullish trends with acceleration, highlighting strong investor interest and notable price appreciations.
Trend Analysis
The stock trend of ONEOK, Inc. (OKE) shows a mild bullish increase of 0.99% over the past year with acceleration and a volatility measure of 11.52. The price ranged between 67.0 and 117.05, indicating a steady upward momentum.
Targa Resources Corp. (TRGP) experienced a pronounced bullish trend with an 82.44% price increase over the same period, accelerating further with higher volatility at 29.4 and a price range between 96.94 and 215.72, reflecting significant market gains.
Comparing both stocks, TRGP delivered the highest market performance over the past year, outperforming OKE substantially in percentage gains and showing stronger upward momentum.
Target Prices
Analysts present a clear consensus on target prices for ONEOK, Inc. and Targa Resources Corp.
| Company | Target High | Target Low | Consensus |
|---|---|---|---|
| ONEOK, Inc. | 110 | 72 | 86.5 |
| Targa Resources Corp. | 228 | 199 | 212 |
The consensus target price for ONEOK, Inc. is moderately above its current price of 72.7 USD, suggesting potential upside. For Targa Resources, the consensus target significantly exceeds the current price of 176.86 USD, indicating stronger expected growth.
Analyst Opinions Comparison
This section compares analysts’ ratings and grades for ONEOK, Inc. and Targa Resources Corp.:
Rating Comparison
OKE Rating
- Rating: B+ with a very favorable status.
- Discounted Cash Flow Score: 5, indicating a very favorable valuation outlook.
- ROE Score: 5, very favorable efficiency in generating profit from equity.
- ROA Score: 4, favorable utilization of assets to generate earnings.
- Debt To Equity Score: 1, very unfavorable financial risk due to high leverage.
TRGP Rating
- Rating: B+ with a very favorable status.
- Discounted Cash Flow Score: 4, indicating a favorable valuation outlook.
- ROE Score: 5, very favorable efficiency in generating profit from equity.
- ROA Score: 5, very favorable utilization of assets to generate earnings.
- Debt To Equity Score: 1, very unfavorable financial risk due to high leverage.
Which one is the best rated?
Both companies share the same overall rating and ROE score, but TRGP has a slightly better ROA score. OKE scores higher on discounted cash flow, while both have equally unfavorable debt to equity scores. Overall, their ratings show comparable strengths and weaknesses.
Scores Comparison
Here is a comparison of the financial health scores for ONEOK and Targa Resources:
ONEOK Scores
- Altman Z-Score: 1.42, in distress zone indicating high bankruptcy risk.
- Piotroski Score: 6, reflecting average financial strength.
Targa Resources Scores
- Altman Z-Score: 2.35, in grey zone indicating moderate bankruptcy risk.
- Piotroski Score: 7, reflecting strong financial strength.
Which company has the best scores?
Targa Resources has better financial scores, with a higher Altman Z-Score in the grey zone and a stronger Piotroski Score compared to ONEOK, which is in distress zone and has an average Piotroski Score.
Grades Comparison
Here is a detailed comparison of the grades and ratings assigned to ONEOK, Inc. and Targa Resources Corp.:
ONEOK, Inc. Grades
The following table shows recent grades from reputable financial institutions for ONEOK, Inc.:
| Grading Company | Action | New Grade | Date |
|---|---|---|---|
| Scotiabank | Maintain | Sector Outperform | 2025-11-04 |
| Citigroup | Maintain | Buy | 2025-10-31 |
| Wells Fargo | Maintain | Equal Weight | 2025-10-30 |
| TD Cowen | Maintain | Hold | 2025-10-30 |
| Raymond James | Maintain | Outperform | 2025-10-24 |
| Barclays | Maintain | Equal Weight | 2025-10-09 |
| Mizuho | Maintain | Neutral | 2025-08-29 |
| Morgan Stanley | Maintain | Overweight | 2025-08-26 |
| RBC Capital | Maintain | Sector Perform | 2025-08-13 |
| RBC Capital | Maintain | Sector Perform | 2025-08-01 |
ONEOK’s grades show a balanced distribution from Hold to Buy categories, with multiple institutions maintaining positive outlooks such as Sector Outperform and Overweight.
Targa Resources Corp. Grades
The following table shows recent grades from reputable financial institutions for Targa Resources Corp.:
| Grading Company | Action | New Grade | Date |
|---|---|---|---|
| Wells Fargo | Maintain | Overweight | 2025-12-18 |
| Scotiabank | Maintain | Sector Outperform | 2025-12-17 |
| RBC Capital | Maintain | Outperform | 2025-12-03 |
| RBC Capital | Maintain | Outperform | 2025-11-18 |
| Scotiabank | Maintain | Sector Outperform | 2025-11-13 |
| Goldman Sachs | Maintain | Buy | 2025-11-13 |
| Morgan Stanley | Maintain | Overweight | 2025-11-12 |
| BMO Capital | Maintain | Outperform | 2025-11-06 |
| JP Morgan | Maintain | Overweight | 2025-10-07 |
| Mizuho | Maintain | Outperform | 2025-08-29 |
Targa Resources shows a strong consensus of Outperform and Overweight ratings, with several Buy and Sector Outperform grades maintained by top-tier institutions.
Which company has the best grades?
Targa Resources Corp. has received generally stronger grades, with more frequent Overweight and Outperform ratings compared to ONEOK’s more mixed Hold and Equal Weight assessments. This stronger consensus may influence investors’ perception of growth potential and risk-adjusted returns.
Strengths and Weaknesses
Below is a comparative overview of the key strengths and weaknesses of ONEOK, Inc. (OKE) and Targa Resources Corp. (TRGP) based on their recent financial and operational data.
| Criterion | ONEOK, Inc. (OKE) | Targa Resources Corp. (TRGP) |
|---|---|---|
| Diversification | Moderate: Diverse segments including Natural Gas Liquids ($15.17B), Gathering & Processing ($4.59B), Refined Products ($4.46B), and Pipelines ($0.82B) | Strong: Focused on Gathering & Processing ($6.81B) and Logistics & Transportation ($14.03B) with clear segment specialization |
| Profitability | Moderate profitability with net margin 14.03%, ROE 17.82%, ROIC 6.29% (neutral) but declining ROIC trend; slightly unfavorable moat status | High profitability with ROE 48.97%, ROIC 11.83%, growing ROIC trend; very favorable moat status indicating durable competitive advantage |
| Innovation | Limited data on innovation; traditional energy infrastructure business model | Limited data on innovation; emphasis on operational efficiency and logistics scale |
| Global presence | Primarily US-focused with extensive regional pipeline and processing assets | Primarily US-focused but with large logistics and transportation infrastructure |
| Market Share | Strong presence in Natural Gas Liquids market segment with $15.17B revenue | Strong market share in gathering and logistics sectors with $6.81B and $14.03B revenue respectively |
Key takeaways: TRGP demonstrates stronger profitability and value creation with a durable moat and focused business segments, despite higher leverage and less diversification. OKE shows moderate diversification and profitability but faces challenges with declining returns and financial leverage. Investors should weigh TRGP’s growth and moat against OKE’s diversification and dividend yield.
Risk Analysis
Below is a summary table highlighting key risks for ONEOK, Inc. (OKE) and Targa Resources Corp. (TRGP) as of 2024.
| Metric | ONEOK, Inc. (OKE) | Targa Resources Corp. (TRGP) |
|---|---|---|
| Market Risk | Moderate (Beta 0.92) | Moderate (Beta 0.87) |
| Debt level | High (Debt/Equity 1.9; Debt/Assets 50.4%) | Very High (Debt/Equity 5.5; Debt/Assets 62.75%) |
| Regulatory Risk | Moderate (Energy sector, US focused) | Moderate (Energy sector, US focused) |
| Operational Risk | Significant (Pipeline and processing operations) | Significant (Extensive pipeline and processing assets) |
| Environmental Risk | Elevated (Natural gas midstream operations) | Elevated (Natural gas and crude oil logistics) |
| Geopolitical Risk | Low to Moderate (Domestic US operations) | Low to Moderate (Domestic US operations) |
The most impactful risks for both companies are their high debt levels, which pose financial risk especially in volatile market conditions. ONEOK’s Altman Z-Score in the distress zone signals heightened bankruptcy risk, while Targa is in the grey zone with moderate risk. Operational and environmental risks are also significant given their midstream energy roles, requiring careful monitoring of regulatory changes and environmental policies. Market risk remains moderate due to stable but cyclical energy demand.
Which Stock to Choose?
ONEOK, Inc. (OKE) shows strong income growth with a favorable global income statement evaluation and a solid net margin of 14.03%. Its financial ratios appear slightly unfavorable overall, with notable debt concerns and a moderate rating of B+. The company’s MOAT evaluation is slightly unfavorable, indicating declining profitability and value shedding.
Targa Resources Corp. (TRGP) presents a favorable income statement with steady revenue and net margin growth, though its net margin is lower at 7.64%. Financial ratios are also slightly unfavorable, mainly due to high leverage, and it shares the same B+ rating as OKE. TRGP’s MOAT is very favorable, reflecting a durable competitive advantage and increasing profitability.
For investors prioritizing durable competitive advantage and improving profitability, TRGP might appear more favorable. Conversely, those valuing stronger net margins and income growth could see OKE as appealing, despite its declining MOAT. The choice may depend on the investor’s tolerance for leverage and focus on growth versus stability.
Disclaimer: Investment carries a risk of loss of initial capital. The past performance is not a reliable indicator of future results. Be sure to understand risks before making an investment decision.
Go Further
I encourage you to read the complete analyses of ONEOK, Inc. and Targa Resources Corp. to enhance your investment decisions: