In the fast-evolving semiconductor industry, ON Semiconductor Corporation and Tower Semiconductor Ltd. stand out as key players driving innovation and market growth. ON focuses on intelligent power and sensing solutions, while Tower excels as a foundry specializing in analog and mixed-signal technologies. Both companies overlap in serving diverse sectors like automotive and industrial electronics. This article will help you decide which company offers the most promising investment opportunity in 2026.
Table of contents
Companies Overview
I will begin the comparison between ON Semiconductor Corporation and Tower Semiconductor Ltd. by providing an overview of these two companies and their main differences.
ON Semiconductor Overview
ON Semiconductor Corporation focuses on providing intelligent sensing and power solutions worldwide, enabling electrification in the automotive sector, fast-charging systems, and sustainable energy applications. Operating through three segments, it offers a broad portfolio of analog, discrete, module, and integrated semiconductor products. The company serves diverse end-markets with advanced semiconductor technologies and is headquartered in Scottsdale, Arizona.
Tower Semiconductor Overview
Tower Semiconductor Ltd. is an independent foundry specializing in manufacturing analog-intensive mixed-signal semiconductor devices with customizable process technologies like SiGe, BiCMOS, and RF CMOS. It offers wafer fabrication and design enablement services to integrated device manufacturers and fabless companies. The company serves multiple markets including consumer electronics, automotive, aerospace, and medical devices, and is based in Migdal Haemek, Israel.
Key similarities and differences
Both companies operate in the semiconductor industry and serve diverse technology markets, including automotive and industrial sectors. ON Semiconductor emphasizes intelligent sensing and power solutions with a focus on electrification and sustainable energy, while Tower Semiconductor focuses on foundry services and customizable mixed-signal technologies. ON has a larger workforce and market capitalization compared to Tower, reflecting different scales and business models within the same sector.
Income Statement Comparison
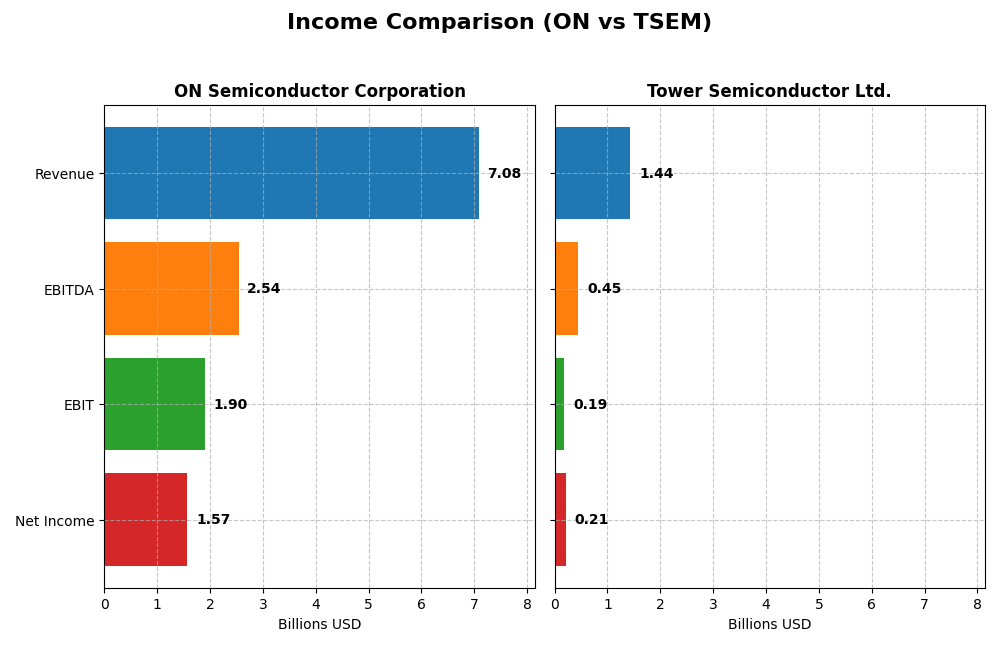
This table provides a snapshot comparison of key income statement metrics for ON Semiconductor Corporation and Tower Semiconductor Ltd. for the fiscal year 2024.
| Metric | ON Semiconductor Corporation | Tower Semiconductor Ltd. |
|---|---|---|
| Market Cap | 24.7B | 13.9B |
| Revenue | 7.08B | 1.44B |
| EBITDA | 2.54B | 451M |
| EBIT | 1.90B | 185M |
| Net Income | 1.57B | 208M |
| EPS | 3.68 | 1.87 |
| Fiscal Year | 2024 | 2024 |
Income Statement Interpretations
ON Semiconductor Corporation
ON Semiconductor showed strong overall growth from 2020 to 2024, with revenue rising by 34.77% and net income increasing over 570%. Margins remained favorable, with a gross margin of 45.41% and a net margin of 22.21% in 2024. However, the latest year saw declines in revenue (-14.19%) and net income (-16.07%), indicating a slowdown in growth and margin compression.
Tower Semiconductor Ltd.
Tower Semiconductor experienced moderate revenue growth of 13.47% and net income growth of 152.56% between 2020 and 2024. Its 2024 gross margin stood at 23.64%, with a net margin of 14.47%. Despite these favorable margins, 2024 showed a slight revenue increase (0.94%) but significant declines in EBIT (-68.6%) and net margin (-60.29%), reflecting operational challenges in the most recent fiscal year.
Which one has the stronger fundamentals?
Both companies display favorable overall income statement evaluations with similar proportions of positive metrics. ON Semiconductor leads with higher margins and stronger net income growth over the period, though it faced notable declines in 2024. Tower Semiconductor has lower margins and experienced sharper profit contractions last year despite steady revenue. ON Semiconductor’s fundamentals appear stronger based on margin and growth profiles.
Financial Ratios Comparison
The table below presents a side-by-side comparison of key financial ratios for ON Semiconductor Corporation and Tower Semiconductor Ltd. based on their most recent fiscal year data (2024).
| Ratios | ON Semiconductor Corporation | Tower Semiconductor Ltd. |
|---|---|---|
| ROE | 17.9% | 7.8% |
| ROIC | 11.9% | 6.4% |
| P/E | 17.1 | 27.5 |
| P/B | 3.06 | 2.16 |
| Current Ratio | 5.06 | 6.18 |
| Quick Ratio | 3.38 | 5.23 |
| D/E (Debt-to-Equity) | 0.38 | 0.07 |
| Debt-to-Assets | 23.9% | 5.9% |
| Interest Coverage | 28.4 | 32.6 |
| Asset Turnover | 0.50 | 0.47 |
| Fixed Asset Turnover | 1.61 | 1.11 |
| Payout ratio | 0% | 0% |
| Dividend yield | 0% | 0% |
Interpretation of the Ratios
ON Semiconductor Corporation
ON Semiconductor shows mostly favorable financial ratios, including strong net margin at 22.21%, ROE of 17.88%, and solid interest coverage at 30.49, indicating good profitability and debt management. However, concerns arise from an unfavorable current ratio of 5.06 and a price-to-book ratio of 3.06. The company does not pay dividends, consistent with reinvestment into growth and operations.
Tower Semiconductor Ltd.
Tower Semiconductor’s ratios reveal mixed strengths, with a favorable net margin of 14.47% and a low debt-to-assets ratio of 5.87%, reflecting conservative leverage. However, ROE at 7.83% and asset turnover at 0.47 are less strong, and the PE ratio of 27.54 is unfavorable. Like ON, Tower Semiconductor does not pay dividends, likely focusing on R&D and expansion.
Which one has the best ratios?
ON Semiconductor has a higher proportion of favorable ratios (50%) compared to Tower Semiconductor’s 42.86%, with stronger profitability and returns metrics. Both companies have slightly favorable global opinions, but ON’s higher ROE and net margin suggest comparatively better financial health despite some liquidity concerns.
Strategic Positioning
This section compares the strategic positioning of ON Semiconductor and Tower Semiconductor, focusing on Market position, Key segments, and Exposure to technological disruption:
ON Semiconductor
- Large market cap of 24.7B USD, faces competitive pressure in semiconductors with a beta of 1.543.
- Diverse key segments: Power Solutions (3.3B), Analog Solutions (2.6B), Intelligent Sensing (1.1B).
- Engaged in advanced power technologies and image sensors, but no explicit mention of disruption exposure.
Tower Semiconductor
- Smaller market cap of 13.9B USD, lower beta at 0.876 indicating less volatility.
- Focused on foundry services and analog mixed-signal semiconductor manufacturing.
- Provides customizable process technologies including SiGe, BiCMOS, CMOS, MEMS, serving multiple markets.
ON Semiconductor vs Tower Semiconductor Positioning
ON Semiconductor pursues a diversified strategy across multiple segments with significant revenues, while Tower Semiconductor concentrates on foundry and analog mixed-signal niches. ON’s broad product range offers multiple business drivers; Tower’s specialization targets specific process technologies and markets.
Which has the best competitive advantage?
Both companies are shedding value as ROIC remains below WACC, but ON shows a slightly favorable moat with growing profitability, whereas Tower Semiconductor’s moat is slightly unfavorable despite improving ROIC, indicating ON has a marginally stronger competitive advantage.
Stock Comparison
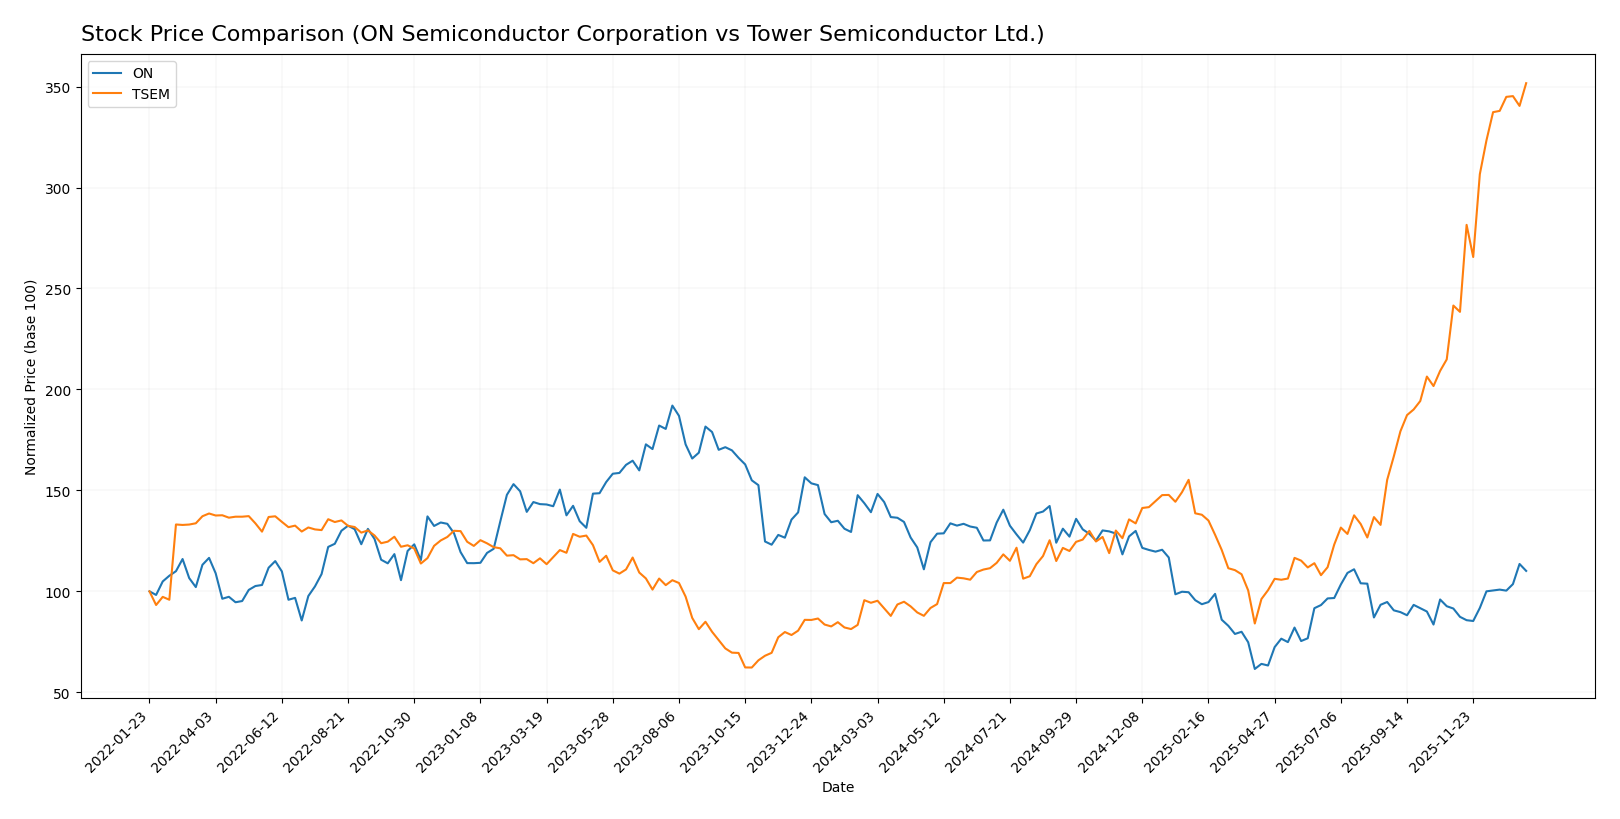
The stock prices of ON Semiconductor Corporation and Tower Semiconductor Ltd. have exhibited contrasting dynamics over the past year, with ON showing a pronounced bearish trend and Tower Semiconductor demonstrating strong bullish momentum and acceleration.
Trend Analysis
ON Semiconductor’s stock declined by 20.88% over the past 12 months, indicating a clear bearish trend with accelerating downward momentum. The price fluctuated between a high of 81.14 and a low of 33.7, with notable volatility measured by a standard deviation of 11.97.
Tower Semiconductor’s stock surged 272.71% during the same period, reflecting a robust bullish trend with acceleration. The share price ranged from 29.65 to 124.0, accompanied by a higher volatility level, with a standard deviation of 23.67.
Comparing both stocks, Tower Semiconductor delivered the highest market performance, significantly outperforming ON Semiconductor in terms of price appreciation and buyer dominance over the past year.
Target Prices
The consensus target prices for ON Semiconductor Corporation and Tower Semiconductor Ltd. suggest promising growth potential.
| Company | Target High | Target Low | Consensus |
|---|---|---|---|
| ON Semiconductor Corporation | 64 | 51 | 58.33 |
| Tower Semiconductor Ltd. | 125 | 66 | 96 |
Analysts expect ON Semiconductor’s stock price to be slightly below the current 60.28 USD, indicating moderate upside potential. Tower Semiconductor’s consensus target of 96 USD is notably below its current 124 USD price, suggesting caution.
Analyst Opinions Comparison
This section compares analysts’ ratings and grades for ON Semiconductor Corporation (ON) and Tower Semiconductor Ltd. (TSEM):
Rating Comparison
ON Rating
- Rating: B-, considered very favorable overall.
- Discounted Cash Flow Score: 3, indicating a moderate valuation assessment.
- ROE Score: 2, reflecting moderate efficiency in generating profit from equity.
- ROA Score: 3, indicating moderate effectiveness in asset utilization.
- Debt To Equity Score: 2, moderate financial risk.
- Overall Score: 2, moderate overall financial standing.
TSEM Rating
- Rating: B+, also considered very favorable overall.
- Discounted Cash Flow Score: 3, indicating a moderate valuation assessment.
- ROE Score: 3, showing better efficiency in profit generation from equity.
- ROA Score: 4, indicating favorable effectiveness in asset utilization.
- Debt To Equity Score: 4, favorable financial risk profile.
- Overall Score: 3, moderate but higher overall financial standing.
Which one is the best rated?
Based strictly on the provided data, TSEM holds a higher rating (B+) and outperforms ON in return on equity, return on assets, debt-to-equity, and overall scores, indicating a stronger financial profile in these key metrics.
Scores Comparison
Here is a comparison of the Altman Z-Score and Piotroski Score for ON Semiconductor Corporation and Tower Semiconductor Ltd:
ON Scores
- Altman Z-Score: 4.84, indicating a safe financial zone and low bankruptcy risk.
- Piotroski Score: 6, representing average financial strength and investment quality.
TSEM Scores
- Altman Z-Score: 21.06, well within the safe zone, showing very low bankruptcy risk.
- Piotroski Score: 7, indicating strong financial health and good investment potential.
Which company has the best scores?
Based strictly on the provided data, TSEM outperforms ON in both scores, having a much higher Altman Z-Score and a stronger Piotroski Score. This suggests TSEM has better financial stability and health according to these metrics.
Grades Comparison
The grades for ON Semiconductor Corporation and Tower Semiconductor Ltd. from various reputable grading companies are as follows:
ON Semiconductor Corporation Grades
Below is a summary of recent grades assigned by recognized grading companies to ON Semiconductor Corporation:
| Grading Company | Action | New Grade | Date |
|---|---|---|---|
| Piper Sandler | Maintain | Overweight | 2026-01-07 |
| Truist Securities | Maintain | Hold | 2025-12-19 |
| Morgan Stanley | Maintain | Equal Weight | 2025-11-24 |
| Truist Securities | Maintain | Hold | 2025-11-04 |
| Baird | Maintain | Neutral | 2025-11-04 |
| Rosenblatt | Maintain | Neutral | 2025-11-04 |
| Morgan Stanley | Maintain | Equal Weight | 2025-11-04 |
| TD Cowen | Maintain | Buy | 2025-11-04 |
| UBS | Maintain | Neutral | 2025-10-27 |
| B of A Securities | Maintain | Neutral | 2025-09-05 |
The overall trend for ON Semiconductor shows consistent maintenance of neutral to moderately positive ratings, with no recent upgrades or downgrades.
Tower Semiconductor Ltd. Grades
This table presents recent grades from established grading companies for Tower Semiconductor Ltd.:
| Grading Company | Action | New Grade | Date |
|---|---|---|---|
| Benchmark | Maintain | Buy | 2026-01-09 |
| Wedbush | Downgrade | Neutral | 2025-12-31 |
| Benchmark | Maintain | Buy | 2025-11-11 |
| Susquehanna | Maintain | Positive | 2025-11-11 |
| Wedbush | Maintain | Outperform | 2025-11-11 |
| Barclays | Maintain | Equal Weight | 2025-11-11 |
| Benchmark | Maintain | Buy | 2025-09-08 |
| Susquehanna | Maintain | Positive | 2025-08-05 |
| Benchmark | Maintain | Buy | 2025-08-05 |
| Benchmark | Maintain | Buy | 2025-08-04 |
Tower Semiconductor’s ratings generally remain positive, with multiple buy and outperform recommendations, although a recent downgrade from Wedbush to Neutral is notable.
Which company has the best grades?
Both companies hold a consensus “Buy” rating, but Tower Semiconductor Ltd. has received more frequent “Buy” and “Outperform” grades compared to ON Semiconductor Corporation’s more neutral and hold-oriented ratings. This may suggest stronger analyst confidence in Tower Semiconductor’s prospects, which investors might consider when assessing potential portfolio impacts.
Strengths and Weaknesses
Below is a comparative overview of key strengths and weaknesses for ON Semiconductor Corporation (ON) and Tower Semiconductor Ltd. (TSEM) based on the most recent financial and operational data.
| Criterion | ON Semiconductor Corporation (ON) | Tower Semiconductor Ltd. (TSEM) |
|---|---|---|
| Diversification | Highly diversified across Power, Analog, and Intelligent Sensing segments with revenues of $3.35B, $2.61B, and $1.13B respectively in 2024 | Less diversified, focused mainly on foundry services with limited segmentation data |
| Profitability | Strong profitability with 22.21% net margin, ROIC 11.88%, and ROE 17.88% (all favorable) | Moderate profitability: 14.47% net margin, ROIC 6.41% (neutral), but weaker ROE 7.83% (unfavorable) |
| Innovation | Growing ROIC trend (+156%), indicating improving operational efficiency and value creation potential | Also growing ROIC (+44%), but overall value destruction as ROIC is below WACC |
| Global presence | Significant global footprint supported by varied product groups and strong balance sheet metrics | Global foundry operations but smaller scale and less financial robustness compared to ON |
| Market Share | Strong in power solutions and analog semiconductors with steady revenue growth | Niche player in specialty foundry, smaller market share and higher risk profile |
Key takeaways: ON demonstrates stronger diversification and profitability with a slightly favorable moat, reflecting efficient capital use and growth potential. TSEM shows improving profitability but still struggles with value destruction and a less diversified portfolio, posing higher risks for investors.
Risk Analysis
Below is a comparison of key risks for ON Semiconductor Corporation (ON) and Tower Semiconductor Ltd. (TSEM) based on the most recent 2024 data.
| Metric | ON Semiconductor Corporation (ON) | Tower Semiconductor Ltd. (TSEM) |
|---|---|---|
| Market Risk | Beta 1.54 indicates higher volatility and sensitivity to market swings. | Beta 0.88 shows lower volatility, more stable in market fluctuations. |
| Debt Level | Moderate debt with Debt/Equity 0.38 and Debt to Assets 23.9%, manageable interest coverage at 30.49. | Low debt with Debt/Equity 0.07 and Debt to Assets 5.87%, strong interest coverage 31.57. |
| Regulatory Risk | US-based, exposed to evolving semiconductor and trade regulations affecting supply chain and exports. | Israel-based, sensitive to international trade policies and export controls in semiconductor industry. |
| Operational Risk | Larger scale with 26.4K employees, complexity in supply chain and manufacturing. | Smaller workforce (5.6K) but dependent on foundry technology and customer contracts. |
| Environmental Risk | Industry shift towards sustainable energy and electrification offers opportunities but regulatory pressures on emissions and waste. | Similar environmental challenges with focus on process efficiency and reducing environmental footprint. |
| Geopolitical Risk | US-China trade tensions impact supply chains and market access. | Geopolitical instability in the Middle East and export restrictions could pose risks. |
The most impactful and likely risks are market volatility for ON due to its higher beta and geopolitical tensions affecting both companies—especially trade and export restrictions. ON’s moderate debt level is manageable, while TSEM’s low leverage offers a cushion. Both firms must navigate regulatory and environmental pressures amid a competitive semiconductor landscape.
Which Stock to Choose?
ON Semiconductor Corporation shows a favorable income statement with strong profitability despite a recent revenue decline. Its financial ratios are slightly favorable, supported by moderate debt levels and a very favorable overall rating. The company’s ROIC is growing but remains below WACC, indicating slight value erosion.
Tower Semiconductor Ltd. displays a favorable income statement with moderate profitability and steady income growth. Financial ratios are slightly favorable, featuring low debt and a very favorable rating. However, its ROIC, while increasing, is below WACC, suggesting the company is also shedding value.
Investors focused on growth might find Tower Semiconductor’s accelerating stock trend and improving profitability appealing, while those prioritizing stable profitability and stronger equity returns could see ON Semiconductor as more suitable. Both companies present a blend of favorable and unfavorable signals, with risk tolerance and investment strategy guiding the interpretation.
Disclaimer: Investment carries a risk of loss of initial capital. The past performance is not a reliable indicator of future results. Be sure to understand risks before making an investment decision.
Go Further
I encourage you to read the complete analyses of ON Semiconductor Corporation and Tower Semiconductor Ltd. to enhance your investment decisions: