Home > Comparison > Technology > TXN vs ON
The strategic rivalry between Texas Instruments Incorporated and ON Semiconductor Corporation shapes the evolution of the semiconductor industry. Texas Instruments operates as a diversified analog and embedded processing powerhouse, while ON Semiconductor focuses on intelligent sensing and power solutions, particularly for automotive electrification. This head-to-head contrasts a market-leading semiconductor giant with a high-growth specialized innovator. This analysis aims to identify which trajectory offers superior risk-adjusted returns for a diversified portfolio in the technology sector.
Table of contents
Companies Overview
Texas Instruments and ON Semiconductor stand as pivotal players in the semiconductor sector, shaping technology worldwide.
Texas Instruments Incorporated: Analog and Embedded Processing Powerhouse
Texas Instruments focuses on semiconductor design and manufacturing, driving revenue through Analog and Embedded Processing segments. It excels in power management products and microcontrollers, serving industries from automotive to industrial. In 2026, its strategic focus remains on enhancing power efficiency and expanding product applications across diverse end markets, reinforcing its market leadership in analog semiconductors.
ON Semiconductor Corporation: Intelligent Sensing and Power Solutions Leader
ON Semiconductor commands the market with intelligent sensing and power technologies that support automotive electrification and sustainable energy. It generates revenue via advanced analog, mixed-signal, and ASIC products across three segments. The 2026 strategy emphasizes electrification of vehicles and renewable energy solutions, pushing innovation in power conversion and sensing for emerging green technologies.
Strategic Collision: Similarities & Divergences
Both companies dominate the semiconductor space but diverge in approach: Texas Instruments champions a broad product portfolio with deep analog expertise, while ON Semiconductor targets specialized power solutions and sensing for electrification. Their primary battleground is automotive and industrial applications, where efficiency and innovation dictate market share. Investors face distinct profiles: Texas Instruments’ stable analog moat contrasts with ON Semiconductor’s growth-driven, higher-beta exposure.
Income Statement Comparison
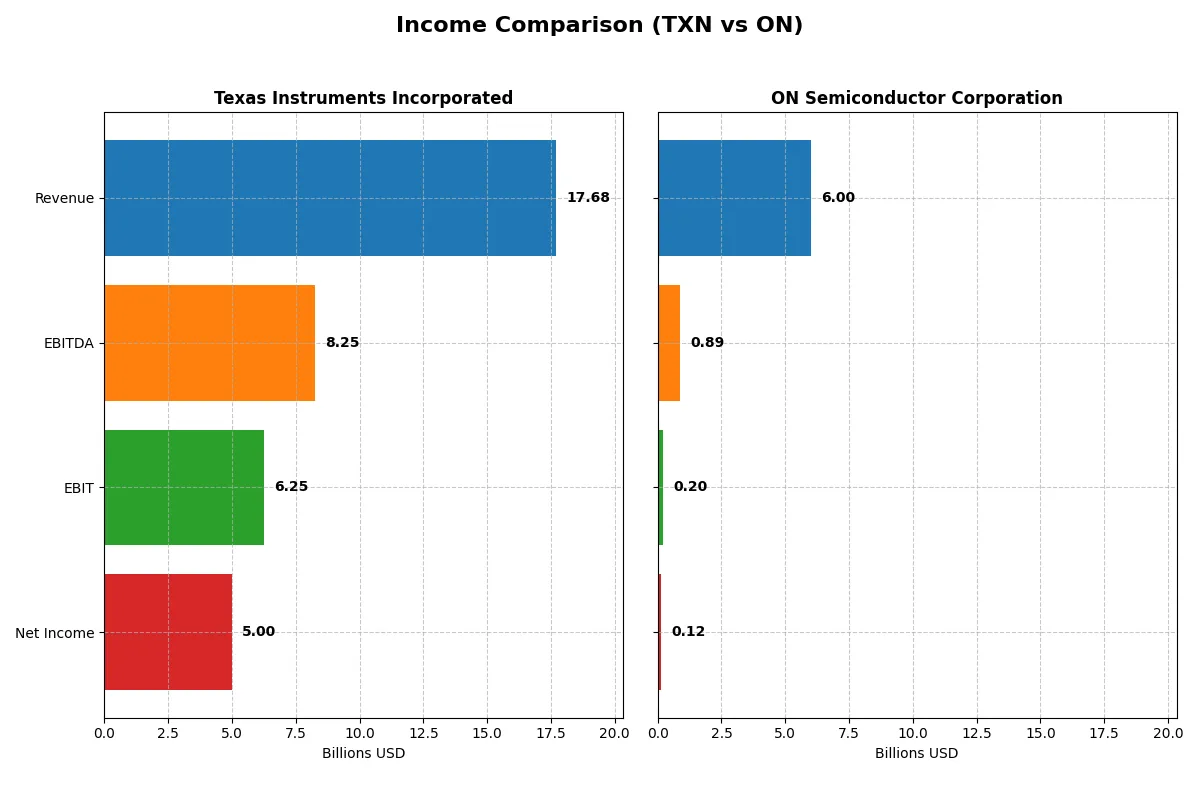
This data dissects the core profitability and scalability of both corporate engines to reveal who dominates the bottom line:
| Metric | Texas Instruments Incorporated (TXN) | ON Semiconductor Corporation (ON) |
|---|---|---|
| Revenue | 17.7B | 6.0B |
| Cost of Revenue | 7.6B | 4.1B |
| Operating Expenses | 4.1B | 1.2B |
| Gross Profit | 10.1B | 1.9B |
| EBITDA | 8.3B | 888M |
| EBIT | 6.3B | 202M |
| Interest Expense | 543M | 71M |
| Net Income | 5.0B | 121M |
| EPS | 5.45 | 0.29 |
| Fiscal Year | 2025 | 2025 |
Income Statement Analysis: The Bottom-Line Duel
The income statement comparison reveals which company converts revenue into profit most efficiently, exposing the strength of each business model.
Texas Instruments Incorporated Analysis
Texas Instruments (TXN) shows a mixed revenue path, peaking at 20B in 2022 before declining to 17.7B in 2025. Despite this, TXN maintains robust gross margins above 57% and a strong net margin near 28%. The 2025 net income of 5B reflects solid operational control amid modest revenue growth, signaling effective margin management.
ON Semiconductor Corporation Analysis
ON Semiconductor (ON) faces a declining revenue trend, dropping from 8.3B in 2022 to 6B in 2025. Its gross margin is substantially lower at 32%, and net margin barely reaches 2%. The 2025 net income contracts sharply to 121M, highlighting efficiency challenges and significant margin compression alongside shrinking top-line momentum.
Margin Power vs. Revenue Scale
Texas Instruments outperforms ON Semiconductor with superior margins and a healthier bottom line despite softer revenue growth. TXN’s ability to sustain profitability at scale contrasts with ON’s steep earnings decline and margin erosion. For investors, TXN’s profile offers more reliable earnings power and operational resilience.
Financial Ratios Comparison
These vital ratios act as a diagnostic tool to expose the underlying fiscal health, valuation premiums, and capital efficiency of the companies compared below:
| Ratios | Texas Instruments (TXN) | ON Semiconductor (ON) |
|---|---|---|
| ROE | 30.7% | 1.6% |
| ROIC | 16.5% | 6.2% |
| P/E | 31.5 | 184.0 |
| P/B | 9.7 | 2.9 |
| Current Ratio | 4.35 | 4.52 |
| Quick Ratio | 2.83 | 2.98 |
| D/E | 0.95 | 0.45 |
| Debt-to-Assets | 44.5% | 27.7% |
| Interest Coverage | 11.1 | 10.5 |
| Asset Turnover | 0.51 | 0.48 |
| Fixed Asset Turnover | 1.44 | 1.77 |
| Payout Ratio | 100.0% | 0% |
| Dividend Yield | 3.17% | 0% |
| Fiscal Year | 2025 | 2025 |
Efficiency & Valuation Duel: The Vital Signs
Financial ratios act as the company’s DNA, revealing hidden risks and strengths in operational and valuation metrics.
Texas Instruments Incorporated
Texas Instruments demonstrates strong profitability with a 30.7% ROE and a robust 28.3% net margin, signaling operational excellence. Its valuation appears stretched, with a high P/E of 31.5 and a P/B ratio of 9.7. The company returns value via a 3.17% dividend yield, balancing growth and shareholder income.
ON Semiconductor Corporation
ON Semiconductor shows weak profitability, posting a 1.6% ROE and a 2.0% net margin, reflecting operational challenges. Its P/E ratio is extremely elevated at 183.9, suggesting overvaluation. The firm does not pay dividends, instead likely reinvesting in growth amid a modest ROIC of 6.2%, but risks remain apparent.
Premium Valuation vs. Operational Safety
Texas Instruments offers superior profitability and a clear shareholder return through dividends, though at a premium valuation. ON Semiconductor’s growth profile is overshadowed by weak returns and stretched valuation. Investors prioritizing stability and income may prefer Texas Instruments, while growth seekers face higher risk with ON.
Which one offers the Superior Shareholder Reward?
I compare Texas Instruments (TXN) and ON Semiconductor (ON) on their shareholder return strategies. TXN pays a 3.17% dividend yield with nearly 100% payout, fueled by solid free cash flow of 2.9B in 2025. It also supports buybacks, though at a moderate pace relative to cash flow. ON offers no dividend but reinvests heavily in growth, boosting free cash flow to 3.5B and maintaining a low payout ratio of 0%. ON’s buyback activity is visible but less emphasized than TXN’s dividends. TXN’s distribution method is historically sustainable due to strong cash flow coverage, while ON’s reinvestment strategy suits growth investors but carries execution risks. I find TXN delivers superior total shareholder reward in 2026 through balanced dividends and buybacks, combining income and capital appreciation.
Comparative Score Analysis: The Strategic Profile
The radar chart reveals the fundamental DNA and trade-offs of Texas Instruments and ON Semiconductor’s financial and valuation profiles:
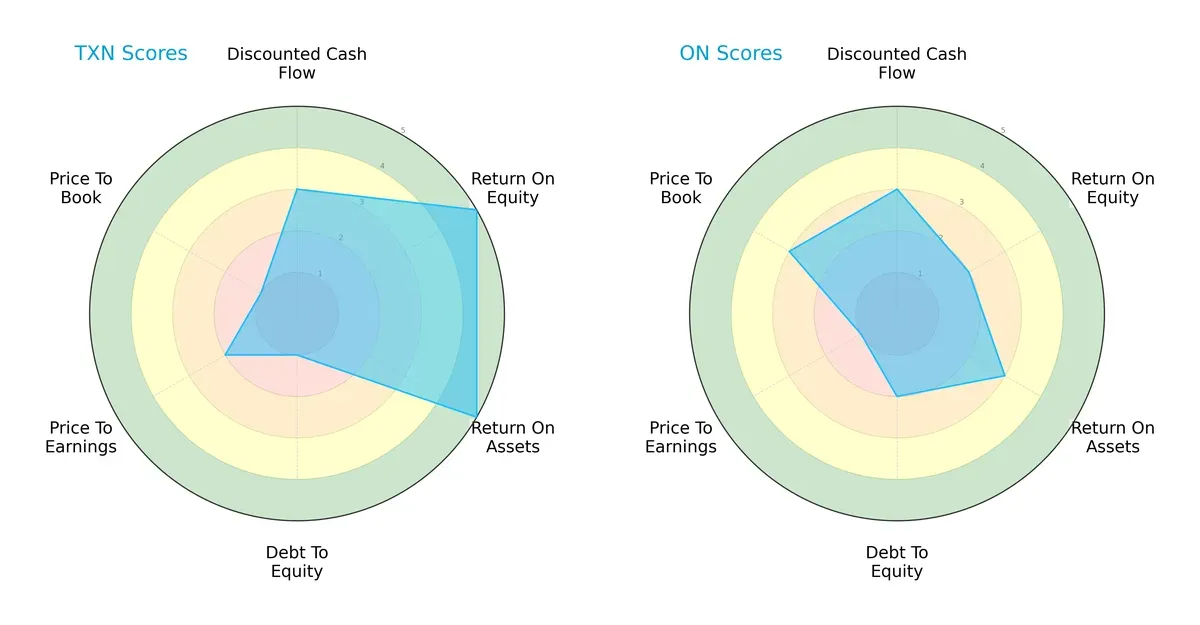
Texas Instruments excels in profitability metrics with high ROE (5) and ROA (5) scores, showing operational efficiency. ON Semiconductor lags with weaker ROE (2) and moderate ROA (3), reflecting less effective asset use. Texas Instruments carries a heavy debt burden (Debt/Equity score 1) and undervalued market multiples (P/E 2, P/B 1), suggesting financial risk despite strong profitability. ON Semiconductor presents a more balanced but overall weaker profile, with moderate leverage (Debt/Equity 2) but less attractive valuation (P/E 1). I see Texas Instruments as relying on a strong profit engine offset by leverage risk, while ON Semiconductor’s profile lacks a clear competitive edge.
Bankruptcy Risk: Solvency Showdown
Texas Instruments and ON Semiconductor both reside safely above distress thresholds, but their Altman Z-Scores reveal differing solvency margins:
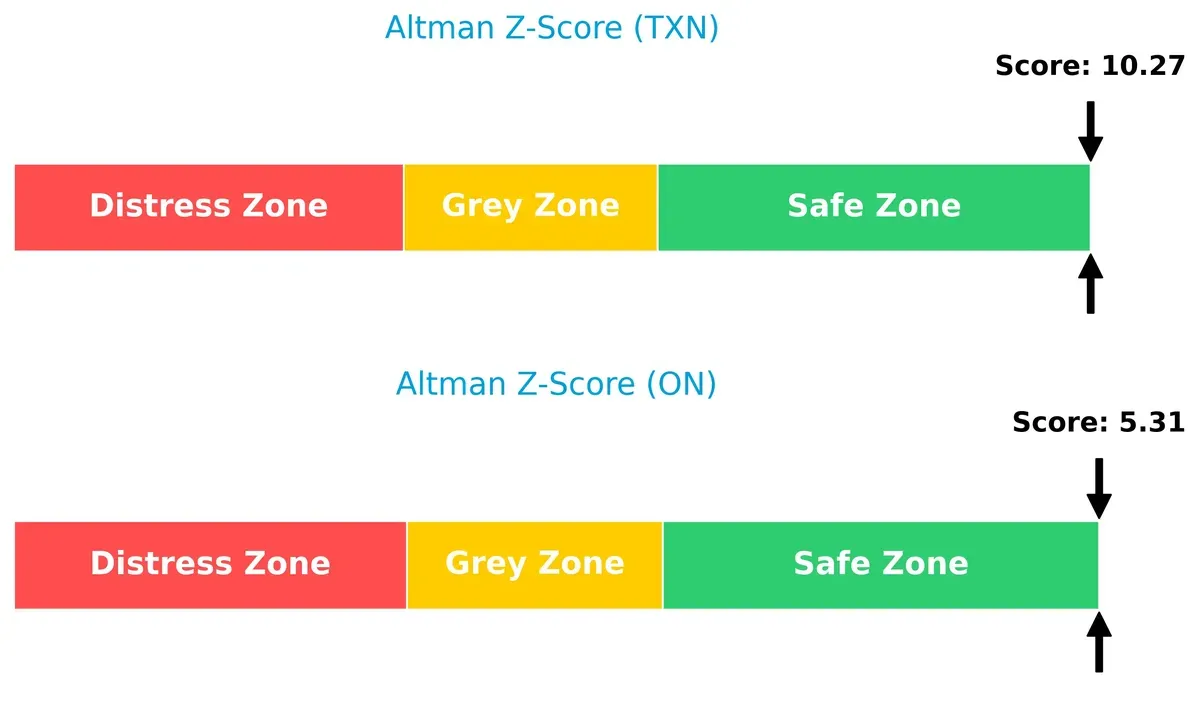
Texas Instruments scores an impressive 10.3, signaling robust financial health and a very low bankruptcy risk. ON Semiconductor’s 5.3, while safely in the zone, indicates comparatively higher vulnerability. In this cycle, Texas Instruments offers superior long-term survival confidence.
Financial Health: Quality of Operations
Texas Instruments and ON Semiconductor show solid financial health, but Texas Instruments leads in operational quality:
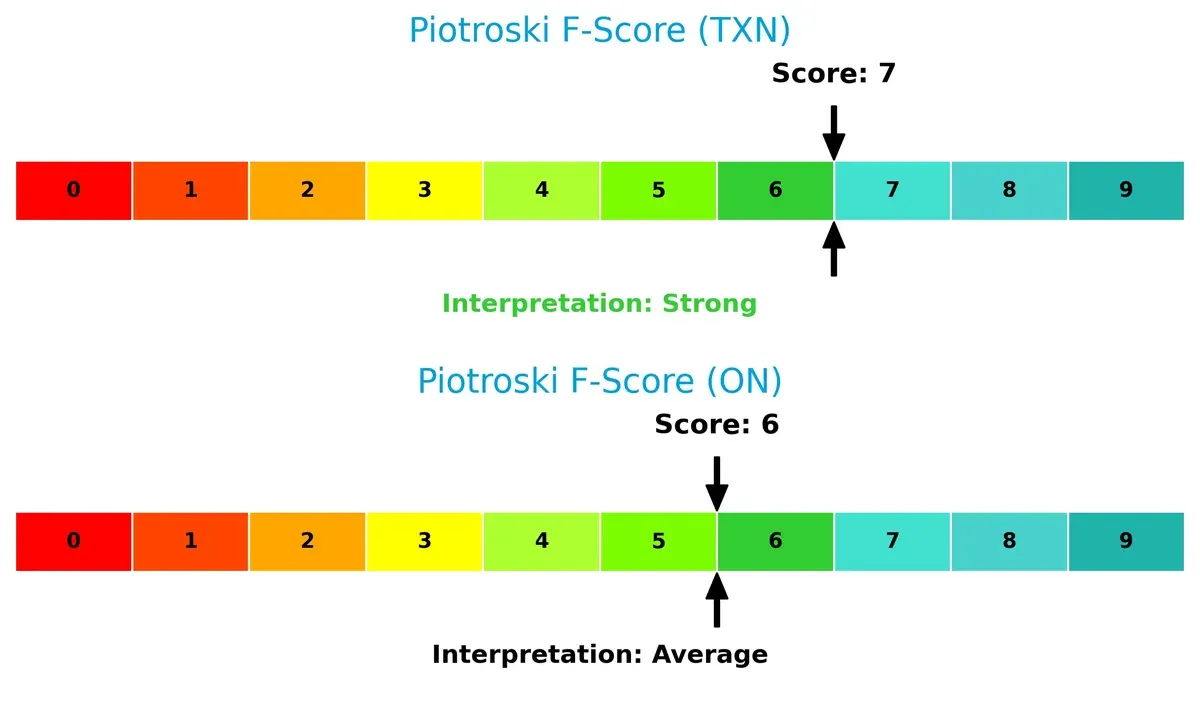
Texas Instruments scores 7, denoting strong internal financial metrics and operational efficiency. ON Semiconductor’s 6, though respectable, suggests average financial health with some room for improvement. I see no immediate red flags, but Texas Instruments demonstrates a more consistent quality of earnings and balance sheet strength.
How are the two companies positioned?
This section dissects the operational DNA of Texas Instruments and ON Semiconductor by comparing their revenue distribution and internal dynamics. The objective is to confront their economic moats and identify which model offers the most resilient, sustainable competitive advantage today.
Revenue Segmentation: The Strategic Mix
This visual comparison dissects how Texas Instruments and ON Semiconductor diversify their income streams and where their primary sector bets lie:
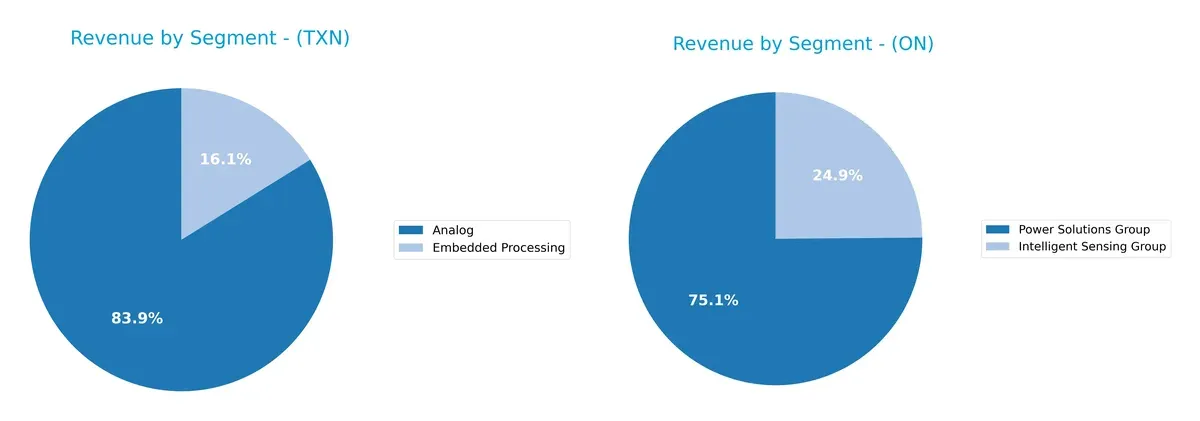
Texas Instruments anchors its revenue in Analog with $14B in 2025, supplemented by Embedded Processing at $2.7B, showcasing moderate diversification. ON Semiconductor pivots more evenly between Power Solutions Group at $2.8B and Intelligent Sensing Group at $928M, reflecting a broader spread. TI’s heavy Analog focus signals infrastructure dominance but heightens concentration risk. ON’s mix supports ecosystem lock-in across sensing and power domains, suggesting resilience through diversity.
Strengths and Weaknesses Comparison
This table compares the Strengths and Weaknesses of Texas Instruments (TXN) and ON Semiconductor (ON):
TXN Strengths
- High net margin and ROE above 28% and 30%
- ROIC well above WACC indicating strong capital allocation
- Diverse revenue streams with significant Analog and Embedded Processing segments
- Strong global presence including US, China, and EMEA
- Favorable dividend yield at 3.17%
ON Strengths
- Favorable debt-to-equity and debt-to-assets ratios indicating prudent leverage
- Strong quick ratio above 2.9 supports liquidity
- Diverse product groups including Intelligent Sensing and Power Solutions
- Presence in multiple geographic markets such as Hong Kong, Singapore, UK, and US
TXN Weaknesses
- Unfavorable valuation multiples with PE at 31.5 and PB near 9.7
- High current ratio over 4 may indicate inefficient working capital use
- Debt levels neutral but could be better managed
- Limited fixed asset turnover performance
ON Weaknesses
- Low profitability with net margin and ROE near 2% and 1.6% respectively
- ROIC below WACC signals weak capital returns
- High WACC at 10.1% increases cost of capital
- Very high PE of 183.9 suggests overvaluation
- Lack of dividend yield and unfavorable asset turnover
Texas Instruments demonstrates stronger profitability and capital efficiency, which supports its sustainable competitive advantage. ON Semiconductor shows financial prudence in leverage but faces challenges in profitability and valuation. These contrasts highlight differing strategic priorities and operational effectiveness.
The Moat Duel: Analyzing Competitive Defensibility
A structural moat is the only thing protecting long-term profits from the relentless erosion of competition. Let’s dissect these moats in 2026:
Texas Instruments Incorporated: Intangible Assets and Cost Advantage
Texas Instruments leverages a robust mix of intangible assets and cost efficiency, reflected in a high ROIC 8.5% above WACC and stable 57% gross margins. Despite a declining ROIC trend, new analog and embedded processing innovations could deepen its moat.
ON Semiconductor Corporation: Emerging Power Solutions
ON Semiconductor relies on its growing position in automotive electrification and intelligent sensing. However, it suffers from a negative ROIC vs. WACC and shrinking margins, signaling a fragile moat compared to Texas Instruments. Expansion in EV fast-charging offers some upside if profitability recovers.
Moat Strength: Intangible Assets vs. Growth Potential
Texas Instruments holds the deeper and wider moat with consistent value creation and margin stability. ON Semiconductor’s moat is vulnerable, undermined by value destruction and margin pressure. Texas Instruments is better equipped to defend its market share in 2026.
Which stock offers better returns?
The past year shows distinct price movements: Texas Instruments rallies sharply, while ON Semiconductor trends downward overall despite a recent surge.
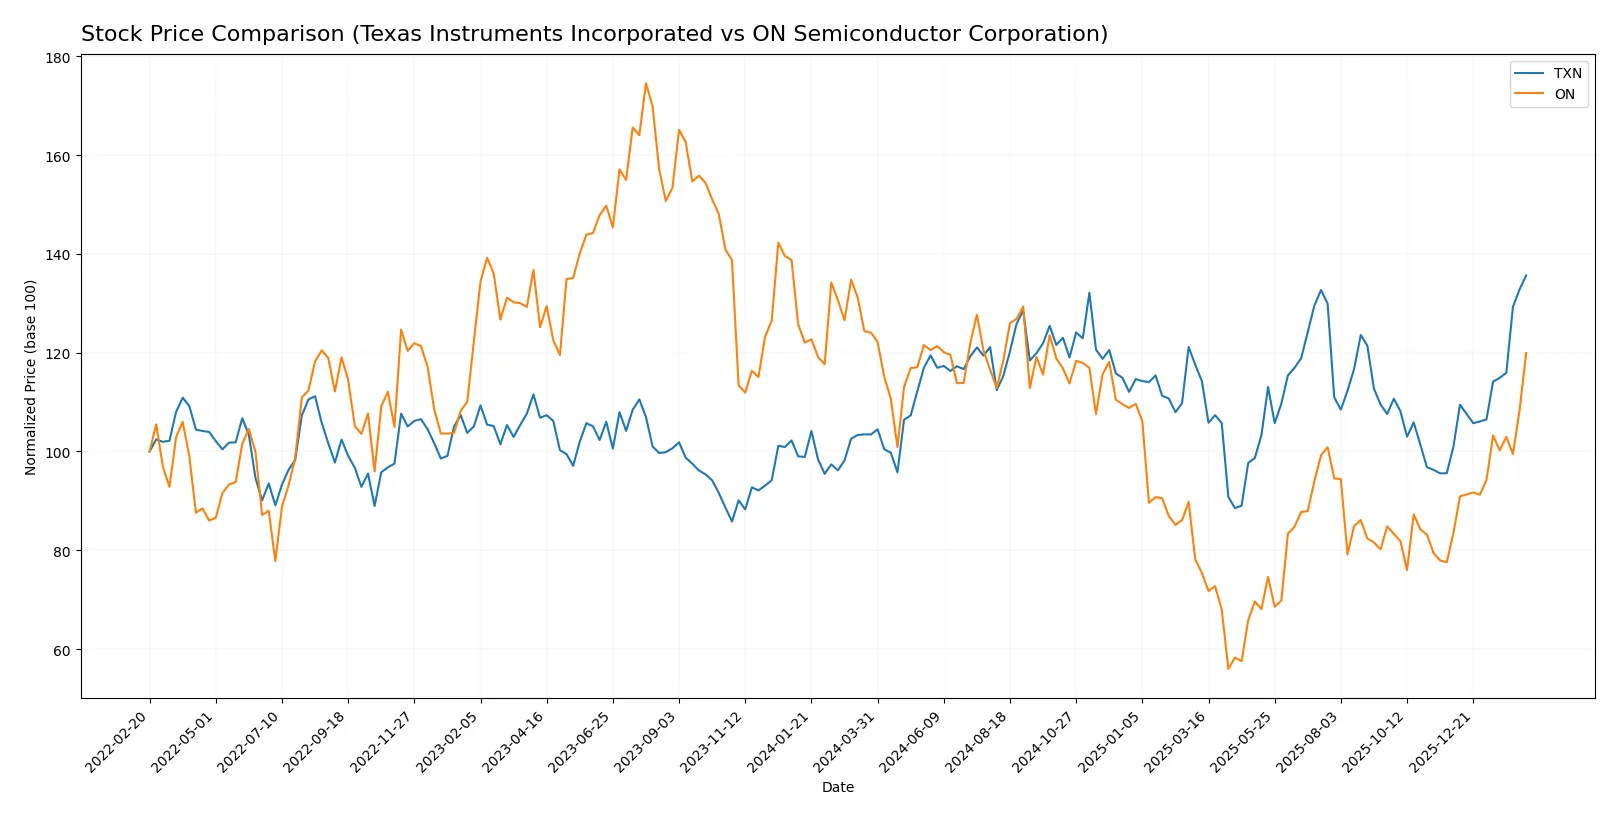
Trend Comparison
Texas Instruments stock rises 31.12% over 12 months, marking a bullish trend with acceleration and a high volatility of 16.56%. The price range spans from 147.6 to a peak of 226.16.
ON Semiconductor declines 3.31% over the same period, indicating a bearish trend with acceleration. The stock’s volatility registers lower at 11.47%, with prices fluctuating between 33.7 and 77.87.
Comparing both, Texas Instruments delivers the strongest market performance with sustained gains. ON Semiconductor lags despite a recent recovery phase.
Target Prices
Analysts present a balanced target consensus for Texas Instruments and ON Semiconductor, reflecting cautious optimism.
| Company | Target Low | Target High | Consensus |
|---|---|---|---|
| Texas Instruments Incorporated | 160 | 260 | 204.64 |
| ON Semiconductor Corporation | 51 | 75 | 62.4 |
The target consensus for Texas Instruments at 204.64 indicates modest downside risk relative to its 226.16 current price. ON Semiconductor’s consensus of 62.4 suggests downside from its 72.21 share price, signaling mixed near-term expectations.

Don’t Let Luck Decide Your Entry Point
Optimize your entry points with our advanced ProRealTime indicators. You’ll get efficient buy signals with precise price targets for maximum performance. Start outperforming now!
How do institutions grade them?
The following tables present recent institutional grades for Texas Instruments Incorporated and ON Semiconductor Corporation:
Texas Instruments Incorporated Grades
This table summarizes recent grades assigned by major financial institutions to Texas Instruments Incorporated.
| Grading Company | Action | New Grade | Date |
|---|---|---|---|
| Rosenblatt | Maintain | Buy | 2026-02-05 |
| Mizuho | Maintain | Underperform | 2026-01-28 |
| Keybanc | Maintain | Overweight | 2026-01-28 |
| Goldman Sachs | Maintain | Sell | 2026-01-28 |
| B of A Securities | Upgrade | Neutral | 2026-01-28 |
| Cantor Fitzgerald | Maintain | Neutral | 2026-01-28 |
| Rosenblatt | Maintain | Buy | 2026-01-28 |
| JP Morgan | Maintain | Overweight | 2026-01-28 |
| Benchmark | Maintain | Buy | 2026-01-28 |
| Truist Securities | Maintain | Hold | 2026-01-28 |
ON Semiconductor Corporation Grades
This table lists recent institutional grades for ON Semiconductor Corporation.
| Grading Company | Action | New Grade | Date |
|---|---|---|---|
| JP Morgan | Maintain | Neutral | 2026-02-10 |
| Citigroup | Maintain | Neutral | 2026-02-10 |
| Wells Fargo | Maintain | Overweight | 2026-02-10 |
| Benchmark | Downgrade | Hold | 2026-02-10 |
| Truist Securities | Maintain | Hold | 2026-02-10 |
| Cantor Fitzgerald | Maintain | Neutral | 2026-02-10 |
| Rosenblatt | Maintain | Neutral | 2026-02-10 |
| Piper Sandler | Maintain | Overweight | 2026-02-10 |
| Keybanc | Maintain | Overweight | 2026-02-10 |
| Mizuho | Maintain | Outperform | 2026-02-10 |
Which company has the best grades?
Texas Instruments shows a wider range of grades, including multiple Buy and Overweight ratings, while ON Semiconductor’s grades center around Neutral and Hold with some Overweight and one Outperform. Texas Instruments’ higher frequency of Buy ratings may indicate stronger analyst conviction, potentially influencing investor sentiment more positively.
Risks specific to each company
The following categories identify the critical pressure points and systemic threats facing Texas Instruments Incorporated and ON Semiconductor Corporation in the 2026 market environment:
1. Market & Competition
Texas Instruments Incorporated
- Dominates established analog and embedded segments with strong ROIC of 16.46%, but faces pricing pressure due to high P/E and P/B ratios.
ON Semiconductor Corporation
- Faces intense competition with low profitability; net margin at 2.02% signals weak pricing power and operational challenges.
2. Capital Structure & Debt
Texas Instruments Incorporated
- Debt-to-equity at 0.95 is moderate but flagged as neutral risk; interest coverage at 11.52 indicates comfortable debt servicing.
ON Semiconductor Corporation
- Lower leverage with debt-to-equity at 0.45, favorable balance sheet, but interest coverage of 2.85 shows tighter debt servicing capacity.
3. Stock Volatility
Texas Instruments Incorporated
- Beta near 1 (0.995) reflects market-level volatility, supporting predictable risk profile.
ON Semiconductor Corporation
- Higher beta at 1.542 signals elevated stock volatility and greater sensitivity to market swings.
4. Regulatory & Legal
Texas Instruments Incorporated
- Operates globally with exposure to semiconductor export controls and IP regulations; diversified end markets mitigate concentrated regulatory risk.
ON Semiconductor Corporation
- Similar global exposure but more dependent on automotive electrification trends, increasing sensitivity to evolving environmental and safety standards.
5. Supply Chain & Operations
Texas Instruments Incorporated
- Benefits from integrated manufacturing and long-term supplier relationships; asset turnover of 0.51 is stable but could improve.
ON Semiconductor Corporation
- Higher fixed asset turnover at 1.77 reflects efficient use but lower overall asset turnover (0.48) and operational scale raise supply chain risks.
6. ESG & Climate Transition
Texas Instruments Incorporated
- Strong dividend yield (3.17%) suggests financial resilience to ESG investments; embedded products support energy efficiency trends.
ON Semiconductor Corporation
- Positioned in power solutions for EVs and solar, but low profitability questions ability to fund ESG transition.
7. Geopolitical Exposure
Texas Instruments Incorporated
- US-based with global sales; geopolitical tensions in Asia-Pacific could impact supply but diversified customer base limits exposure.
ON Semiconductor Corporation
- Similar geopolitical risks heightened by reliance on automotive markets and emerging tech sectors vulnerable to trade disruptions.
Which company shows a better risk-adjusted profile?
Texas Instruments faces its greatest risk in valuation stretched by high multiples and moderate leverage, but boasts superior profitability and financial stability. ON Semiconductor’s main risk lies in low profitability and elevated stock volatility, amplified by tighter debt servicing. TI’s Altman Z-score of 10.27 and Piotroski score of 7 confirm a stronger financial footing versus ON’s lower scores. Thus, TI presents a markedly better risk-adjusted profile in 2026.
Final Verdict: Which stock to choose?
Texas Instruments Incorporated’s superpower lies in its robust capital efficiency and consistent value creation. It commands a strong economic moat with a solid return on invested capital well above its cost of capital. A point of vigilance is its declining ROIC trend, signaling caution for long-term profitability. TXN suits portfolios seeking steady, slightly favorable growth with a strong cash generation profile.
ON Semiconductor Corporation benefits from a strategic moat centered on operational improvements and recent price momentum. Its lower debt levels and manageable capital expenditures offer relative financial safety compared to TXN. However, it struggles with profitability and value creation, indicating riskier fundamentals. ON fits portfolios favoring speculative recovery plays or turnaround scenarios, with an eye on potential upside and volatility.
If you prioritize durable economic moats and consistent capital returns, Texas Instruments outshines due to its strong value creation despite some margin pressure. However, if you seek higher risk-adjusted volatility with possible rebound potential, ON Semiconductor offers better stability in leverage and cash flow dynamics but with weaker profitability metrics. Each stock appeals to distinct investor profiles balancing growth and risk tolerance.
Disclaimer: Investment carries a risk of loss of initial capital. The past performance is not a reliable indicator of future results. Be sure to understand risks before making an investment decision.
Go Further
I encourage you to read the complete analyses of Texas Instruments Incorporated and ON Semiconductor Corporation to enhance your investment decisions: