Home > Comparison > Technology > TER vs ON
The strategic rivalry between Teradyne, Inc. and ON Semiconductor Corporation shapes the semiconductor industry’s future. Teradyne excels as a capital-intensive provider of automated test equipment and industrial automation solutions. ON Semiconductor leads with intelligent sensing and power solutions, focusing on electrification and energy efficiency. This analysis pits Teradyne’s manufacturing precision against ON’s innovation in power technology to unveil which growth path offers superior risk-adjusted returns for diversified portfolios.
Table of contents
Companies Overview
Teradyne and ON Semiconductor shape critical segments of the semiconductor industry with distinct strategic focuses.
Teradyne, Inc.: Precision in Automated Testing
Teradyne dominates the automatic test equipment market, generating revenue through testing solutions for semiconductors and wireless devices. Its 2026 strategy emphasizes expanding industrial automation and wireless test platforms, serving diverse sectors like automotive, consumer electronics, and cloud computing. Teradyne’s competitive edge lies in its advanced test systems tailored for integrated device manufacturers and fabless companies.
ON Semiconductor Corporation: Powering Intelligent Sensing
ON Semiconductor leads in intelligent sensing and power solutions, focusing on electrification in automotive and sustainable energy markets. It drives revenue through analog and integrated semiconductors enabling power conversion and signal processing. In 2026, ON prioritizes innovations in electric vehicle components, fast-charging infrastructure, and image sensors, targeting broad applications from automotive to industrial energy solutions.
Strategic Collision: Similarities & Divergences
Teradyne and ON Semiconductor share a commitment to semiconductor innovation but diverge sharply in business philosophy. Teradyne offers a closed ecosystem of test equipment and automation, while ON embraces an open infrastructure approach in power and sensing devices. Their competition centers on automotive and industrial technology markets. Investors face distinct profiles: Teradyne’s niche precision tools versus ON’s broad-based power and sensing solutions.
Income Statement Comparison
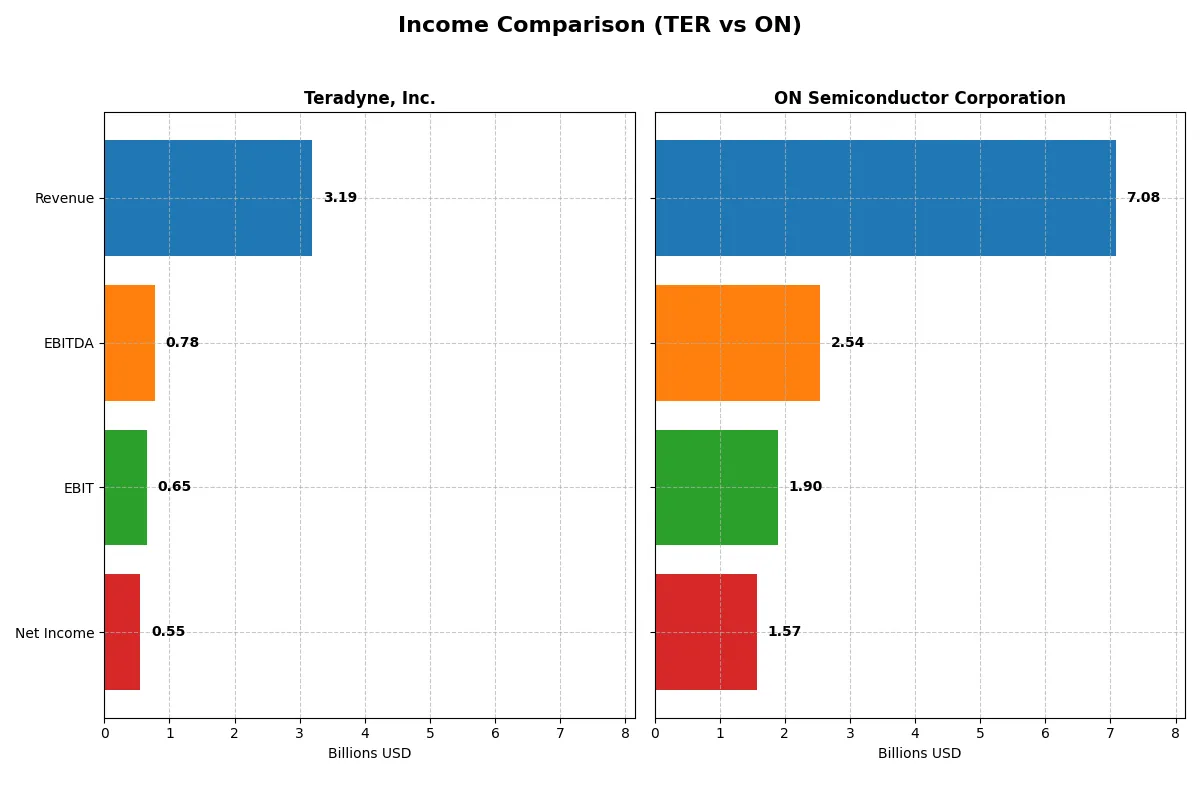
This data dissects the core profitability and scalability of both corporate engines to reveal who dominates the bottom line:
| Metric | Teradyne, Inc. (TER) | ON Semiconductor Corporation (ON) |
|---|---|---|
| Revenue | 3.19B | 7.08B |
| Cost of Revenue | 1.32B | 3.87B |
| Operating Expenses | 1.17B | 1.45B |
| Gross Profit | 1.87B | 3.22B |
| EBITDA | 780M | 2.54B |
| EBIT | 653M | 1.90B |
| Interest Expense | 8.0M | 62.3M |
| Net Income | 554M | 1.57B |
| EPS | 3.49 | 3.68 |
| Fiscal Year | 2025 | 2024 |
Income Statement Analysis: The Bottom-Line Duel
This income statement comparison reveals the true operational efficiency and profitability trends of Teradyne, Inc. and ON Semiconductor Corporation.
Teradyne, Inc. Analysis
Teradyne’s revenue rose from $2.7B in 2023 to $3.2B in 2025, showing momentum despite a dip from 2021’s peak. Gross margin remains robust near 58.5%, while net margin holds at 17.4%. Despite a 13% revenue growth last year, net income dipped slightly, reflecting pressure on margins and cautious expense control.
ON Semiconductor Corporation Analysis
ON Semiconductor’s revenue declined 14% from $8.3B in 2023 to $7.1B in 2024, yet it sustains a higher net margin at 22.2%. The company’s EBIT margin at 26.8% signals strong operational leverage despite recent headwinds. Over the 2020-2024 period, ON’s net income and EPS surged over 500%, showing impressive long-term growth.
Margin Resilience vs. Earnings Expansion
Teradyne demonstrates healthier margins and recent revenue growth, but its net income trend shows softness. ON Semiconductor excels in expanding net income and EPS over the medium term, despite short-term revenue contraction. ON’s profile suits investors prioritizing earnings growth, while Teradyne appeals to those valuing margin stability.
Financial Ratios Comparison
These vital ratios serve as a diagnostic tool to expose underlying fiscal health, valuation premiums, and capital efficiency of the companies compared below:
| Ratios | Teradyne, Inc. (TER) | ON Semiconductor Corporation (ON) |
|---|---|---|
| ROE | 19.8% | 17.9% |
| ROIC | 18.4% | 11.9% |
| P/E | 54.6x | 17.1x |
| P/B | 10.8x | 3.1x |
| Current Ratio | 1.76 | 5.06 |
| Quick Ratio | 1.41 | 3.38 |
| D/E (Debt-to-Equity) | 0.12 | 0.38 |
| Debt-to-Assets | 8.3% | 23.9% |
| Interest Coverage | 86.4x | 28.4x |
| Asset Turnover | 0.76 | 0.50 |
| Fixed Asset Turnover | 4.99 | 1.61 |
| Payout ratio | 13.8% | 0% |
| Dividend yield | 0.25% | 0% |
| Fiscal Year | 2025 | 2024 |
Efficiency & Valuation Duel: The Vital Signs
Financial ratios act as a company’s DNA, revealing hidden risks and operational excellence beyond surface numbers.
Teradyne, Inc.
Teradyne delivers robust profitability with a 19.8% ROE and 17.4% net margin, showcasing operational strength. However, its steep valuation at a 54.6 P/E and 10.8 P/B signals stretched stock pricing. Shareholders see minimal dividend yield (0.25%), reflecting a reinvestment focus on R&D and growth initiatives.
ON Semiconductor Corporation
ON Semiconductor posts a solid 17.9% ROE and even higher 22.2% net margin, indicating efficient profit generation. The valuation is moderate at a 17.1 P/E but a lower 3.1 P/B, suggesting reasonable pricing. It pays no dividend, prioritizing capital allocation towards growth and operational expansion.
Premium Valuation vs. Operational Safety
Teradyne’s higher profitability comes with expensive multiples, posing valuation risk. ON offers a more balanced valuation with strong margins, providing a safer risk-reward profile. Investors favoring growth at a premium may prefer Teradyne, while those seeking operational safety might lean towards ON.
Which one offers the Superior Shareholder Reward?
Teradyne, Inc. (TER) pays a modest dividend yield around 0.38% with a sustainable payout ratio near 14%, backed by strong free cash flow coverage above 2.4x. It also executes steady buybacks, enhancing total shareholder return. ON Semiconductor (ON) pays no dividends but invests heavily in growth, showing zero payout and moderate free cash flow conversion of about 64%. ON’s buyback intensity is lower, reflecting a reinvestment focus rather than cash return. Historically, TER’s balanced dividend and buyback strategy offers more reliable income and capital return. I conclude TER provides a superior total return profile in 2026 for income-oriented and risk-conscious investors.
Comparative Score Analysis: The Strategic Profile
The radar chart reveals the fundamental DNA and trade-offs of Teradyne, Inc. and ON Semiconductor Corporation, highlighting their core financial strengths and weaknesses:
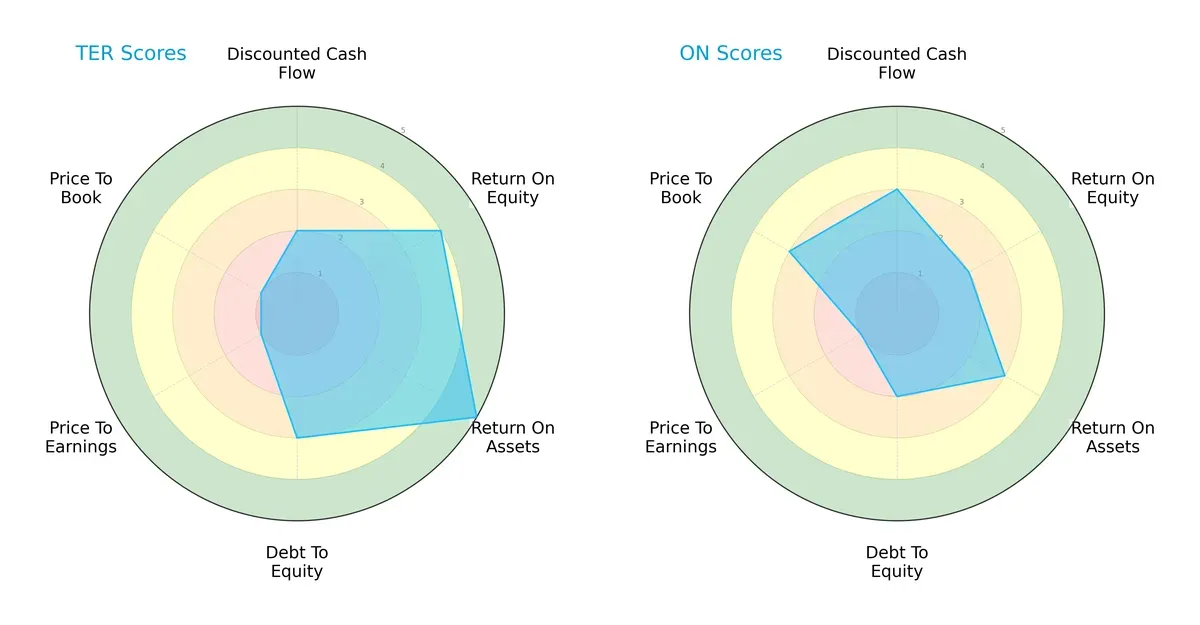
Teradyne shows superior operational efficiency with higher ROE (4 vs. 2) and ROA (5 vs. 3) scores, reflecting stronger asset utilization and profitability. ON leads slightly in discounted cash flow (3 vs. 2) and price-to-book valuation (3 vs. 1), suggesting better cash flow projections and relative market valuation. Both struggle with price-to-earnings (score 1) indicating valuation concerns. Teradyne’s balanced profile contrasts with ON’s reliance on valuation metrics, favoring operational strength over market sentiment.
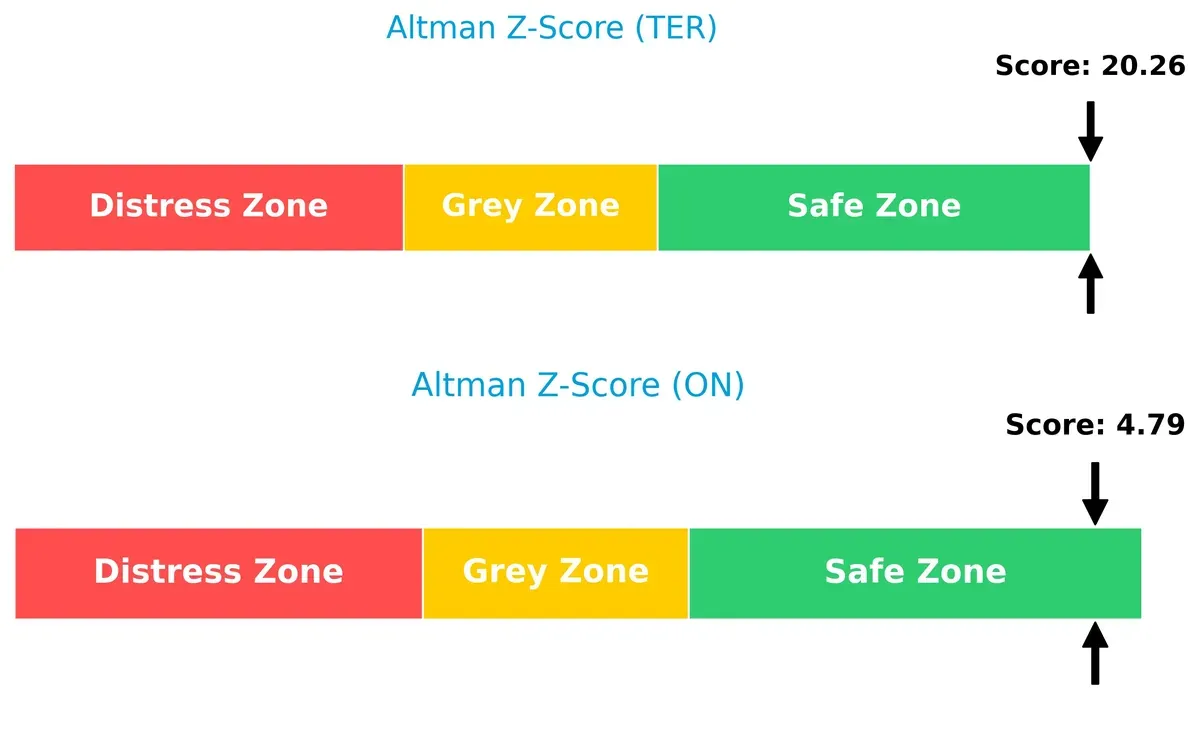
Bankruptcy Risk: Solvency Showdown
Teradyne’s Altman Z-Score of 20.3 vastly exceeds ON’s 4.8, signaling exceptional solvency and negligible bankruptcy risk for both but a much wider safety margin for Teradyne in this cycle:
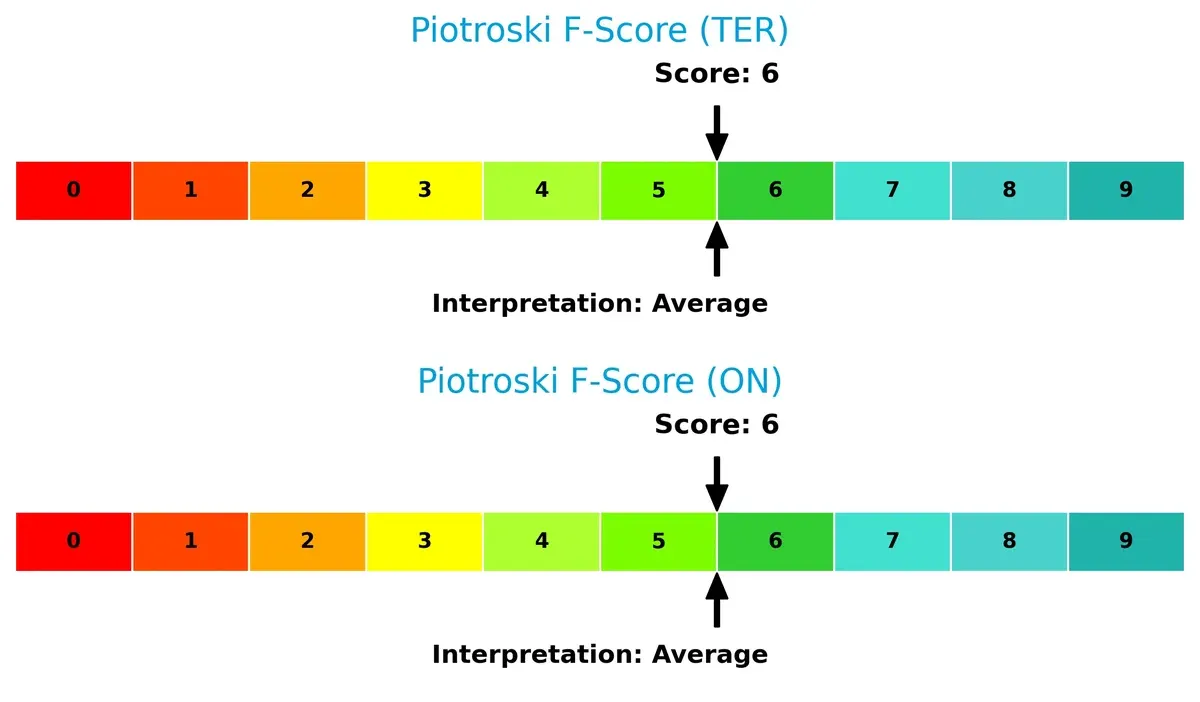
Financial Health: Quality of Operations
Both companies score a 6 on the Piotroski F-Score, indicating average financial health. Neither shows critical red flags, but neither demonstrates peak operational quality either:
How are the two companies positioned?
This section dissects the operational DNA of Teradyne and ON Semiconductor by comparing their revenue distribution and internal dynamics. The goal is to confront their economic moats to reveal which business model offers the most resilient competitive advantage today.
Revenue Segmentation: The Strategic Mix
The following visual comparison dissects how Teradyne, Inc. and ON Semiconductor Corporation diversify their income streams and where their primary sector bets lie:
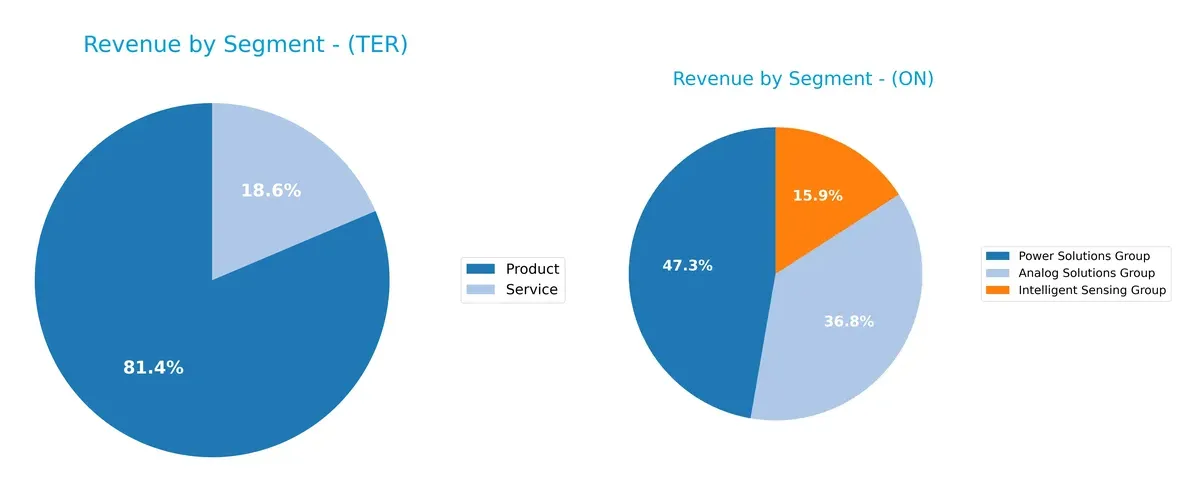
Teradyne anchors its revenue heavily on Product sales, with $2.3B in 2024, complemented by $525M from Services, reflecting a concentrated but stable mix. ON Semiconductor displays a broader spread: Power Solutions leads with $3.35B, followed by Analog Solutions at $2.61B and Intelligent Sensing at $1.13B. ON’s diversified portfolio reduces concentration risk, while Teradyne’s dominance in Products suggests reliance on hardware innovation and aftermarket services.
Strengths and Weaknesses Comparison
This table compares the strengths and weaknesses of Teradyne, Inc. and ON Semiconductor Corporation based on key financial and market factors:
Teradyne Strengths
- Favorable net margin and ROIC indicating strong profitability
- Low debt to assets and high interest coverage reflect solid financial health
- Diverse product and service revenue streams support market resilience
- Global presence across key Asian and US markets
- High fixed asset turnover shows efficient asset use
ON Semiconductor Strengths
- Highest net margin among peers signals superior profitability
- Favorable debt ratios with good interest coverage
- Broad product segmentation including power and analog solutions
- Strong global revenue in Hong Kong, Singapore, UK, and US
- Balanced ROE supports shareholder returns
Teradyne Weaknesses
- Elevated PE and PB ratios may signal overvaluation risks
- WACC exceeds ROIC, suggesting capital efficiency concerns
- Modest dividend yield could deter income-focused investors
- Neutral asset turnover hints at moderate operational efficiency
ON Semiconductor Weaknesses
- Unfavorable current ratio indicates potential liquidity constraints
- WACC higher than ROIC may impair capital returns
- Zero dividend yield limits income appeal
- PB ratio is unfavorable, possibly reflecting market skepticism
Teradyne exhibits robust profitability and financial stability but faces valuation and capital cost challenges. ON Semiconductor delivers strong margins and global reach but must address liquidity and capital efficiency to enhance resilience.
The Moat Duel: Analyzing Competitive Defensibility
A structural moat is the only thing protecting long-term profits from relentless competition erosion. Let’s dissect these firms’ moats:
Teradyne, Inc.: Niche Technology & Switching Costs
Teradyne’s moat stems from specialized automatic test equipment and high switching costs embedded in semiconductor manufacturing. Its 6.1% ROIC above WACC signals value creation despite a declining ROIC trend. New automation and wireless test products could deepen defensibility but require vigilance amid tech shifts in 2026.
ON Semiconductor Corporation: Scale & Operational Efficiency
ON Semiconductor relies on scale-driven cost advantages and growing ROIC momentum, unlike Teradyne’s legacy tech moat. Despite currently shedding value (ROIC barely above WACC), rapid ROIC growth reflects improving capital efficiency. Expansion in electric vehicle power solutions offers promising disruption potential.
Verdict: Specialized Switching Costs vs. Scaling Cost Leadership
Teradyne’s deeper moat from entrenched switching costs beats ON’s emerging but thinner moat based on scale and operational gains. Teradyne is better positioned to defend market share through complex, high-barrier products, while ON must sustain ROIC growth to solidify its competitive edge.
Which stock offers better returns?
Stock price trends over the past year reveal Teradyne’s strong bullish momentum versus ON Semiconductor’s bearish trajectory, underscored by distinct price swings and trading volume dynamics.
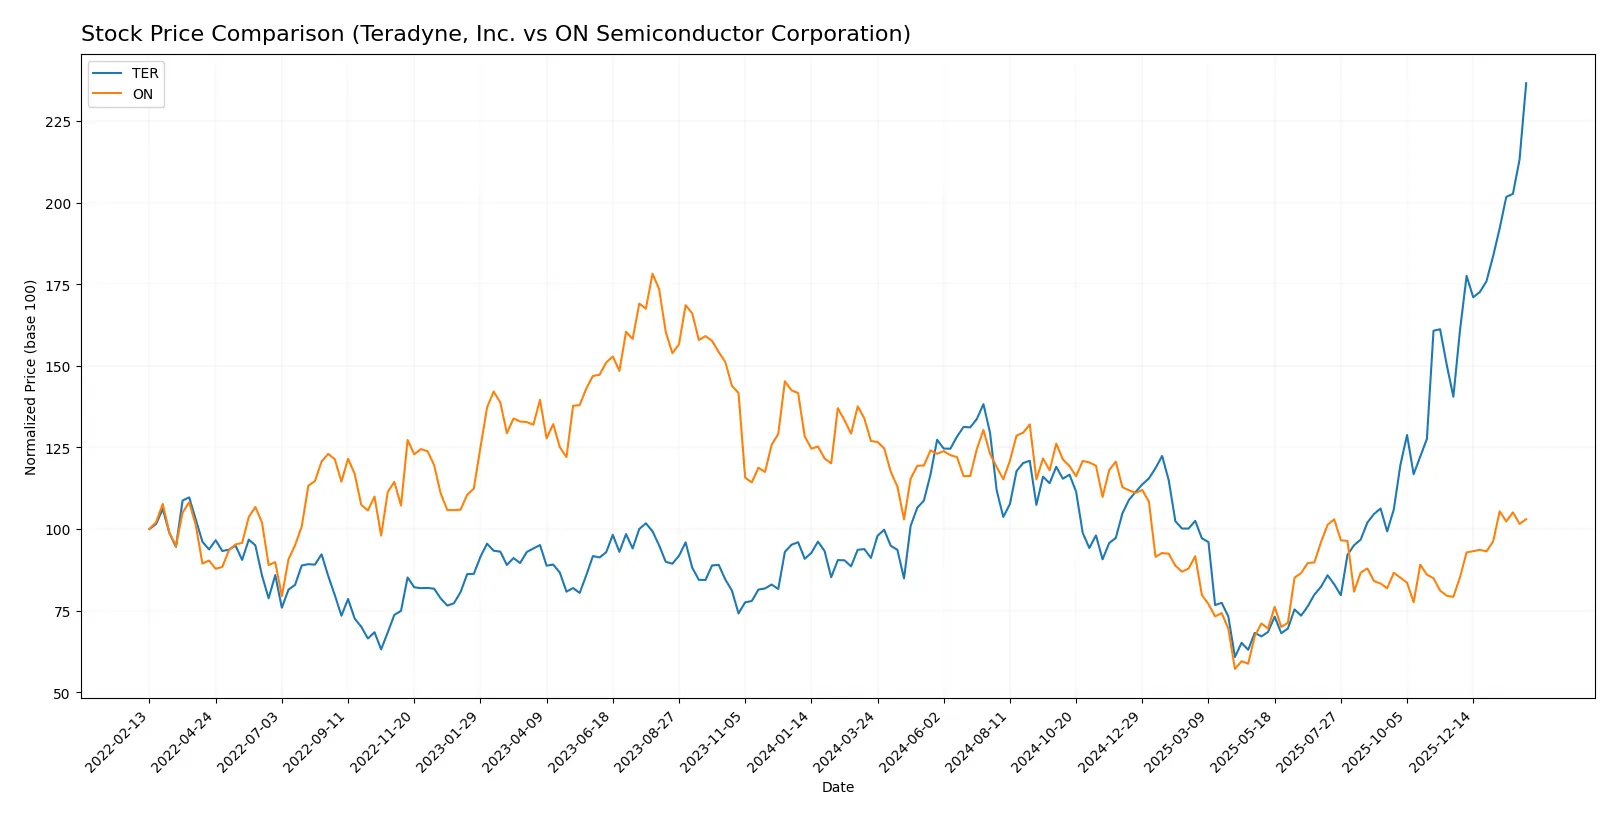
Trend Comparison
Teradyne’s stock surged 160% over the last 12 months, showing bullish acceleration. Its price ranged from 69 to 268, with volatility at a high 39.14 standard deviation. Recent gains remain robust at 68%.
ON Semiconductor’s stock fell 18.9% over the same period, marking a bearish trend despite accelerating decline. Price moved between 34 and 78 with lower volatility at 11.49. The recent quarter shows a modest 30% rebound.
Teradyne outperformed ON Semiconductor by a wide margin, delivering significantly higher returns and stronger upward momentum throughout the year.
Target Prices
Analysts show a cautiously optimistic consensus for Teradyne, Inc. and ON Semiconductor Corporation.
| Company | Target Low | Target High | Consensus |
|---|---|---|---|
| Teradyne, Inc. | 175 | 335 | 276.08 |
| ON Semiconductor Corporation | 51 | 64 | 59.25 |
Teradyne’s target consensus sits about 3.5% above its current price of $266.48, signaling modest upside. ON Semiconductor’s consensus aligns closely with its $60.56 market price, suggesting a balanced outlook.

Don’t Let Luck Decide Your Entry Point
Optimize your entry points with our advanced ProRealTime indicators. You’ll get efficient buy signals with precise price targets for maximum performance. Start outperforming now!
How do institutions grade them?
Teradyne, Inc. Grades
The following table summarizes recent institutional grades for Teradyne, Inc.:
| Grading Company | Action | New Grade | Date |
|---|---|---|---|
| Evercore ISI Group | Maintain | Outperform | 2026-02-04 |
| Cantor Fitzgerald | Maintain | Overweight | 2026-02-04 |
| Stifel | Maintain | Buy | 2026-02-04 |
| Evercore ISI Group | Maintain | Outperform | 2026-02-03 |
| Cantor Fitzgerald | Maintain | Overweight | 2026-02-02 |
| Stifel | Maintain | Buy | 2026-01-30 |
| UBS | Maintain | Buy | 2026-01-26 |
| B of A Securities | Maintain | Buy | 2026-01-22 |
| Stifel | Maintain | Buy | 2026-01-14 |
| B of A Securities | Maintain | Buy | 2026-01-13 |
ON Semiconductor Corporation Grades
The following table summarizes recent institutional grades for ON Semiconductor Corporation:
| Grading Company | Action | New Grade | Date |
|---|---|---|---|
| B of A Securities | Maintain | Neutral | 2026-01-21 |
| B. Riley Securities | Maintain | Neutral | 2026-01-20 |
| Stifel | Maintain | Hold | 2026-01-16 |
| Citigroup | Maintain | Neutral | 2026-01-15 |
| Wells Fargo | Maintain | Overweight | 2026-01-15 |
| Piper Sandler | Maintain | Overweight | 2026-01-07 |
| Truist Securities | Maintain | Hold | 2025-12-19 |
| Morgan Stanley | Maintain | Equal Weight | 2025-11-24 |
| Truist Securities | Maintain | Hold | 2025-11-04 |
| Morgan Stanley | Maintain | Equal Weight | 2025-11-04 |
Which company has the best grades?
Teradyne, Inc. consistently receives stronger grades, mostly “Buy” or “Outperform,” compared to ON Semiconductor’s more neutral or mixed ratings. Investors may view Teradyne’s grades as a signal of higher confidence from analysts, potentially influencing portfolio decisions.
Risks specific to each company
The following categories identify critical pressure points and systemic threats facing Teradyne, Inc. and ON Semiconductor Corporation in the 2026 market environment:
1. Market & Competition
Teradyne, Inc.
- Faces intense competition in semiconductor test equipment and industrial automation, requiring constant innovation to maintain market share.
ON Semiconductor Corporation
- Competes heavily in power and sensing semiconductors, capitalizing on automotive electrification but facing aggressive rivals in analog and mixed-signal segments.
2. Capital Structure & Debt
Teradyne, Inc.
- Maintains a conservative debt level (D/E 0.12) with strong interest coverage (81.43), minimizing financial risk.
ON Semiconductor Corporation
- Higher leverage (D/E 0.38) and moderate interest coverage (30.49) increase vulnerability during tightening credit conditions.
3. Stock Volatility
Teradyne, Inc.
- Higher beta (1.82) suggests greater sensitivity to market swings and cyclical semiconductor demand.
ON Semiconductor Corporation
- Lower beta (1.54) indicates relatively less volatility but still exposed to semiconductor sector fluctuations.
4. Regulatory & Legal
Teradyne, Inc.
- Subject to export controls on test equipment and industrial robotics, with risks from changing trade policies.
ON Semiconductor Corporation
- Faces regulatory scrutiny on supply chain transparency and product compliance, especially in automotive and energy sectors.
5. Supply Chain & Operations
Teradyne, Inc.
- Relies on foundries and subcontractors, exposed to semiconductor supply constraints and component shortages.
ON Semiconductor Corporation
- Vertically integrated with foundry services but vulnerable to raw material price volatility and logistics disruptions.
6. ESG & Climate Transition
Teradyne, Inc.
- Growing focus on sustainable industrial automation and reducing carbon footprint in manufacturing processes.
ON Semiconductor Corporation
- Positioned well with power-efficient semiconductor solutions supporting electric vehicles and renewable energy infrastructure.
7. Geopolitical Exposure
Teradyne, Inc.
- Moderate exposure to US-China tensions affecting semiconductor equipment exports.
ON Semiconductor Corporation
- Higher risk from geopolitical instability in Asia-Pacific regions critical to semiconductor manufacturing and supply chains.
Which company shows a better risk-adjusted profile?
Teradyne’s strongest risk is market volatility, intensified by its high beta and premium valuation metrics. ON Semiconductor’s primary concern is its elevated leverage and operational sensitivity to supply chain shocks. Teradyne’s conservative debt and robust interest coverage provide a safer balance sheet cushion. Despite its greater volatility, Teradyne exhibits a superior risk-adjusted profile, supported by a very strong Altman Z-score (20.26) indicating excellent financial health. ON’s leverage and supply chain dependencies warrant caution, despite favorable positioning in automotive electrification trends.
Final Verdict: Which stock to choose?
Teradyne, Inc. (TER) stands out as a cash machine with strong capital efficiency and a solid balance sheet. Its ability to generate returns well above its cost of capital highlights a robust economic moat. A point of vigilance remains its high valuation multiples, which could pressure future returns. TER suits portfolios targeting aggressive growth with a tolerance for premium pricing.
ON Semiconductor Corporation (ON) leverages a strategic moat rooted in improving profitability and expanding its asset base, signaling growing operational strength. While it currently sheds value relative to its cost of capital, its improving ROIC trend offers a safety cushion compared to TER’s premium risk profile. ON fits well within GARP portfolios seeking growth balanced with reasonable valuation.
If you prioritize capital efficiency and can accept valuation premiums, TER is the compelling choice due to its strong moat and cash generation. However, if you seek improving profitability with better valuation discipline and stability, ON offers a more balanced risk-return profile for cautious growth investors.
Disclaimer: Investment carries a risk of loss of initial capital. The past performance is not a reliable indicator of future results. Be sure to understand risks before making an investment decision.
Go Further
I encourage you to read the complete analyses of Teradyne, Inc. and ON Semiconductor Corporation to enhance your investment decisions: