Home > Comparison > Technology > ON vs STM
The strategic rivalry between ON Semiconductor Corporation and STMicroelectronics N.V. shapes the semiconductor industry’s future. ON operates as a focused provider of intelligent power and sensing solutions, emphasizing automotive electrification. In contrast, STMicroelectronics exemplifies a diversified semiconductor giant spanning automotive, industrial, and digital IC markets. This analysis pits ON’s specialized growth against ST’s broad market reach to identify which trajectory offers superior risk-adjusted returns for diversified portfolios.
Table of contents
Companies Overview
ON Semiconductor and STMicroelectronics stand as pivotal players shaping the global semiconductor landscape in 2026.
ON Semiconductor: Powering Intelligent Sensing and Electrification
ON Semiconductor dominates as a provider of intelligent power solutions focused on electrifying automotive and sustainable energy markets. Its core revenue stems from analog, mixed-signal, and power semiconductors that enable electric vehicles, fast charging, and industrial power systems. In 2026, ON’s strategic focus sharpens on advancing power technologies to support lighter, longer-range electric vehicles and sustainable energy infrastructure.
STMicroelectronics: Diverse Semiconductor Innovator
STMicroelectronics commands a broad footprint as a designer and manufacturer of diverse semiconductor products across automotive, industrial, and consumer markets. It generates revenue through integrated circuits, MEMS sensors, microcontrollers, and digital ICs. The company’s 2026 strategy emphasizes innovation in automotive ICs, analog and sensor technologies, and microcontrollers to meet growing demand in connected and electrified devices worldwide.
Strategic Collision: Similarities & Divergences
Both companies compete fiercely in the automotive semiconductor space but diverge in scope and approach. ON focuses on power-efficient, application-specific solutions for electrification and sustainable energy. STMicroelectronics pursues a broader product portfolio spanning analog, MEMS, and digital ICs with a global manufacturing footprint. Their distinct investment profiles reflect ON’s specialization in power technologies versus ST’s diversified semiconductor ecosystem.
Income Statement Comparison
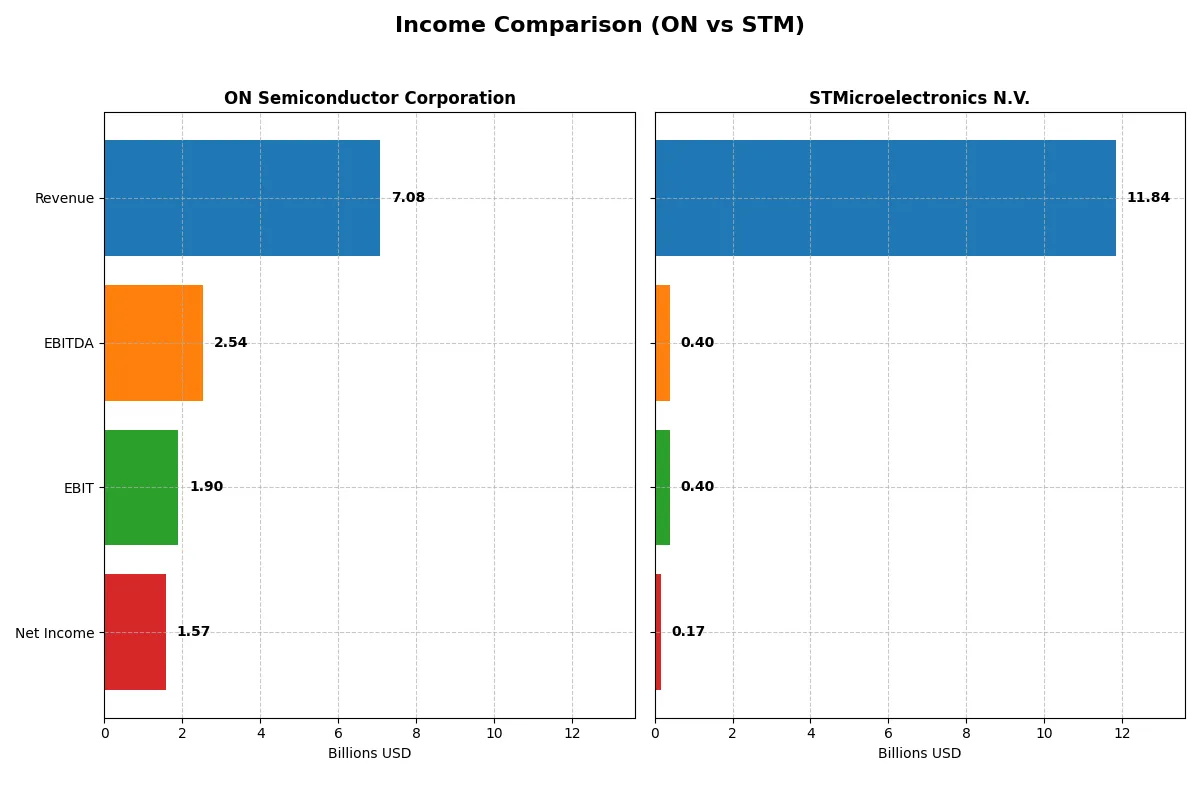
The following data dissects the core profitability and scalability of both corporate engines to reveal who dominates the bottom line:
| Metric | ON Semiconductor Corporation (ON) | STMicroelectronics N.V. (STM) |
|---|---|---|
| Revenue | 7.08B | 13.27B |
| Cost of Revenue | 3.87B | 8.05B |
| Operating Expenses | 1.45B | 3.54B |
| Gross Profit | 3.22B | 5.22B |
| EBITDA | 2.54B | 3.72B |
| EBIT | 1.90B | 1.96B |
| Interest Expense | 62M | 85M |
| Net Income | 1.57B | 1.56B |
| EPS | 3.68 | 1.73 |
| Fiscal Year | 2024 | 2024 |
Income Statement Analysis: The Bottom-Line Duel
This income statement comparison exposes each company’s operational efficiency and profitability under varying market conditions.
ON Semiconductor Corporation Analysis
ON Semiconductor’s revenue peaked at 8.25B in 2023 but declined to 7.08B in 2024, reflecting a 14% dip. Net income followed suit, dropping from 2.18B to 1.57B. Despite this, ON maintains strong margins with a 45.4% gross margin and a 22.2% net margin in 2024, signaling resilient profitability amid revenue pressure.
STMicroelectronics N.V. Analysis
STMicroelectronics reported 13.27B revenue in 2024, down 10.8% from 17.29B in 2023. Net income contracted drastically by 88%, from 4.21B to 0.16B, reflecting severe margin compression. Its gross margin stands at a moderate 33.9%, but net margin shrinks to 1.4%, highlighting strained operational efficiency in 2025.
Margin Strength vs. Revenue Contraction
ON Semiconductor leads with superior margin control and healthier net profits despite recent revenue declines. STMicroelectronics faces steeper revenue and net income declines, with margins eroding sharply. For investors prioritizing margin resilience and profitability, ON’s profile offers a clearer fundamental advantage.
Financial Ratios Comparison
These vital ratios act as a diagnostic tool to expose the underlying fiscal health, valuation premiums, and capital efficiency of the companies:
| Ratios | ON Semiconductor Corporation (ON) | STMicroelectronics N.V. (STM) |
|---|---|---|
| ROE | 17.9% (2024) | 8.9% (2024) |
| ROIC | 11.9% (2024) | 6.3% (2024) |
| P/E | 17.1 (2024) | 14.4 (2024) |
| P/B | 3.1 (2024) | 1.3 (2024) |
| Current Ratio | 5.1 (2024) | 3.1 (2024) |
| Quick Ratio | 3.4 (2024) | 2.4 (2024) |
| D/E | 0.38 (2024) | 0.18 (2024) |
| Debt-to-Assets | 24.0% (2024) | 12.8% (2024) |
| Interest Coverage | 28.4 (2024) | 19.7 (2024) |
| Asset Turnover | 0.50 (2024) | 0.54 (2024) |
| Fixed Asset Turnover | 1.61 (2024) | 1.22 (2024) |
| Payout ratio | 0% (2024) | 18.5% (2024) |
| Dividend yield | 0% (2024) | 1.28% (2024) |
| Fiscal Year | 2024 | 2024 |
Efficiency & Valuation Duel: The Vital Signs
Financial ratios act as the company’s DNA, uncovering hidden risks and highlighting operational excellence essential for investment decisions.
ON Semiconductor Corporation
ON Semiconductor displays a favorable ROE of 17.88% and a solid net margin of 22.21%, signaling strong profitability. Its P/E ratio of 17.13 indicates a fairly valued stock, though a high P/B of 3.06 and elevated current ratio suggest stretched valuation and liquidity. The company reinvests in growth, paying no dividends.
STMicroelectronics N.V.
STMicroelectronics suffers from weak profitability, with a 0.93% ROE and 1.41% net margin, reflecting operational challenges. Despite favorable valuation metrics like zero P/E and P/B ratios, its asset turnover is low at 0.48, and the current ratio signals liquidity concerns. The firm does not pay dividends, focusing on R&D instead.
Profitability Strength vs. Valuation Discipline
ON Semiconductor offers superior profitability and a balanced valuation, managing risks better than STMicroelectronics. STM’s neutral valuation masks weak returns and operational inefficiencies. Investors seeking growth with operational safety may prefer ON, while STM fits those tolerating risk for potential turnaround.
Which one offers the Superior Shareholder Reward?
I compare ON Semiconductor and STMicroelectronics’ distribution strategies. ON pays no dividends but retains robust free cash flow (~$2.8/share in 2024) to fuel growth. STM offers a modest dividend yield (~1.28% in 2024) with a low payout ratio (~18%), supplemented by active buybacks. ON’s zero payout ratio contrasts with STM’s disciplined, sustainable dividend and buyback balance. STM’s cash flow support for dividends looks stretched with negative free cash flow in 2024, raising sustainability concerns. ON’s strong liquidity and reinvestment capacity signal greater long-term value creation. I conclude ON Semiconductor offers a superior total shareholder return profile in 2026 due to its healthier free cash flow and growth-focused capital allocation.
Comparative Score Analysis: The Strategic Profile
The radar chart reveals the fundamental DNA and trade-offs shaping ON Semiconductor and STMicroelectronics’ strategic profiles:
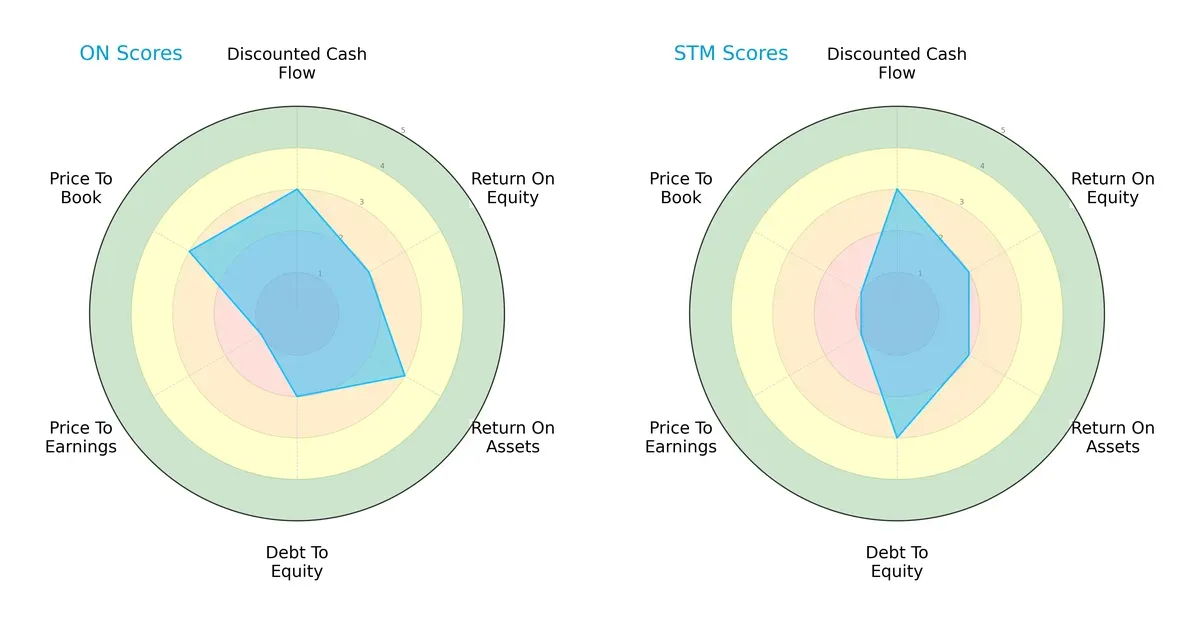
ON Semiconductor shows strength in return on assets and price-to-book valuation, suggesting efficient asset use and fair market pricing. STMicroelectronics excels in debt-to-equity management, indicating a more conservative capital structure. Both share moderate discounted cash flow and return on equity scores, but ON’s balanced profile contrasts with ST’s reliance on stronger leverage control.
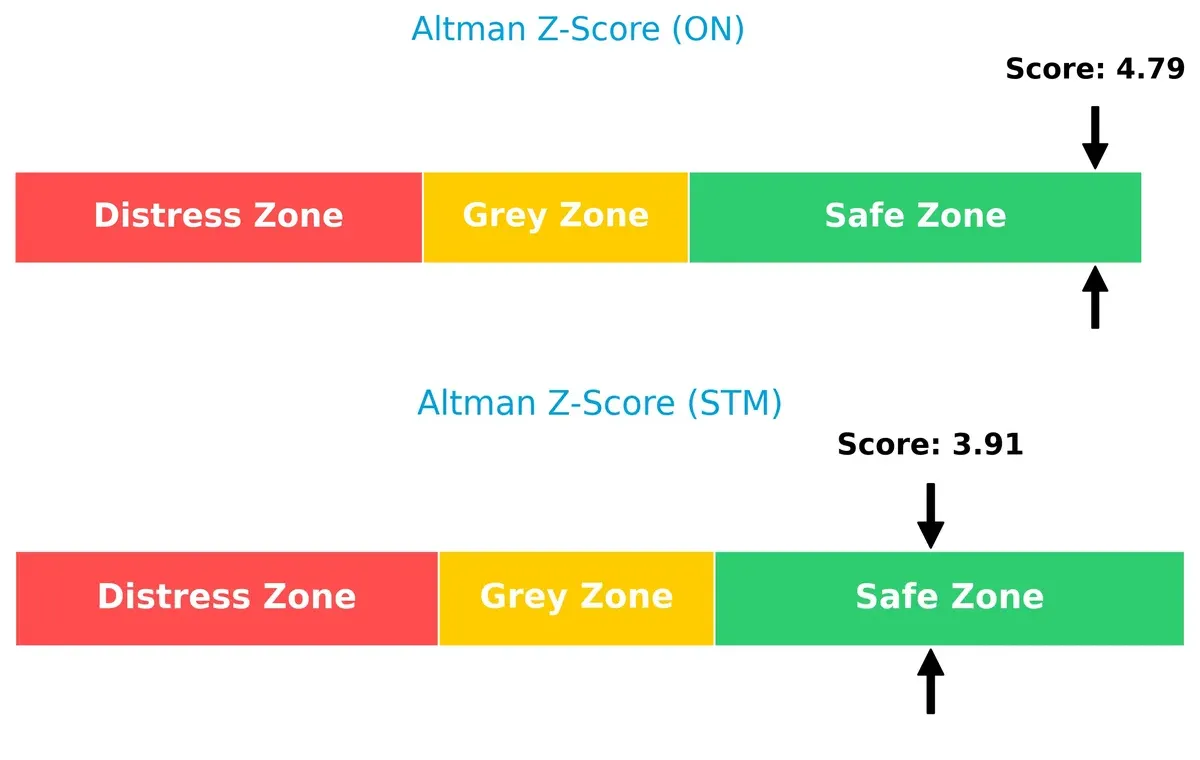
Bankruptcy Risk: Solvency Showdown
ON Semiconductor’s Altman Z-Score of 4.79 versus STMicroelectronics’ 3.91 signals both firms are in the safe zone, with ON holding a wider margin of financial safety in this current cycle:
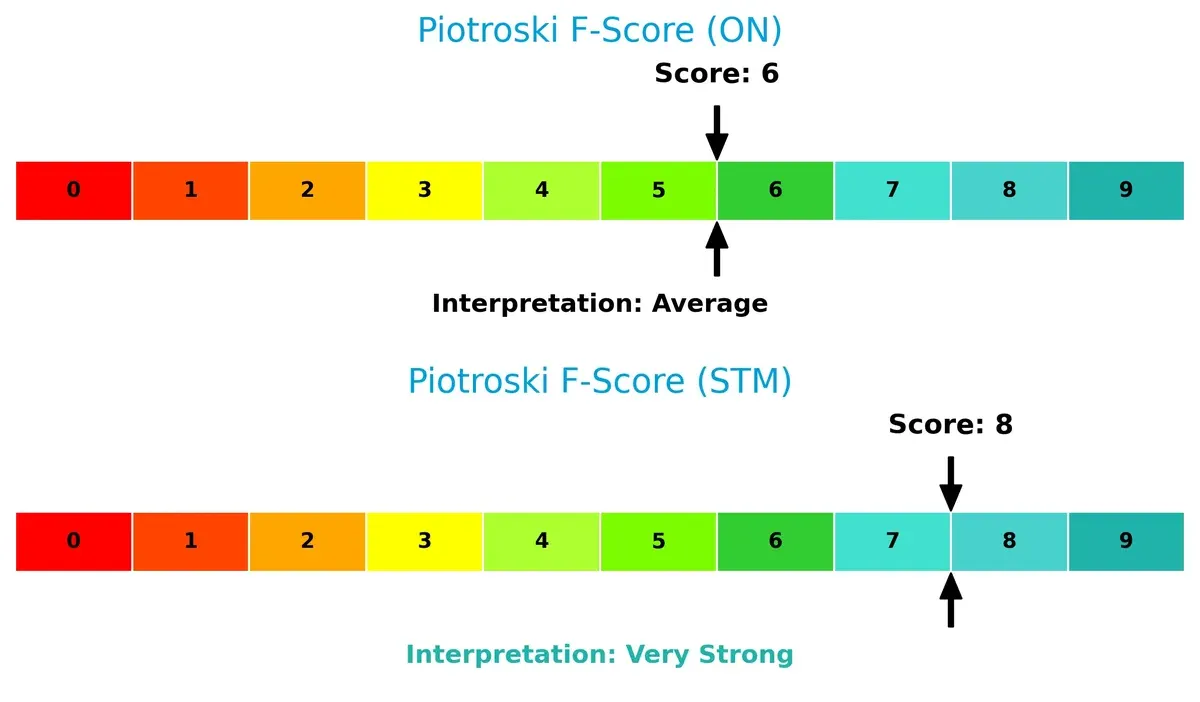
Financial Health: Quality of Operations
STMicroelectronics leads with a Piotroski F-Score of 8, reflecting very strong internal financial health. ON’s score of 6 is average, indicating some operational risks relative to its peer:
How are the two companies positioned?
This section dissects the operational DNA of ON and STM by comparing their revenue distribution and internal strengths and weaknesses. The goal is to confront their economic moats to reveal which model offers the most resilient competitive advantage today.
Revenue Segmentation: The Strategic Mix
This visual comparison dissects how ON Semiconductor Corporation and STMicroelectronics N.V. diversify their income streams and where their primary sector bets lie:
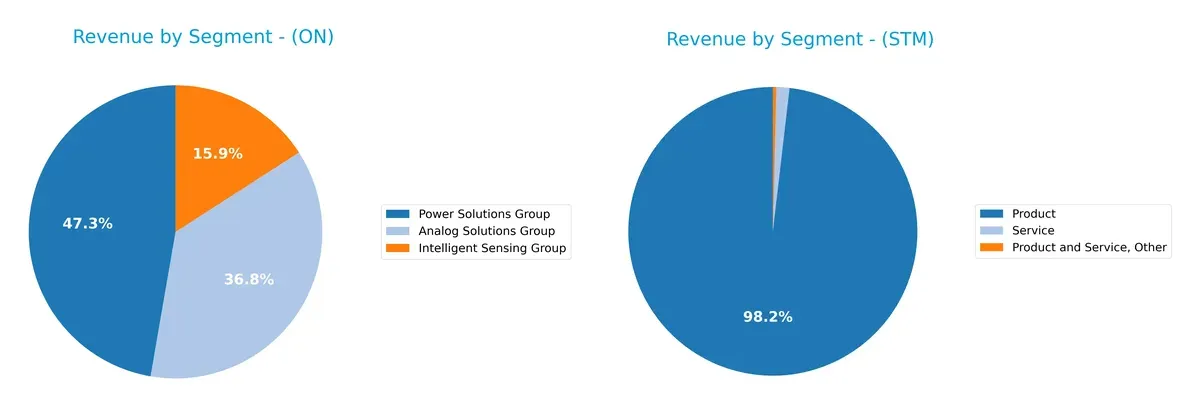
ON Semiconductor anchors its revenue in three core segments: Power Solutions ($3.35B), Analog Solutions ($2.61B), and Intelligent Sensing ($1.13B). This mix shows moderate diversification with a clear reliance on power electronics. STMicroelectronics, by contrast, heavily pivots on a single Product segment ($13.2B), dwarfing its smaller Service ($196M) and Other ($52M) revenues. ST’s concentration signals strong infrastructure dominance but raises concentration risk compared to ON’s broader ecosystem approach.
Strengths and Weaknesses Comparison
This table compares the Strengths and Weaknesses of ON Semiconductor and STMicroelectronics based on diversification, profitability, financial statements, innovation, global presence, and market share:
ON Strengths
- Diverse product groups with strong revenue in Power and Analog Solutions
- Favorable profitability metrics including 22% net margin and 18% ROE
- Solid leverage with low debt-to-assets at 24%
- Strong interest coverage ratio at 30x
- Broad geographic presence across Asia and Europe
- Consistent innovation in sensing and power segments
STM Strengths
- Favorable valuation multiples with zero PE and PB ratios
- Low leverage with 9% debt-to-assets
- Infinite interest coverage indicates minimal debt burden
- Significant revenue scale in Products at $13B
- Strong geographic revenue from Singapore and Switzerland
- Balanced presence in Americas, Asia, and EMEA regions
ON Weaknesses
- Unfavorable high current ratio at 5.06 may indicate inefficient asset use
- WACC above ROIC suggests suboptimal capital allocation
- Unfavorable PB ratio at 3.06 points to potential overvaluation
- Zero dividend yield limits income appeal
- Neutral asset turnover implies average operational efficiency
STM Weaknesses
- Very low profitability with net margin near 1.4% and ROE under 1%
- Neutral WACC at 9.54% but ROIC far below at 0.67%
- Unfavorable current ratio at 3.36 could signal liquidity concerns
- Asset turnover below ON at 0.48
- Zero dividend yield restricts shareholder returns
ON demonstrates superior profitability and diversified product lines supporting operational strength. STM’s valuation and capital structure offer stability but suffer from weak profitability and efficiency. These factors shape each company’s strategic focus on improving returns or leveraging financial health.
The Moat Duel: Analyzing Competitive Defensibility
A structural moat is the only true shield protecting long-term profits from relentless competitive pressures and market erosion:
ON Semiconductor Corporation: Emerging ROIC Growth Moat
ON Semiconductor’s moat stems from its cost advantage in power solutions, reflected in rising ROIC despite recent revenue dips. Its foothold in automotive electrification could deepen this lead in 2026.
STMicroelectronics N.V.: Struggling Profitability Amid Diverse Product Lines
STMicroelectronics relies on intangible assets and product breadth but suffers declining ROIC and margins. Its broad geographic reach contrasts ON’s focus but profitability erosion threatens its competitive position.
Cost Leadership Growth vs. Intangible Asset Decline
ON Semiconductor shows a slightly favorable moat with improving profitability and efficient capital use. STMicroelectronics’s weakening ROIC signals a very unfavorable moat. ON is better positioned to defend and grow market share in 2026.
Which stock offers better returns?
Over the past year, both ON Semiconductor Corporation and STMicroelectronics N.V. experienced significant price declines followed by strong recent rallies, reflecting volatile trading dynamics and accelerating trends.
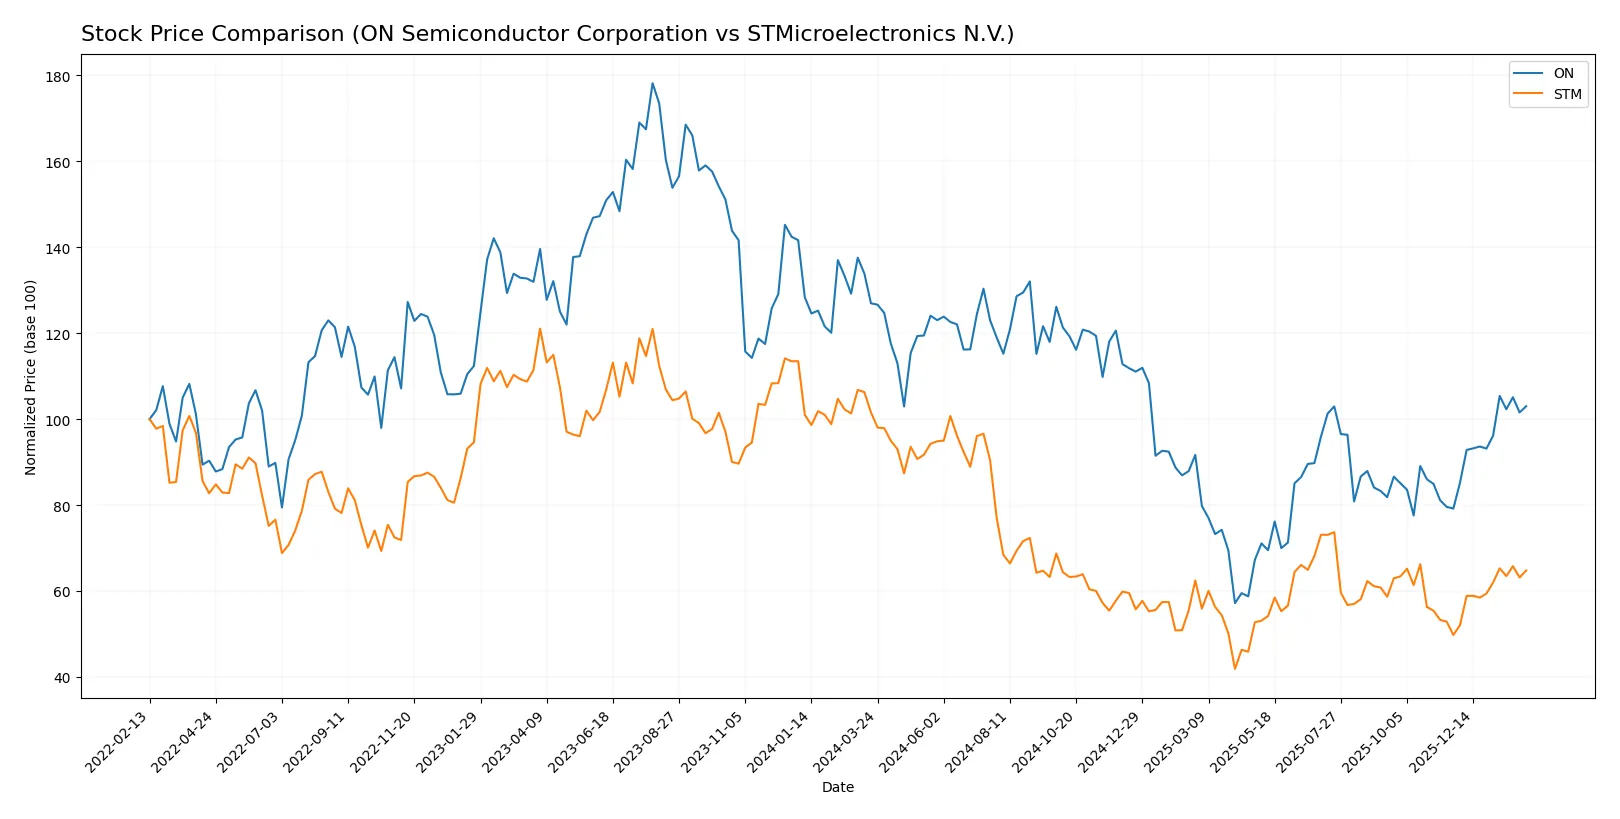
Trend Comparison
ON Semiconductor’s stock shows a bearish trend with an 18.87% decline over the past 12 months, accelerating downward with high volatility. The price ranged from a high of 77.87 to a low of 33.7.
STMicroelectronics also posts a bearish trend, with a sharper 36.22% drop over the same period. The decline accelerates amid moderate volatility, hitting a high of 44.85 and a low of 18.49.
Comparing recent trends, both stocks gained about 30% since late November 2025, with ON showing stronger buyer dominance and higher volatility. ON outperformed STM in market recovery pace.
Target Prices
Analysts present a mixed but cautiously optimistic consensus for ON Semiconductor Corporation and STMicroelectronics N.V.
| Company | Target Low | Target High | Consensus |
|---|---|---|---|
| ON Semiconductor Corporation | 51 | 64 | 59.25 |
| STMicroelectronics N.V. | 28 | 45 | 37.67 |
ON Semiconductor’s target consensus at 59.25 slightly undercuts its current price of 60.47, suggesting limited near-term upside. STMicroelectronics shows more upside potential, with a consensus well above its 28.58 market price.

Don’t Let Luck Decide Your Entry Point
Optimize your entry points with our advanced ProRealTime indicators. You’ll get efficient buy signals with precise price targets for maximum performance. Start outperforming now!
How do institutions grade them?
ON Semiconductor Corporation Grades
The latest grades for ON Semiconductor Corporation from major grading firms are:
| Grading Company | Action | New Grade | Date |
|---|---|---|---|
| B of A Securities | Maintain | Neutral | 2026-01-21 |
| B. Riley Securities | Maintain | Neutral | 2026-01-20 |
| Stifel | Maintain | Hold | 2026-01-16 |
| Citigroup | Maintain | Neutral | 2026-01-15 |
| Wells Fargo | Maintain | Overweight | 2026-01-15 |
| Piper Sandler | Maintain | Overweight | 2026-01-07 |
| Truist Securities | Maintain | Hold | 2025-12-19 |
| Morgan Stanley | Maintain | Equal Weight | 2025-11-24 |
| Truist Securities | Maintain | Hold | 2025-11-04 |
| Morgan Stanley | Maintain | Equal Weight | 2025-11-04 |
STMicroelectronics N.V. Grades
Recent institutional grades for STMicroelectronics N.V. are as follows:
| Grading Company | Action | New Grade | Date |
|---|---|---|---|
| TD Cowen | Maintain | Buy | 2025-10-24 |
| Susquehanna | Maintain | Positive | 2025-10-22 |
| Susquehanna | Maintain | Positive | 2025-07-25 |
| Baird | Upgrade | Outperform | 2025-07-22 |
| Susquehanna | Maintain | Positive | 2025-07-22 |
| Jefferies | Upgrade | Buy | 2025-02-19 |
| Bernstein | Downgrade | Market Perform | 2025-02-05 |
| Susquehanna | Maintain | Positive | 2025-01-31 |
| Barclays | Downgrade | Underweight | 2025-01-22 |
| JP Morgan | Downgrade | Neutral | 2024-12-09 |
Which company has the best grades?
STMicroelectronics N.V. generally holds stronger grades, including multiple “Buy” and “Outperform” ratings. ON Semiconductor mostly receives neutral or hold grades. Investors may perceive STM as having better growth potential based on institutional sentiment.
Risks specific to each company
The following categories identify critical pressure points and systemic threats facing ON Semiconductor Corporation and STMicroelectronics N.V. in the 2026 market environment:
1. Market & Competition
ON Semiconductor Corporation
- Faces intense competition in automotive and power solutions sectors, with rising innovation demands.
STMicroelectronics N.V.
- Competes globally across diverse semiconductor segments, pressured by rapid technology shifts and price sensitivity.
2. Capital Structure & Debt
ON Semiconductor Corporation
- Maintains moderate leverage (D/E 0.38), strong interest coverage (30.5x), supporting financial stability.
STMicroelectronics N.V.
- Exhibits low leverage (D/E 0.12) and infinite interest coverage, indicating a conservative capital structure.
3. Stock Volatility
ON Semiconductor Corporation
- Higher beta (1.54) signals greater stock volatility and sensitivity to market swings.
STMicroelectronics N.V.
- Lower beta (1.32) suggests relatively steadier stock behavior amid market fluctuations.
4. Regulatory & Legal
ON Semiconductor Corporation
- US-based operations face evolving trade policies and technology export restrictions.
STMicroelectronics N.V.
- European headquarters expose it to stringent EU regulations and geopolitical trade barriers.
5. Supply Chain & Operations
ON Semiconductor Corporation
- Relies on complex global supply chains, vulnerable to disruptions in semiconductor materials.
STMicroelectronics N.V.
- Larger employee base and global footprint increase operational complexity and supply chain risk.
6. ESG & Climate Transition
ON Semiconductor Corporation
- Focuses on enabling greener automotive and energy solutions, but must meet rising ESG disclosure demands.
STMicroelectronics N.V.
- Faces pressure to align with EU climate policies, requiring accelerated sustainability initiatives.
7. Geopolitical Exposure
ON Semiconductor Corporation
- US-China tensions may affect semiconductor exports and government contracts.
STMicroelectronics N.V.
- European base subjects it to regional political uncertainties and trade tensions with Asia.
Which company shows a better risk-adjusted profile?
ON Semiconductor’s most impactful risk is its higher stock volatility and exposure to US regulatory shifts. STMicroelectronics faces significant challenges from weak profitability and complex global operations. ON’s stronger financial ratios and safer Altman Z-Score position it with a better risk-adjusted profile, despite its market sensitivity. Notably, STM’s low net margin (1.4%) contrasts sharply with ON’s robust 22.2%, underscoring profitability concerns that heighten STM’s risk profile.
Final Verdict: Which stock to choose?
ON Semiconductor’s superpower lies in its improving profitability and operational efficiency. I’ve observed its growing ROIC signals rising competitive strength despite its current ratio suggesting excess liquidity that might weigh on capital efficiency. It suits portfolios aiming for aggressive growth with a tolerance for short-term volatility.
STMicroelectronics commands a strategic moat through its robust balance sheet and consistent investment in R&D, underpinning potential innovation. It offers better financial stability compared to ON but struggles with profitability declines. This profile aligns with investors seeking GARP – growth at a reasonable price – emphasizing resilience over rapid expansion.
If you prioritize growth fueled by improving profitability and operational momentum, ON Semiconductor is the compelling choice due to its rising ROIC and cash conversion strength. However, if you seek greater balance sheet safety and steady innovation investment, STMicroelectronics offers better stability despite current profitability challenges. Both require vigilance on evolving market conditions and execution risks.
Disclaimer: Investment carries a risk of loss of initial capital. The past performance is not a reliable indicator of future results. Be sure to understand risks before making an investment decision.
Go Further
I encourage you to read the complete analyses of ON Semiconductor Corporation and STMicroelectronics N.V. to enhance your investment decisions: