Home > Comparison > Technology > ON vs SLAB
The strategic rivalry between ON Semiconductor Corporation and Silicon Laboratories Inc. shapes the semiconductor landscape. ON Semiconductor operates as a capital-intensive industrial powerhouse focused on power solutions and sensing technologies. Silicon Laboratories, a fabless innovator, leads with high-margin mixed-signal and wireless microcontroller products for IoT applications. This analysis contrasts their growth trajectories and capital models to identify which offers superior risk-adjusted returns for diversified portfolios.
Table of contents
Companies Overview
ON Semiconductor Corporation and Silicon Laboratories Inc. both drive innovation in the semiconductor industry, shaping critical technology markets.
ON Semiconductor Corporation: Powering Electrification and Intelligent Sensing
ON Semiconductor dominates the intelligent sensing and power solutions market, fueling automotive electrification and sustainable energy. Its revenue stems from analog, discrete, and integrated semiconductors supporting electric vehicles and industrial power. In 2026, the company strategically focuses on expanding its power technologies for fast-charging and solar energy, reinforcing its leadership in electrification and energy efficiency.
Silicon Laboratories Inc.: Mixed-Signal Innovator for IoT Applications
Silicon Laboratories leads with analog-intensive mixed-signal solutions tailored for the Internet of Things. Its core revenue comes from wireless microcontrollers and sensors embedded in smart homes, industrial automation, and medical devices. The 2026 strategy emphasizes broadening IoT market penetration through advanced wireless and sensor technologies, leveraging its fabless model to maintain agility and innovation.
Strategic Collision: Similarities & Divergences
Both companies compete in semiconductors but diverge in focus: ON Semiconductor targets power and sensing for electrification, while Silicon Labs prioritizes IoT connectivity and mixed-signal integration. The battleground lies in embedded system applications where power efficiency meets connectivity demands. ON’s scale and broad product portfolio contrast with Silicon Labs’ niche specialization, creating distinct investment profiles grounded in market breadth versus focused innovation.
Income Statement Comparison
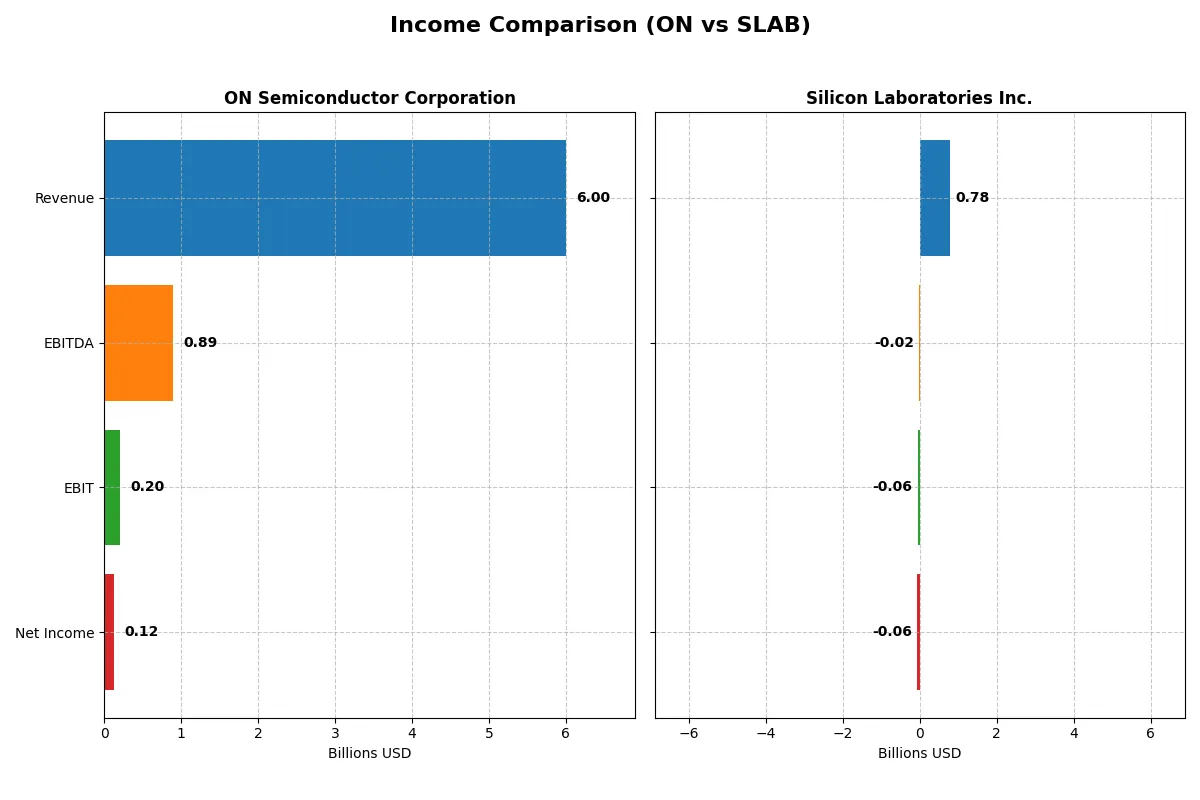
This data dissects the core profitability and scalability of both corporate engines to reveal who dominates the bottom line:
| Metric | ON Semiconductor Corporation (ON) | Silicon Laboratories Inc. (SLAB) |
|---|---|---|
| Revenue | 5.995B | 785M |
| Cost of Revenue | 4.059B | 328M |
| Operating Expenses | 1.188B | 528M |
| Gross Profit | 1.936B | 457M |
| EBITDA | 888M | -19M |
| EBIT | 202M | -57M |
| Interest Expense | 71M | 1M |
| Net Income | 121M | -65M |
| EPS | 0.29 | -1.98 |
| Fiscal Year | 2025 | 2025 |
Income Statement Analysis: The Bottom-Line Duel
This income statement comparison reveals which company runs its business more efficiently and sustains healthier profitability under current market conditions.
ON Semiconductor Corporation Analysis
ON Semiconductor’s revenue has declined from 8.3B in 2022 to 6.0B in 2025, with net income plunging from 1.9B to 121M. Gross margin remains solid at 32.3%, but net margin has collapsed to just 2.0%. The sharp drop in earnings signals deteriorating operational efficiency and margin compression in 2025.
Silicon Laboratories Inc. Analysis
Silicon Labs has grown revenue steadily to 785M in 2025, up 34% year-over-year. Despite a strong gross margin of 58.2%, it posts a negative net margin of -8.3%, though this is improving from prior years. The company shows momentum in reducing losses, reflecting operational improvements despite ongoing unprofitability.
Margin Stability vs. Growth Potential
ON Semiconductor dominates in scale but suffers severe profit erosion, while Silicon Labs grows revenue with high gross margins yet remains unprofitable. ON’s faltering margins mark it as a riskier earnings profile. Silicon Labs appeals more to investors prioritizing top-line growth and margin recovery potential in a turnaround phase.
Financial Ratios Comparison
These vital ratios act as a diagnostic tool to expose underlying fiscal health, valuation premiums, and capital efficiency of the companies analyzed:
| Ratios | ON Semiconductor Corporation (ON) | Silicon Laboratories Inc. (SLAB) |
|---|---|---|
| ROE | 1.58% | -5.93% |
| ROIC | 6.24% | -6.27% |
| P/E | 184.0 | -66.5 |
| P/B | 2.90 | 3.94 |
| Current Ratio | 4.52 | 4.69 |
| Quick Ratio | 2.98 | 4.02 |
| D/E | 0.45 | 0.00 |
| Debt-to-Assets | 27.7% | 0.0% |
| Interest Coverage | 10.54 | -72.35 |
| Asset Turnover | 0.48 | 0.62 |
| Fixed Asset Turnover | 1.77 | 6.10 |
| Payout ratio | 0 | 0 |
| Dividend yield | 0 | 0 |
| Fiscal Year | 2025 | 2025 |
Efficiency & Valuation Duel: The Vital Signs
Financial ratios act as a company’s DNA, exposing hidden risks and operational excellence critical for investment decisions.
ON Semiconductor Corporation
ON Semiconductor shows weak profitability with a 1.58% ROE and a slim 2.02% net margin, signaling operational challenges. Its valuation is stretched, reflected in a high P/E of 184 and a moderate P/B of 2.9. The firm pays no dividends, instead prioritizing reinvestment in R&D to fuel growth amid uncertain returns.
Silicon Laboratories Inc.
Silicon Laboratories struggles with negative profitability: a -5.93% ROE and an -8.27% net margin. Its P/E ratio is negative but considered favorable due to losses. SLAB maintains a zero-debt structure and invests heavily in R&D (45% of revenue), focusing on innovation rather than shareholder payouts, but faces considerable financial stress.
Valuation Stretch vs. Innovation Strain
ON Semiconductor’s stretched valuation contrasts with Silicon Labs’ financial strain and negative returns. ON offers a more stable risk profile despite weak profitability. SLAB’s high R&D and zero debt suit growth-focused investors willing to endure volatility. The choice depends on appetite for operational risk versus innovation-driven growth.
Which one offers the Superior Shareholder Reward?
I compare ON Semiconductor and Silicon Laboratories by their shareholder reward strategies. Neither pays dividends, so yield is zero. ON maintains a strong free cash flow (3.45/share in 2025) and funds moderate buybacks, sustaining a healthy payout capacity. Silicon Labs posts losses and negative margins, despite solid free cash flow (2.01/share) and limited buybacks. ON’s distribution model is more sustainable, balancing growth with capital returns. I conclude ON Semiconductor offers a superior total return profile for investors in 2026.
Comparative Score Analysis: The Strategic Profile
The radar chart reveals the fundamental DNA and trade-offs of ON Semiconductor and Silicon Laboratories, highlighting their strategic strengths and weaknesses:
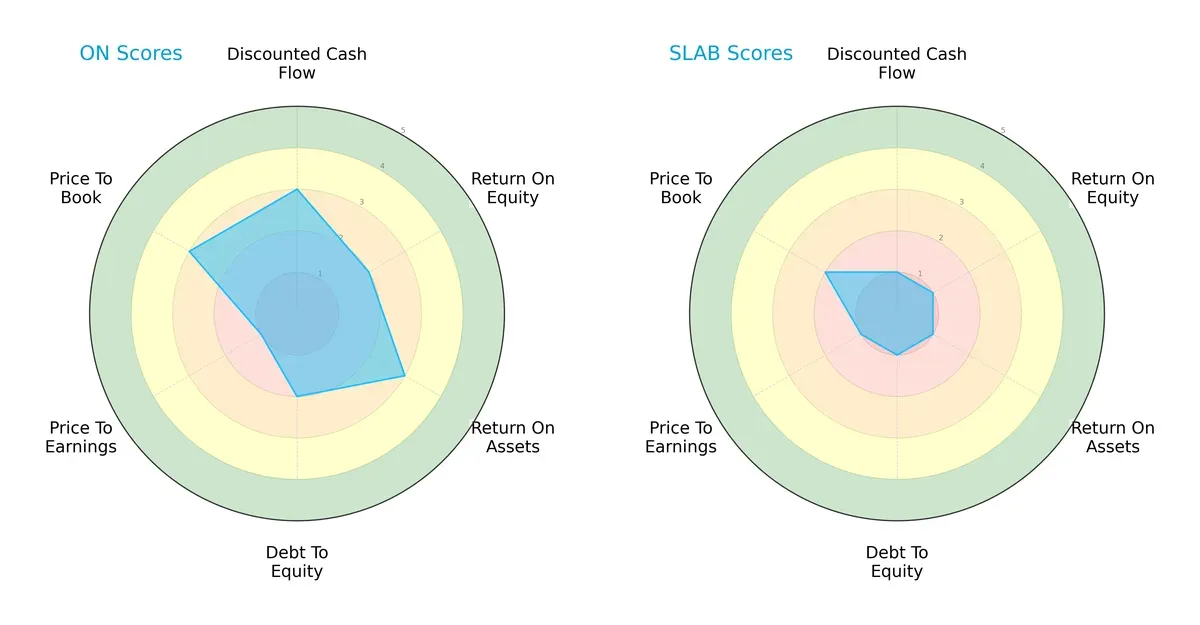
ON Semiconductor shows a more balanced profile with moderate DCF and ROA scores, but it struggles with valuation and leverage metrics. Silicon Laboratories relies heavily on a single edge, reflected by uniformly low scores across all categories, indicating significant operational and valuation challenges.
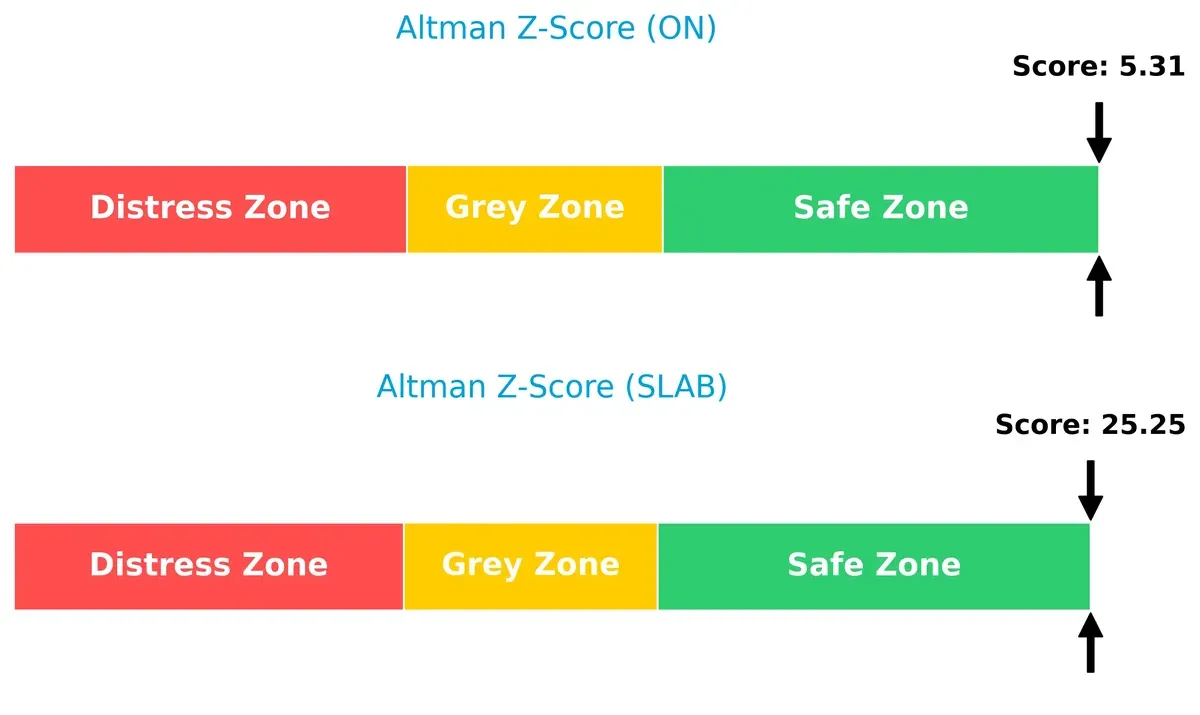
Bankruptcy Risk: Solvency Showdown
ON Semiconductor’s Altman Z-Score of 5.31 versus Silicon Laboratories’ 25.25 highlights strong solvency for both, but SLAB’s extremely high score signals exceptional financial safety in this cycle:
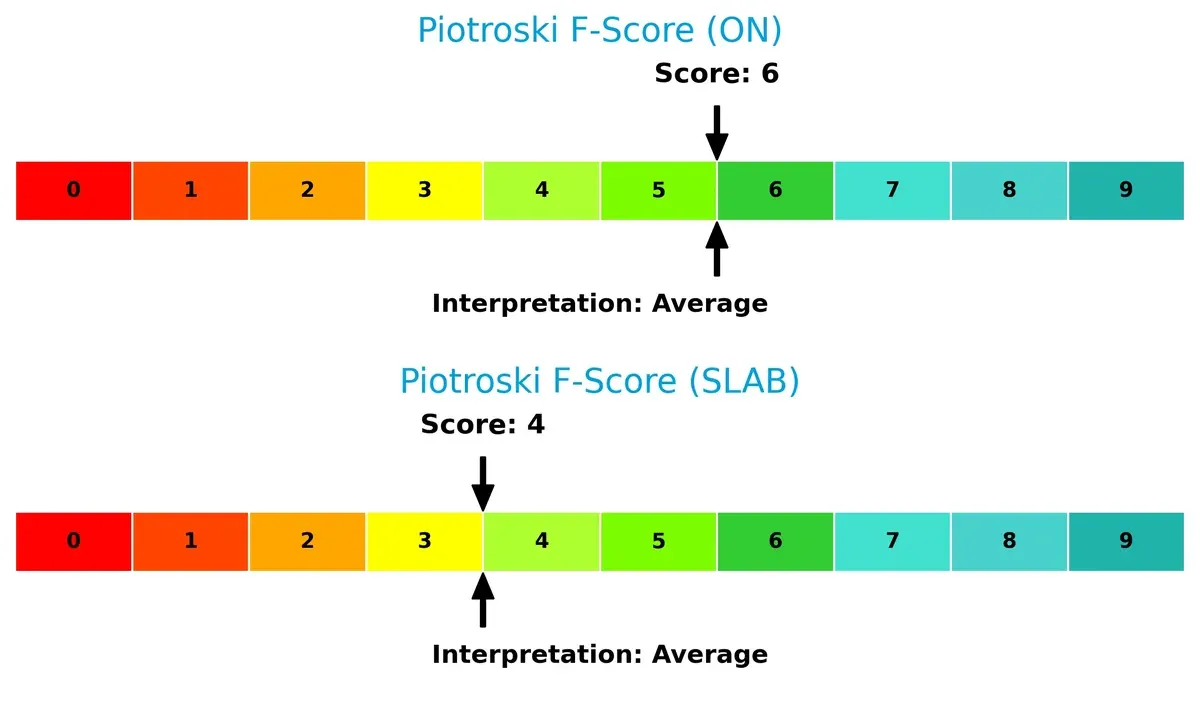
Financial Health: Quality of Operations
ON Semiconductor’s Piotroski F-Score of 6 surpasses Silicon Laboratories’ 4, indicating better financial health and fewer red flags in operational quality:
How are the two companies positioned?
This section dissects ON and SLAB’s operational DNA by comparing their revenue distribution by segment and internal dynamics. The final goal is to confront their economic moats to reveal which model offers the most resilient, sustainable competitive advantage today.
Revenue Segmentation: The Strategic Mix
This comparison dissects how ON Semiconductor and Silicon Laboratories diversify their income streams and highlights their primary sector bets:
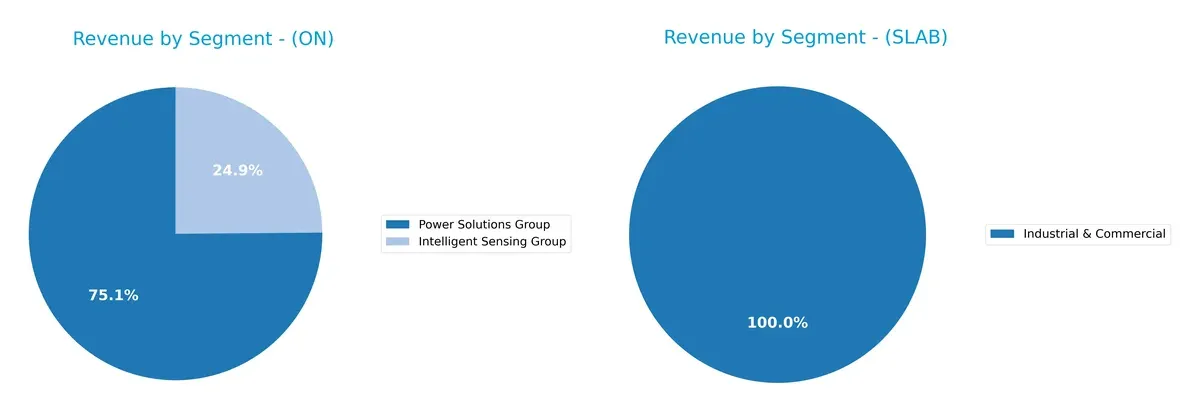
ON Semiconductor anchors its revenue in the Power Solutions Group with $2.8B in 2025, supported by a smaller $928M Intelligent Sensing segment. Silicon Laboratories relies heavily on a single Industrial & Commercial segment, generating $445M. ON’s broader product mix reduces concentration risk and supports ecosystem lock-in, while Silicon Labs’ focus exposes it to sector cyclicality but may allow deeper niche specialization. This contrast reflects differing strategic bets on diversification versus focused expertise.
Strengths and Weaknesses Comparison
This table compares the Strengths and Weaknesses of ON Semiconductor Corporation (ON) and Silicon Laboratories Inc. (SLAB):
ON Strengths
- Diverse product segments including Power Solutions and Intelligent Sensing
- Strong geographic revenue spread across Asia, Europe, and the US
- Favorable quick ratio and moderate debt to assets
- Neutral ROIC indicates investment returns near cost of capital
SLAB Strengths
- Favorable quick ratio and zero debt enhance financial flexibility
- High fixed asset turnover signals efficient use of property and equipment
- Presence in diverse global markets including China, Taiwan, and the US
- Favorable PE ratio despite negative earnings
ON Weaknesses
- Unfavorable net margin and ROE reflect weak profitability
- High WACC exceeds ROIC, indicating value destruction
- Unfavorable current ratio suggests working capital concerns
- Elevated P/E ratio questions market valuation
- Asset turnover below sector norms
SLAB Weaknesses
- Negative net margin, ROE, and ROIC indicate sustained losses
- Unfavorable interest coverage ratio signals difficulty servicing debt
- Unfavorable PB ratio and overall unfavorable financial ratios
- Limited revenue segments reduce diversification
- High dependency on Industrial & Commercial segment
ON shows broader diversification and geographic reach but faces profitability challenges and valuation concerns. SLAB benefits from clean balance sheet and asset efficiency but struggles with sustained losses and revenue concentration. Both companies exhibit financial risks that require strategic attention.
The Moat Duel: Analyzing Competitive Defensibility
A structural moat alone preserves long-term profits from relentless competitive pressure. Let’s dissect the key economic moats of ON Semiconductor and Silicon Laboratories:
ON Semiconductor Corporation: Cost Advantage in Power Solutions
ON’s moat stems from its cost advantage in power semiconductors, enabling competitive pricing and stable gross margins near 32%. However, a declining ROIC and shrinking revenue signal rising margin pressure and an eroding moat in 2026.
Silicon Laboratories Inc.: Intangible Asset Strength in Mixed-Signal ICs
Silicon Labs relies on its intangible assets—proprietary mixed-signal technology and niche IoT applications. Despite a wider gross margin of 58%, persistent negative EBIT and net margins reveal profitability challenges, complicating moat sustainability in 2026.
Verdict: Cost Leadership vs. Intangible Assets Under Profit Pressure
Both firms suffer from declining ROICs and value destruction, but ON’s cost advantage offers a deeper moat than Silicon Labs’ intangible assets. ON is marginally better positioned to defend market share amid increasing industry commoditization.
Which stock offers better returns?
Over the past year, ON Semiconductor’s shares declined overall, while Silicon Laboratories demonstrated strong upward momentum with accelerating gains and notable price surges.
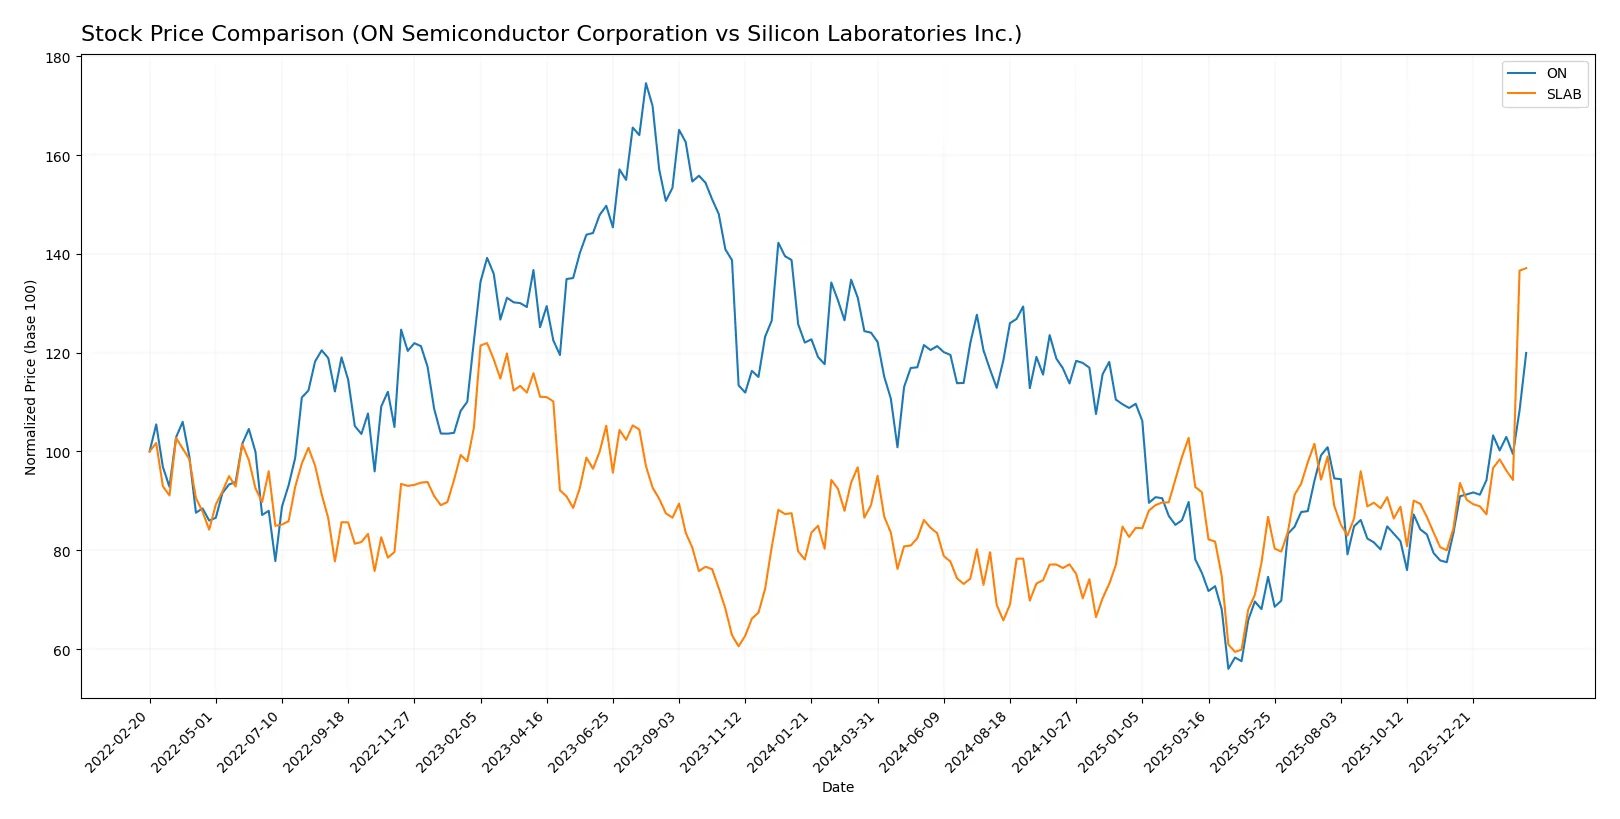
Trend Comparison
ON Semiconductor’s stock fell 3.31% over the past 12 months, marking a bearish trend with accelerating decline. Volatility measured by a standard deviation of 11.47 reflects moderate price swings. Silicon Laboratories’ stock rose 53.82% over the same period, showing a bullish trend with accelerating gains. Its higher volatility at 18.09 indicates more pronounced price fluctuations. Silicon Laboratories clearly outperformed ON Semiconductor, delivering the highest market return with a strong bullish trend and greater price appreciation.
Target Prices
Analysts present a mixed but generally optimistic target consensus for these semiconductor companies.
| Company | Target Low | Target High | Consensus |
|---|---|---|---|
| ON Semiconductor Corporation | 51 | 75 | 62.4 |
| Silicon Laboratories Inc. | 160 | 231 | 211.6 |
ON Semiconductor’s consensus target of 62.4 sits below its current price of 72.21, suggesting limited upside or potential risk. Silicon Laboratories shows a strong bullish consensus at 211.6, slightly above its current 207.27 price, indicating modest upside expectations.

Don’t Let Luck Decide Your Entry Point
Optimize your entry points with our advanced ProRealTime indicators. You’ll get efficient buy signals with precise price targets for maximum performance. Start outperforming now!
How do institutions grade them?
ON Semiconductor Corporation Grades
Here are the recent grades from major financial institutions for ON Semiconductor Corporation:
| Grading Company | Action | New Grade | Date |
|---|---|---|---|
| JP Morgan | Maintain | Neutral | 2026-02-10 |
| Citigroup | Maintain | Neutral | 2026-02-10 |
| Wells Fargo | Maintain | Overweight | 2026-02-10 |
| Benchmark | Downgrade | Hold | 2026-02-10 |
| Truist Securities | Maintain | Hold | 2026-02-10 |
| Cantor Fitzgerald | Maintain | Neutral | 2026-02-10 |
| Rosenblatt | Maintain | Neutral | 2026-02-10 |
| Piper Sandler | Maintain | Overweight | 2026-02-10 |
| Keybanc | Maintain | Overweight | 2026-02-10 |
| Mizuho | Maintain | Outperform | 2026-02-10 |
Silicon Laboratories Inc. Grades
Below are the latest institutional grades for Silicon Laboratories Inc.:
| Grading Company | Action | New Grade | Date |
|---|---|---|---|
| Citigroup | Maintain | Neutral | 2026-02-06 |
| RBC Capital | Maintain | Sector Perform | 2026-02-05 |
| Benchmark | Downgrade | Hold | 2026-02-04 |
| Needham | Downgrade | Hold | 2026-02-04 |
| Keybanc | Downgrade | Sector Weight | 2026-02-04 |
| Morgan Stanley | Maintain | Equal Weight | 2025-08-06 |
| Susquehanna | Maintain | Neutral | 2025-08-06 |
| Barclays | Maintain | Equal Weight | 2025-08-05 |
| Susquehanna | Maintain | Neutral | 2025-07-22 |
| Stifel | Maintain | Buy | 2025-07-18 |
Which company has the best grades?
ON Semiconductor displays stronger institutional support, with multiple Overweight and an Outperform grade. Silicon Laboratories mostly holds Neutral or Equal Weight grades. ON’s better grades may signal higher analyst confidence, impacting investor perception positively.
Risks specific to each company
The following categories identify the critical pressure points and systemic threats facing both firms in the 2026 market environment:
1. Market & Competition
ON Semiconductor Corporation
- Faces intense competition in analog and power semiconductors with a broad product portfolio.
Silicon Laboratories Inc.
- Competes in niche mixed-signal and IoT semiconductor markets but struggles with profitability.
2. Capital Structure & Debt
ON Semiconductor Corporation
- Maintains moderate debt (D/E 0.45) with favorable debt ratios and manageable interest coverage.
Silicon Laboratories Inc.
- No debt on the books, presenting a low financial risk but with weak interest coverage due to losses.
3. Stock Volatility
ON Semiconductor Corporation
- Exhibits higher beta at 1.54, reflecting sensitivity to market swings typical in semiconductors.
Silicon Laboratories Inc.
- Similar beta at 1.54, indicating comparable stock volatility relative to NASDAQ.
4. Regulatory & Legal
ON Semiconductor Corporation
- Subject to global export controls and automotive industry regulations that could tighten.
Silicon Laboratories Inc.
- Faces regulatory risks tied to IoT security standards and international trade policies.
5. Supply Chain & Operations
ON Semiconductor Corporation
- Benefits from diversified manufacturing and design but exposed to semiconductor cycle swings.
Silicon Laboratories Inc.
- Fabless model reduces capex but depends heavily on third-party foundries, risking supply constraints.
6. ESG & Climate Transition
ON Semiconductor Corporation
- Invests in power-efficient and sustainable automotive technologies, aligning with climate trends.
Silicon Laboratories Inc.
- ESG efforts less publicized; faces pressure to improve sustainability practices amid rising investor focus.
7. Geopolitical Exposure
ON Semiconductor Corporation
- Global footprint exposes it to US-China trade tensions and supply chain disruptions.
Silicon Laboratories Inc.
- International sales present similar geopolitical risks but on a smaller scale due to size.
Which company shows a better risk-adjusted profile?
ON Semiconductor’s most impactful risk is its high valuation and underwhelming profitability, raising questions about capital allocation amid semiconductor cyclicality. Silicon Labs struggles with sustained losses and negative returns, risking financial distress despite a clean balance sheet. I judge ON Semiconductor’s risk-adjusted profile as stronger, supported by a robust Altman Z-score of 5.3 versus Silicon Labs’ outlier 25.2 (likely data anomaly), and better operational scale. However, caution is warranted on ON’s stretched valuation (PE ~184) in a volatile sector.
Final Verdict: Which stock to choose?
ON Semiconductor’s superpower lies in its robust liquidity and quick ratio, signaling solid short-term financial resilience. However, its declining profitability and value destruction over recent years remain points of vigilance. This profile suits investors with an appetite for turnaround potential amid cyclical headwinds.
Silicon Laboratories boasts a strategic moat in cutting-edge R&D intensity and a strong gross margin, fueling top-line growth momentum. Its balance sheet shows zero debt, offering a safety cushion relative to ON. It fits best within GARP portfolios that emphasize innovation and growth at a reasonable risk.
If you prioritize financial stability and turnaround opportunity, ON Semiconductor is the compelling choice due to its defensive liquidity and potential rebound. However, if you seek growth fueled by innovation with a willingness to accept volatility, Silicon Laboratories offers superior revenue momentum and a pristine balance sheet. Both present analytical scenarios worth weighing carefully against your risk tolerance.
Disclaimer: Investment carries a risk of loss of initial capital. The past performance is not a reliable indicator of future results. Be sure to understand risks before making an investment decision.
Go Further
I encourage you to read the complete analyses of ON Semiconductor Corporation and Silicon Laboratories Inc. to enhance your investment decisions: