In the fast-evolving semiconductor industry, ON Semiconductor Corporation and Qnity Electronics, Inc. stand out as notable players with distinct approaches. ON Semiconductor drives innovation through intelligent power solutions and sensing technologies, while Qnity Electronics focuses on advanced materials for chip manufacturing. Both companies operate within overlapping markets, making their comparison essential. This article will help you identify which company presents the most compelling investment opportunity in 2026.
Table of contents
Companies Overview
I will begin the comparison between ON Semiconductor Corporation and Qnity Electronics, Inc. by providing an overview of these two companies and their main differences.
ON Semiconductor Corporation Overview
ON Semiconductor Corporation focuses on intelligent sensing and power solutions globally, targeting automotive electrification, fast-charging systems, and sustainable energy markets. The company operates through three segments offering analog, discrete, and integrated semiconductor products essential for power switching, signal conditioning, and voltage regulation. Headquartered in Scottsdale, AZ, ON has a market cap of $24.7B and employs 26,400 people.
Qnity Electronics, Inc. Overview
Qnity Electronics, Inc. specializes in electronic solutions and materials for semiconductor chip manufacturing and advanced electronic materials. Formerly Novus SpinCo 1, Inc., it rebranded in April 2025 and is based in Wilmington, DE. Qnity is newer to the market with an IPO date in late 2025, a market cap of $19.5B, and no publicly disclosed employee count.
Key similarities and differences
Both companies operate in the semiconductor industry within the technology sector and are U.S.-based firms. ON Semiconductor has a broader product range focused on power solutions and sensing technologies with a long operational history since 1992, while Qnity is more specialized in materials for chip manufacturing and is a recent market entrant. ON is listed on NASDAQ, whereas Qnity trades on the NYSE, reflecting differences in market positioning and scale.
Income Statement Comparison
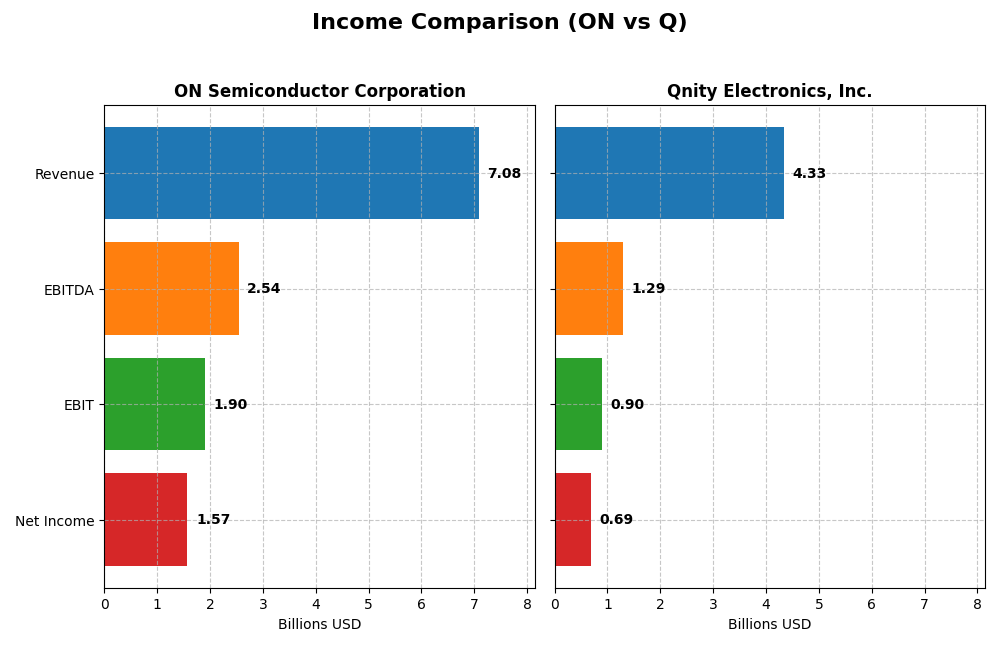
The table below presents a side-by-side comparison of key income statement metrics for ON Semiconductor Corporation and Qnity Electronics, Inc. for the fiscal year 2024.
| Metric | ON Semiconductor Corporation | Qnity Electronics, Inc. |
|---|---|---|
| Market Cap | 24.7B | 19.5B |
| Revenue | 7.08B | 4.34B |
| EBITDA | 2.54B | 1.29B |
| EBIT | 1.90B | 898M |
| Net Income | 1.57B | 693M |
| EPS | 3.68 | 3.31 |
| Fiscal Year | 2024 | 2024 |
Income Statement Interpretations
ON Semiconductor Corporation
ON Semiconductor’s revenue showed a solid growth of 34.77% from 2020 to 2024 but experienced a 14.19% decline in 2024 alone. Net income surged overall by 571.56% despite a 16.07% dip last year. Margins remained favorable, with a gross margin of 45.41% and net margin of 22.21%. The recent year saw a slowdown in growth but maintained strong profitability.
Qnity Electronics, Inc.
Qnity Electronics experienced a 7.43% revenue increase in 2024 after a prior overall decline of 8.83% since 2022. Net income dropped 10.47% over the period but rose 36.69% last year. Margins are stable and favorable, with a gross margin of 46.11% and net margin near 16%. The latest year’s performance featured improved profitability and margin expansion.
Which one has the stronger fundamentals?
ON Semiconductor demonstrates stronger fundamentals over the longer term, with significant net income and margin growth, despite a recent revenue contraction. Qnity Electronics shows encouraging recent improvements but faces unfavorable overall trends in revenue and net income. Both companies have favorable margin profiles, yet ON’s larger scale and historical growth provide a more robust foundation.
Financial Ratios Comparison
The table below compares key financial ratios of ON Semiconductor Corporation and Qnity Electronics, Inc. for the fiscal year 2024, highlighting their performance metrics and financial health indicators.
| Ratios | ON Semiconductor Corporation | Qnity Electronics, Inc. |
|---|---|---|
| ROE | 17.88% | 6.51% |
| ROIC | 11.88% | 5.92% |
| P/E | 17.13 | 28.80 |
| P/B | 3.06 | 1.88 |
| Current Ratio | 5.06 | 1.77 |
| Quick Ratio | 3.38 | 1.06 |
| D/E | 0.38 | 0.02 |
| Debt-to-Assets | 23.90% | 1.56% |
| Interest Coverage | 28.37 | 3.03 |
| Asset Turnover | 0.50 | 0.35 |
| Fixed Asset Turnover | 1.61 | 2.59 |
| Payout ratio | 0 | 0 |
| Dividend yield | 0% | 0% |
Interpretation of the Ratios
ON Semiconductor Corporation
ON Semiconductor shows several favorable financial ratios, including a strong net margin of 22.21% and a robust return on equity at 17.88%. However, concerns arise from its high current ratio of 5.06 and an unfavorable price-to-book ratio of 3.06. The company does not pay dividends, which may reflect a focus on reinvestment or growth, as no dividend or share buyback programs are reported.
Qnity Electronics, Inc.
Qnity Electronics presents mixed ratios with a favorable net margin of 15.99% but an unfavorable return on equity of 6.51%. Its low debt levels and strong current ratio of 1.77 suggest prudent financial management. The company pays a small dividend, with a last dividend of $0.06, though the dividend yield remains minimal, indicating limited shareholder returns at this stage.
Which one has the best ratios?
Both companies have a slightly favorable overall ratio profile, but ON Semiconductor’s higher profitability and stronger returns on equity and invested capital give it an edge. Qnity Electronics benefits from lower leverage and a stable liquidity position but faces challenges in profitability and valuation metrics. Each exhibits strengths and weaknesses that balance their comparative ratio evaluations.
Strategic Positioning
This section compares the strategic positioning of ON Semiconductor Corporation and Qnity Electronics, Inc., including market position, key segments, and exposure to technological disruption:
ON Semiconductor Corporation
- Large market cap of 24.7B in semiconductors with NASDAQ listing; faces notable competition
- Diversified segments: Power Solutions, Analog, Intelligent Sensing driving revenues
- Develops advanced power and sensing technologies, exposed to evolving semiconductor tech
Qnity Electronics, Inc.
- Market cap of 19.5B, NYSE-listed, newer firm with emerging presence in semiconductor materials
- Focused on electronic solutions and materials for semiconductor chip manufacturing
- Engages in advanced electronic materials, potentially sensitive to semiconductor manufacturing innovations
ON Semiconductor vs Qnity Electronics Positioning
ON Semiconductor pursues a diversified business model across multiple semiconductor segments, offering varied revenue streams. Qnity Electronics concentrates on semiconductor materials, implying focused but narrower market exposure. Diversification offers risk spread, while concentration can enable specialized expertise.
Which has the best competitive advantage?
Both companies currently shed value as ROIC remains below WACC. ON Semiconductor shows a growing ROIC trend (slightly favorable), while Qnity maintains stable but neutral profitability. ON Semiconductor’s improving profitability suggests a developing competitive advantage.
Stock Comparison
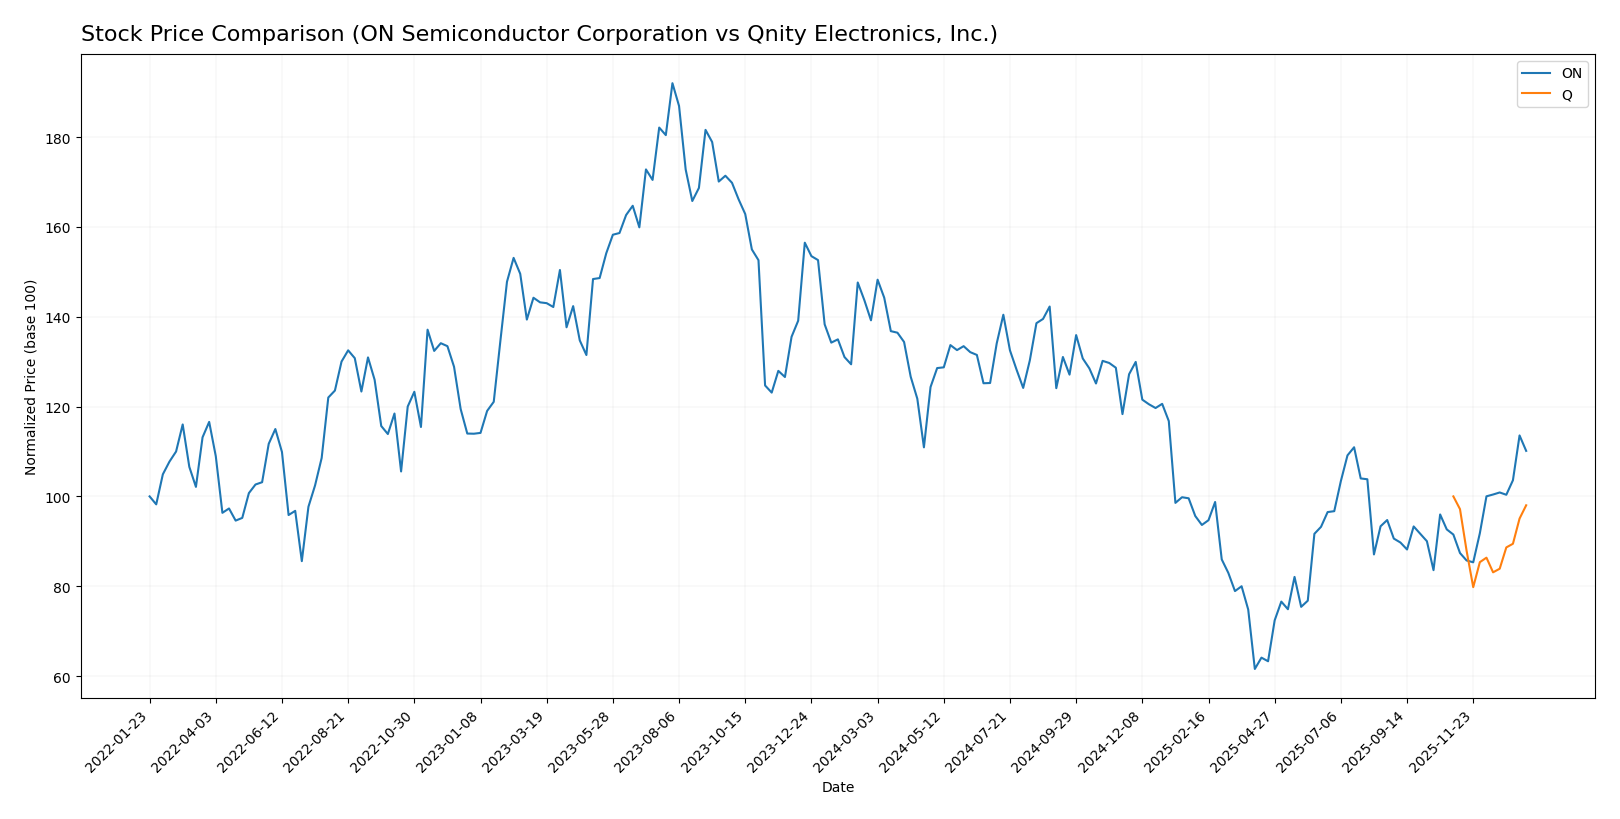
The stock price movements of ON Semiconductor Corporation and Qnity Electronics, Inc. over the past year reveal contrasting trading dynamics, with ON showing significant volatility and a recent upward shift, while Qnity remains relatively stable but slightly bearish.
Trend Analysis
ON Semiconductor Corporation experienced a bearish trend over the past 12 months with a price decline of 20.88%. The trend shows acceleration and high volatility with a standard deviation of 11.97, hitting a low of 33.7 and a high of 81.14.
Qnity Electronics, Inc. also followed a bearish trend but with a modest price decline of 1.98%, classified as stable with a standard deviation of 5.94. The stock price remained within a narrower range between 75.8 and 95.0.
Comparing both stocks, ON Semiconductor delivered the lowest market performance over the past year due to its larger price drop, while Qnity Electronics posted a less pronounced decline, indicating relatively better stability.
Target Prices
The current analyst consensus presents clear target price ranges for ON Semiconductor Corporation and Qnity Electronics, Inc.
| Company | Target High | Target Low | Consensus |
|---|---|---|---|
| ON Semiconductor Corporation | 64 | 51 | 58.33 |
| Qnity Electronics, Inc. | 117 | 92 | 105.89 |
Analysts expect ON Semiconductor’s price to slightly appreciate from its current 60.28 USD, while Qnity Electronics shows potential upside, trading now at 93.12 USD below the consensus target.
Analyst Opinions Comparison
This section compares analysts’ ratings and grades for ON Semiconductor Corporation (ON) and Qnity Electronics, Inc. (Q):
Rating Comparison
ON Rating
- Rating: B-, considered very favorable by analysts.
- Discounted Cash Flow Score: 3, indicating moderate valuation based on future cash flows.
- ROE Score: 2, reflecting moderate efficiency in generating profits from shareholders’ equity.
- ROA Score: 3, a moderate measure of asset utilization effectiveness.
- Debt To Equity Score: 2, suggesting moderate financial risk with a balanced debt level.
- Overall Score: 2, categorized as moderate overall financial standing.
Q Rating
- Rating: B+, also considered very favorable by analysts.
- Discounted Cash Flow Score: 4, showing a favorable valuation outlook.
- ROE Score: 3, indicating moderate but better efficiency than ON.
- ROA Score: 4, indicating favorable effectiveness in asset utilization.
- Debt To Equity Score: 3, representing moderate financial risk but slightly stronger balance sheet.
- Overall Score: 3, also moderate but higher than ON.
Which one is the best rated?
Based strictly on the data, Q holds a stronger overall rating (B+ vs. B-) and higher scores in discounted cash flow, ROE, ROA, debt to equity, and overall score, indicating it is better rated than ON.
Scores Comparison
Here is a comparison of the Altman Z-Score and Piotroski Score for the two companies:
ON Scores
- Altman Z-Score: 4.84, indicating a safe zone.
- Piotroski Score: 6, considered average strength.
Q Scores
- No Altman Z-Score data provided.
- No Piotroski Score data provided.
Which company has the best scores?
Based on the available data, ON has a clear Altman Z-Score in the safe zone and an average Piotroski Score. Q lacks any score data for comparison. Therefore, only ON’s scores can be evaluated here.
Grades Comparison
Here is the recent grading comparison of ON Semiconductor Corporation and Qnity Electronics, Inc.:
ON Semiconductor Corporation Grades
The following table shows recent grades assigned by established grading companies for ON Semiconductor Corporation.
| Grading Company | Action | New Grade | Date |
|---|---|---|---|
| Piper Sandler | Maintain | Overweight | 2026-01-07 |
| Truist Securities | Maintain | Hold | 2025-12-19 |
| Morgan Stanley | Maintain | Equal Weight | 2025-11-24 |
| Truist Securities | Maintain | Hold | 2025-11-04 |
| Baird | Maintain | Neutral | 2025-11-04 |
| Rosenblatt | Maintain | Neutral | 2025-11-04 |
| Morgan Stanley | Maintain | Equal Weight | 2025-11-04 |
| TD Cowen | Maintain | Buy | 2025-11-04 |
| UBS | Maintain | Neutral | 2025-10-27 |
| B of A Securities | Maintain | Neutral | 2025-09-05 |
The overall grades for ON Semiconductor show a mix of Hold, Neutral, and Buy ratings, with a consensus rating of Buy from 43 analysts.
Qnity Electronics, Inc. Grades
Below are the latest grades given by recognized grading firms for Qnity Electronics, Inc.
| Grading Company | Action | New Grade | Date |
|---|---|---|---|
| RBC Capital | Maintain | Outperform | 2025-11-25 |
| Mizuho | Maintain | Outperform | 2025-11-20 |
Qnity Electronics has consistent Outperform ratings from two grading companies, with a consensus Buy rating supported by 2 analysts.
Which company has the best grades?
Qnity Electronics holds consistently stronger grades, marked by Outperform ratings, compared to ON Semiconductor’s mixed Hold and Neutral grades. This suggests Qnity may be perceived as having better growth prospects, potentially influencing investor confidence differently.
Strengths and Weaknesses
Below is a comparative overview of key strengths and weaknesses of ON Semiconductor Corporation (ON) and Qnity Electronics, Inc. (Q) based on the most recent financial and operational data.
| Criterion | ON Semiconductor Corporation (ON) | Qnity Electronics, Inc. (Q) |
|---|---|---|
| Diversification | Strong product diversification across Intelligent Sensing, Power Solutions, and Analog Solutions groups, with revenues of $1.13B, $3.35B, and $2.61B respectively in 2024. | Limited product diversification data; appears more focused, potentially higher risk. |
| Profitability | Favorable net margin at 22.21%, ROE at 17.88%, and ROIC at 11.88%; however, WACC is relatively high at 10.17%. | Moderate net margin at 15.99%, but low ROE at 6.51% and neutral ROIC at 5.92%; strong WACC at 5.8%. |
| Innovation | Growing ROIC trend (+156%), indicating improving profitability and potential innovation impact; rated slightly favorable moat status. | Stable ROIC trend (0%), neutral moat status, suggesting limited recent innovation or competitive edge gains. |
| Global presence | Large and diverse revenue streams imply broad market reach and global operations. | Data insufficient to confirm global presence; likely smaller scale. |
| Market Share | Significant market share in power solutions and analog segments, supported by revenue scale. | Market share unclear; smaller scale and less diversified product base imply limited share. |
Key takeaways: ON Semiconductor demonstrates stronger diversification, profitability, and innovation momentum, supporting a slightly favorable investment stance despite some cost of capital concerns. Qnity Electronics remains stable but shows limited growth and competitive advantage, suggesting a cautious approach for investors.
Risk Analysis
Below is a comparative risk overview for ON Semiconductor Corporation (ON) and Qnity Electronics, Inc. (Q) based on the most recent 2024 data and current market conditions.
| Metric | ON Semiconductor Corporation (ON) | Qnity Electronics, Inc. (Q) |
|---|---|---|
| Market Risk | Beta 1.54 indicates higher volatility; semiconductor cyclicality impacts demand | Beta 0; less volatile but newer IPO (2025) implies market acceptance risk |
| Debt level | Debt-to-equity 0.38 (favorable); interest coverage strong at 30.49 | Very low debt (D/E 0.02); moderate interest coverage (3.21) |
| Regulatory Risk | Moderate; automotive and industrial sectors face evolving emissions and safety standards | Moderate; semiconductor materials subject to trade regulations |
| Operational Risk | Established operations with 26.4K employees; supply chain disruptions possible | Smaller scale, newer company; operational scaling risks |
| Environmental Risk | Exposure to energy-intensive manufacturing; moderate sustainability initiatives | Emerging company; likely increasing focus on green production methods |
| Geopolitical Risk | US-based but global supply chain exposure; semiconductor trade tensions relevant | US-based, newer with less global exposure but subject to US-China tech tensions |
The most likely and impactful risks for ON Semiconductor stem from its market volatility and supply chain dependencies amid semiconductor sector cyclicality. Qnity Electronics, while less volatile, faces typical risks of a new IPO company including market acceptance and operational scaling, with geopolitical trade tensions impacting both firms significantly in 2026. Caution is advised given the sector’s sensitivity to global economic shifts and regulatory changes.
Which Stock to Choose?
ON Semiconductor Corporation shows a favorable income statement with strong profitability despite a recent 14% revenue decline. Its financial ratios are slightly favorable overall, supported by low debt and solid return on equity, while its rating is very favorable.
Qnity Electronics, Inc. posts a favorable income statement with moderate revenue growth but lower profitability ratios. It maintains a very favorable rating, low debt levels, and a stable moat indication, though some ratios like ROE remain unfavorable.
Investors prioritizing growth and improving profitability might find ON Semiconductor’s rising returns and income statement trends more appealing, while those valuing financial stability and lower risk could see Qnity Electronics as a more suitable choice given its stable moat and very favorable rating.
Disclaimer: Investment carries a risk of loss of initial capital. The past performance is not a reliable indicator of future results. Be sure to understand risks before making an investment decision.
Go Further
I encourage you to read the complete analyses of ON Semiconductor Corporation and Qnity Electronics, Inc. to enhance your investment decisions: