Investors seeking promising opportunities in the technology sector often weigh established giants against innovative newcomers. ON Semiconductor Corporation, a leader in intelligent power and sensing solutions, and Ouster, Inc., a pioneer in high-resolution digital lidar sensors, both operate at the cutting edge of hardware and semiconductor technologies. This comparison explores their market overlap and innovation strategies to identify which company offers the most compelling potential for your investment portfolio. Let’s uncover which stock stands out for investors today.
Table of contents
Companies Overview
I will begin the comparison between ON Semiconductor Corporation and Ouster, Inc. by providing an overview of these two companies and their main differences.
ON Semiconductor Corporation Overview
ON Semiconductor Corporation delivers intelligent sensing and power solutions globally, focusing on enabling automotive electrification and sustainable energy systems. The company operates through three segments, offering analog, discrete, and integrated semiconductor products that serve diverse applications such as power switching, signal conditioning, and image sensing. Headquartered in Scottsdale, Arizona, ON is a well-established player in the semiconductor industry with a market cap of $23.2B.
Ouster, Inc. Overview
Ouster, Inc. specializes in designing and manufacturing high-resolution digital lidar sensors and software to provide 3D vision for machinery, vehicles, robots, and infrastructure. Its product lineup includes scanning and solid-state flash sensors. Based in San Francisco, California, Ouster operates in the hardware and equipment sector with a market cap of $1.4B, reflecting its position as a smaller, focused technology company.
Key similarities and differences
Both ON Semiconductor and Ouster operate within the technology sector in the US, serving specialized hardware markets with advanced sensing technologies. ON has a broader product portfolio and larger scale, focusing on semiconductor components across multiple industries. In contrast, Ouster concentrates on lidar sensor technology for 3D vision applications, representing a more niche and emerging market segment with fewer employees and a smaller market capitalization.
Income Statement Comparison
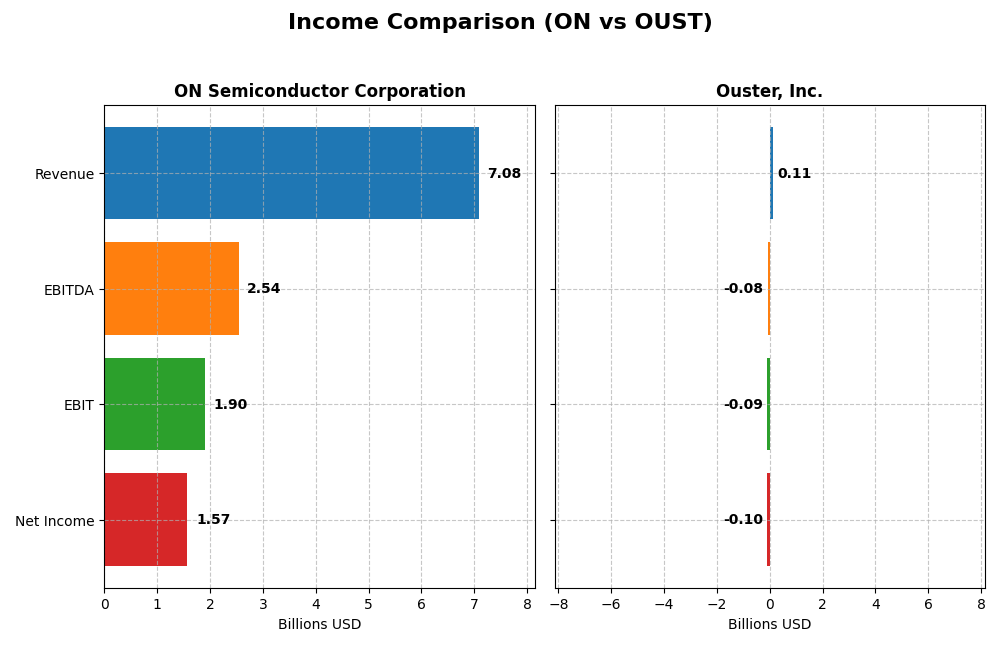
The following table compares key income statement metrics for ON Semiconductor Corporation and Ouster, Inc. for the fiscal year 2024, highlighting the financial scale and profitability differences between the two companies.
| Metric | ON Semiconductor Corporation | Ouster, Inc. |
|---|---|---|
| Market Cap | 23.2B | 1.4B |
| Revenue | 7.08B | 111.1M |
| EBITDA | 2.54B | -79.9M |
| EBIT | 1.90B | -94.7M |
| Net Income | 1.57B | -97.0M |
| EPS | 3.68 | -2.08 |
| Fiscal Year | 2024 | 2024 |
Income Statement Interpretations
ON Semiconductor Corporation
ON Semiconductor showed overall revenue growth of 34.77% from 2020 to 2024, accompanied by a substantial net income increase of 571.56%. Margins remained favorable, with a 45.41% gross margin and a 22.21% net margin in 2024, though the latest year saw a revenue decline of 14.19% and net income drop of 16.07%, indicating a recent slowdown in growth and margin contraction.
Ouster, Inc.
Ouster experienced rapid revenue growth of 487.71% over the 2020-2024 period, with net income rising modestly by 9.12%. Despite a favorable gross margin of 36.42%, the company’s EBIT and net margins remain negative at -85.22% and -87.35%, respectively. The latest year marked improvements with a 33.41% revenue increase and a net margin growth of 80.56%, suggesting accelerating operational progress.
Which one has the stronger fundamentals?
ON Semiconductor holds stronger fundamentals, reflected in solid profitability and positive margins despite recent setbacks, showing robust net income growth and healthy margin levels. Ouster’s impressive revenue growth is tempered by persistent losses and negative profitability metrics, though recent improvements hint at potential. Overall, ON’s consistent profitability and margin stability provide a more favorable fundamental profile.
Financial Ratios Comparison
The table below presents the most recent financial ratios for ON Semiconductor Corporation and Ouster, Inc., providing a snapshot of key performance and financial health indicators as of fiscal year 2024.
| Ratios | ON Semiconductor Corporation | Ouster, Inc. |
|---|---|---|
| ROE | 17.9% | -53.6% |
| ROIC | 11.9% | -50.8% |
| P/E | 17.1 | -5.87 |
| P/B | 3.06 | 3.15 |
| Current Ratio | 5.06 | 2.80 |
| Quick Ratio | 3.38 | 2.59 |
| D/E (Debt-to-Equity) | 0.38 | 0.11 |
| Debt-to-Assets | 23.9% | 7.3% |
| Interest Coverage | 28.4 | -57.1 |
| Asset Turnover | 0.50 | 0.40 |
| Fixed Asset Turnover | 1.61 | 4.54 |
| Payout Ratio | 0 | 0 |
| Dividend Yield | 0 | 0 |
Interpretation of the Ratios
ON Semiconductor Corporation
ON Semiconductor shows a mixed ratio profile with strong profitability indicators: a net margin of 22.21%, ROE at 17.88%, and ROIC at 11.88%, all favorable. However, its WACC and PB ratios are unfavorable, and the current ratio is notably high at 5.06, suggesting potential inefficiencies. The company does not pay dividends, focusing likely on reinvestment and growth over shareholder payouts.
Ouster, Inc.
Ouster’s ratios are predominantly weak, with a negative net margin of -87.35%, ROE at -53.64%, and ROIC at -50.84%, all unfavorable. Despite a favorable PE ratio and solid liquidity ratios, the interest coverage is negative, indicating financial stress. Ouster also does not pay dividends, consistent with its high-growth phase and reinvestment strategy.
Which one has the best ratios?
ON Semiconductor exhibits a more favorable financial ratio profile, reflecting profitability and stable capital structure, despite some liquidity concerns. In contrast, Ouster’s ratios reveal financial challenges and negative profitability metrics. Overall, ON’s ratios are comparatively stronger, while Ouster’s remain unfavorable, reflecting differing stages and financial health.
Strategic Positioning
This section compares the strategic positioning of ON Semiconductor Corporation and Ouster, Inc. across Market position, Key segments, and Exposure to technological disruption:
ON Semiconductor Corporation
- Large market cap of 23B, facing competitive pressure in semiconductors industry
- Diversified segments: Power Solutions, Analog, Intelligent Sensing driving revenue
- Operates in established semiconductor markets with ongoing innovation demands
Ouster, Inc.
- Smaller market cap of 1.4B, competing in hardware and equipment sector
- Concentrated product portfolio focused on high-resolution digital lidar sensors
- Exposure to disruption through advanced 3D vision lidar technology
ON Semiconductor Corporation vs Ouster, Inc. Positioning
ON Semiconductor pursues a diversified strategy across multiple semiconductor segments, offering stability and broader market exposure. Ouster focuses narrowly on lidar sensors, which may limit scale but targets a specialized, emerging technology market.
Which has the best competitive advantage?
Both companies are shedding value relative to their cost of capital. ON Semiconductor shows slightly favorable signs with growing profitability, while Ouster’s value destruction is more pronounced despite ROIC improvement.
Stock Comparison
The past year revealed contrasting trading dynamics between ON Semiconductor Corporation and Ouster, Inc., with ON showing a marked decline and Ouster experiencing substantial gains despite recent pullbacks.

Trend Analysis
ON Semiconductor Corporation’s stock exhibited a bearish trend over the past 12 months, with a price decrease of 29.83%, accelerated decline, and notable volatility at a 12.3 standard deviation. A recent short-term rebound of 7.94% suggests some recovery momentum.
Ouster, Inc. showed a strong bullish trend over the same period, appreciating 332.78% with decelerating gains and moderate volatility at 8.51 standard deviation. However, recent weeks indicated a 20.99% decline, reflecting a short-term correction.
Comparing the two, Ouster delivered the highest market performance with significant overall gains, while ON recorded a substantial loss despite recent positive price movement.
Target Prices
The current analyst consensus indicates moderate upside potential for both ON Semiconductor Corporation and Ouster, Inc.
| Company | Target High | Target Low | Consensus |
|---|---|---|---|
| ON Semiconductor Corporation | 64 | 51 | 58.33 |
| Ouster, Inc. | 39 | 33 | 36.67 |
Analysts expect ON Semiconductor’s price to rise modestly above its current 56.7 USD, while Ouster’s consensus target significantly exceeds its present 23.37 USD, suggesting stronger growth expectations.
Analyst Opinions Comparison
This section compares analysts’ ratings and grades for ON Semiconductor Corporation (ON) and Ouster, Inc. (OUST):
Rating Comparison
ON Rating
- Overall rating is B-, assessed as very favorable by analysts.
- Discounted Cash Flow Score is 4, indicating a favorable valuation outlook.
- Return on Equity Score is 2, considered moderate in efficiency.
- Return on Assets Score is 3, a moderate level of asset utilization.
- Debt To Equity Score is 2, showing moderate financial risk exposure.
- Overall Score is 3, representing a moderate overall financial standing.
OUST Rating
- Overall rating is C-, also marked as very favorable despite a lower score.
- Discounted Cash Flow Score is 1, reflecting a very unfavorable valuation.
- Return on Equity Score is 1, very unfavorable for profitability efficiency.
- Return on Assets Score is 1, indicating very unfavorable asset utilization.
- Debt To Equity Score is 3, suggesting moderate financial risk but better than ON.
- Overall Score is 1, indicating a very unfavorable overall financial standing.
Which one is the best rated?
Based strictly on the data, ON Semiconductor Corporation holds higher overall and individual financial scores compared to Ouster, Inc. ON’s ratings reflect moderate to favorable evaluations, whereas OUST’s scores are mostly very unfavorable except for debt-to-equity.
Scores Comparison
The following table compares the Altman Z-Score and Piotroski Score for ON Semiconductor Corporation and Ouster, Inc.:
ON Scores
- Altman Z-Score: 4.54, indicating a safe zone status.
- Piotroski Score: 6, reflecting average financial strength.
OUST Scores
- Altman Z-Score: 3.66, indicating a safe zone status.
- Piotroski Score: 4, reflecting average financial strength.
Which company has the best scores?
ON Semiconductor shows a higher Altman Z-Score (4.54 vs. 3.66) and a better Piotroski Score (6 vs. 4) compared to Ouster, indicating comparatively stronger financial stability and health based on these metrics.
Grades Comparison
Here is a comparison of the recent grades assigned to ON Semiconductor Corporation and Ouster, Inc.:
ON Semiconductor Corporation Grades
The table below summarizes recent grades from reputable grading companies for ON Semiconductor Corporation:
| Grading Company | Action | New Grade | Date |
|---|---|---|---|
| Truist Securities | Maintain | Hold | 2025-12-19 |
| Morgan Stanley | Maintain | Equal Weight | 2025-11-24 |
| Truist Securities | Maintain | Hold | 2025-11-04 |
| Morgan Stanley | Maintain | Equal Weight | 2025-11-04 |
| Rosenblatt | Maintain | Neutral | 2025-11-04 |
| TD Cowen | Maintain | Buy | 2025-11-04 |
| Baird | Maintain | Neutral | 2025-11-04 |
| UBS | Maintain | Neutral | 2025-10-27 |
| B of A Securities | Maintain | Neutral | 2025-09-05 |
| Susquehanna | Maintain | Positive | 2025-08-05 |
Overall, ON Semiconductor’s grades predominantly reflect a neutral to hold consensus, with a single buy rating and a positive outlook noted.
Ouster, Inc. Grades
The table below presents recent grades from recognized grading firms for Ouster, Inc.:
| Grading Company | Action | New Grade | Date |
|---|---|---|---|
| Cantor Fitzgerald | Upgrade | Overweight | 2025-11-07 |
| Cantor Fitzgerald | Upgrade | Overweight | 2025-11-06 |
| WestPark Capital | Maintain | Buy | 2025-11-05 |
| Rosenblatt | Maintain | Buy | 2025-11-05 |
| WestPark Capital | Upgrade | Buy | 2025-08-13 |
| Oppenheimer | Maintain | Outperform | 2025-07-16 |
| WestPark Capital | Downgrade | Hold | 2025-06-12 |
| WestPark Capital | Upgrade | Buy | 2025-05-09 |
| Rosenblatt | Maintain | Buy | 2025-03-21 |
| Cantor Fitzgerald | Maintain | Overweight | 2025-03-21 |
Ouster shows a generally positive trend in grades, with multiple upgrades and buy/overweight ratings, indicating favorable analyst sentiment.
Which company has the best grades?
Ouster, Inc. has received stronger and more frequent buy and overweight ratings compared to ON Semiconductor Corporation’s mainly neutral and hold grades. This suggests higher analyst confidence in Ouster’s prospects, which could influence investor sentiment toward more optimistic growth expectations.
Strengths and Weaknesses
The table below summarizes the key strengths and weaknesses of ON Semiconductor Corporation (ON) and Ouster, Inc. (OUST) based on their recent financial performance, market position, and innovation capacity.
| Criterion | ON Semiconductor Corporation (ON) | Ouster, Inc. (OUST) |
|---|---|---|
| Diversification | Highly diversified revenue streams across Power, Analog, and Intelligent Sensing groups, totaling over 7B USD in 2024 | Limited diversification with a single reportable segment generating 111M USD in 2024 |
| Profitability | Strong profitability with 22.21% net margin and favorable ROIC at 11.88% | Negative profitability, net margin at -87.35%, and negative ROIC at -50.84% |
| Innovation | Consistent investment in multiple semiconductor groups, showing growing ROIC trend | Early-stage company with growing ROIC but still value-destructive, indicating ongoing innovation challenges |
| Global presence | Established global operations with significant market share in semiconductor solutions | Smaller scale with limited global footprint and market penetration |
| Market Share | Significant presence in power and analog semiconductor markets | Niche player in sensor technology with limited market share |
Key takeaways: ON Semiconductor demonstrates strong diversification and profitability with a slightly favorable economic moat, making it a more stable investment. Ouster, despite innovation efforts and ROIC growth, remains unprofitable and value-destroying, posing higher risk for investors.
Risk Analysis
Below is a comparative risk table for ON Semiconductor Corporation (ON) and Ouster, Inc. (OUST) based on the most recent 2024 data:
| Metric | ON Semiconductor Corporation | Ouster, Inc. |
|---|---|---|
| Market Risk | Beta 1.57 – Moderate volatility | Beta 2.99 – High volatility |
| Debt level | Debt-to-Equity 0.38 – Low risk | Debt-to-Equity 0.11 – Very low risk |
| Regulatory Risk | Moderate – semiconductor industry regulations | Moderate – lidar tech and hardware compliance |
| Operational Risk | Low – diversified segments, 26.4K employees | High – small size (292 employees), early growth stage |
| Environmental Risk | Moderate – exposure to manufacturing emissions | Moderate – tech manufacturing impact, smaller scale |
| Geopolitical Risk | Moderate – global supply chains, US-based | Moderate – US-based, reliant on tech market stability |
The most likely and impactful risks lie with Ouster’s high market volatility and operational risks due to its small size and negative profitability, despite low debt. ON Semiconductor shows moderate market risk but benefits from stronger financial health and operational scale, reducing bankruptcy risk. Investors should weigh Ouster’s growth potential against its unfavorable margins and risk profile.
Which Stock to Choose?
ON Semiconductor Corporation has shown a favorable income statement with strong profitability, including a 22.21% net margin and 17.88% ROE. Its financial ratios are slightly favorable overall, supported by low debt levels and a solid interest coverage ratio, despite some unfavorable valuation metrics. The company’s debt remains manageable with a net debt to EBITDA of 0.27, and it holds a very favorable B- rating.
Ouster, Inc. displays a favorable income statement growth with a 33.41% revenue increase over one year but suffers from negative profitability, including an -87.35% net margin and -53.64% ROE. Its financial ratios are generally unfavorable, with low asset turnover and negative interest coverage, though it benefits from low debt levels. The company holds a very favorable C- rating despite these challenges.
For investors, ON Semiconductor’s slightly favorable financial ratios and stable profitability might appeal to those seeking quality and moderate risk exposure. Conversely, Ouster’s strong growth metrics paired with unfavorable profitability could be more aligned with risk-tolerant investors pursuing growth opportunities, recognizing the higher volatility and financial challenges involved.
Disclaimer: Investment carries a risk of loss of initial capital. The past performance is not a reliable indicator of future results. Be sure to understand risks before making an investment decision.
Go Further
I encourage you to read the complete analyses of ON Semiconductor Corporation and Ouster, Inc. to enhance your investment decisions: