The semiconductor industry remains a cornerstone of technological innovation, driving advancements in electronics and manufacturing. ON Semiconductor Corporation (ON) and Onto Innovation Inc. (ONTO) are two prominent players in this sector, each with unique approaches—ON focuses on intelligent power and sensing solutions, while Onto Innovation specializes in process control tools and metrology. In this analysis, I will help you determine which company presents the more compelling investment opportunity in 2026.

Table of contents
Companies Overview
I will begin the comparison between ON Semiconductor Corporation and Onto Innovation Inc. by providing an overview of these two companies and their main differences.
ON Semiconductor Corporation Overview
ON Semiconductor Corporation focuses on providing intelligent sensing and power solutions globally, supporting electrification in automotive and sustainable energy sectors. The company operates through three segments offering a broad range of semiconductor products and services, including analog, mixed-signal, and image sensor technologies. Headquartered in Scottsdale, AZ, ON Semiconductor holds a significant market presence with a workforce of 26,400 employees.
Onto Innovation Inc. Overview
Onto Innovation Inc. specializes in process control tools for semiconductor manufacturing, including defect inspection, optical metrology, and lithography systems. Its solutions target yield management and device packaging for diverse semiconductor and advanced packaging markets. Founded in 1940 and based in Wilmington, MA, Onto Innovation operates with approximately 1,551 employees and offers a comprehensive software portfolio alongside hardware products.
Key similarities and differences
Both companies operate in the semiconductor industry within the technology sector and serve global markets. ON Semiconductor emphasizes broad semiconductor product lines and power solutions, while Onto Innovation focuses on manufacturing process control and inspection tools. ON has a much larger workforce and market capitalization compared to Onto Innovation, reflecting different scale and product specialization within the same industry.
Income Statement Comparison
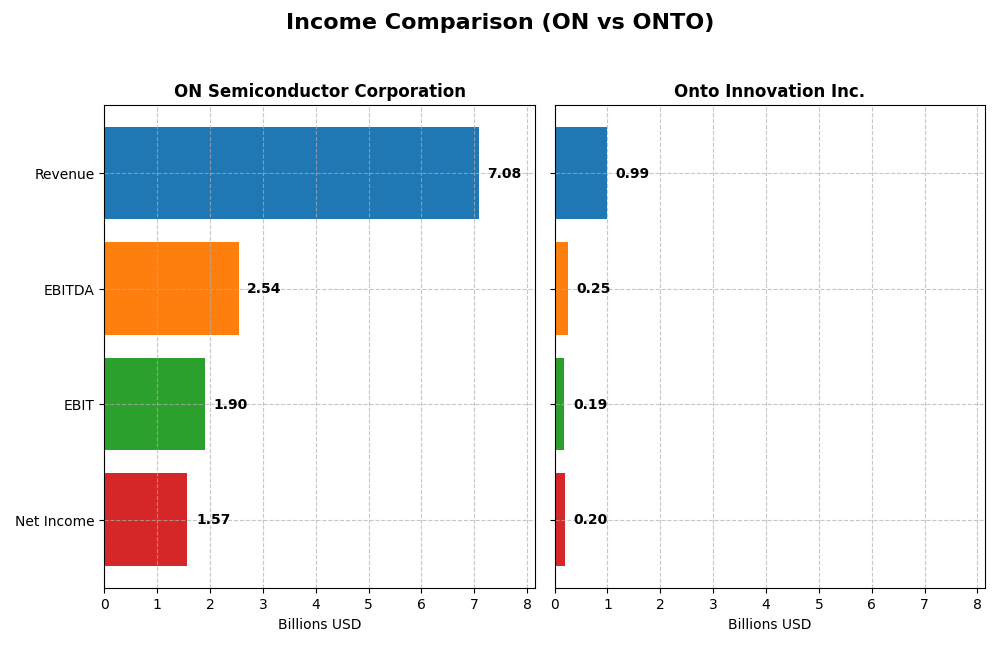
The table below compares key income statement metrics for ON Semiconductor Corporation and Onto Innovation Inc. for the fiscal year 2024.
| Metric | ON Semiconductor Corporation | Onto Innovation Inc. |
|---|---|---|
| Market Cap | 24.7B | 10.7B |
| Revenue | 7.08B | 987M |
| EBITDA | 2.54B | 249M |
| EBIT | 1.90B | 187M |
| Net Income | 1.57B | 202M |
| EPS | 3.68 | 4.09 |
| Fiscal Year | 2024 | 2024 |
Income Statement Interpretations
ON Semiconductor Corporation
ON Semiconductor’s revenue grew 34.77% from 2020 to 2024, with net income surging 571.56%, reflecting strong long-term expansion. Margins remain favorable, with a gross margin of 45.41% and net margin of 22.21%. However, in 2024, revenue declined by 14.19%, and net income fell 16.07%, indicating recent margin pressure and slower growth.
Onto Innovation Inc.
Onto Innovation showed robust revenue growth of 77.42% over 2020-2024, with net income increasing 550.02%, supported by consistent margin improvements. The company’s 2024 gross margin reached 52.19%, and net margin 20.43%. Last year, revenue rose 21.01%, and net income climbed 37.55%, highlighting accelerating growth and expanding profitability.
Which one has the stronger fundamentals?
Both companies present favorable income statement fundamentals, but Onto Innovation displays stronger momentum with 100% favorable metrics, including recent double-digit revenue and net income growth. ON Semiconductor, while showing solid long-term gains, experienced a recent decline in revenue and earnings. Margin stability favors ON, but Onto’s growth trajectory appears more robust.
Financial Ratios Comparison
The table below presents the most recent key financial ratios for ON Semiconductor Corporation and Onto Innovation Inc. as of the 2024 fiscal year-end, useful for evaluating operational efficiency and financial health.
| Ratios | ON Semiconductor Corporation | Onto Innovation Inc. |
|---|---|---|
| ROE | 17.88% | 10.47% |
| ROIC | 11.88% | 8.77% |
| P/E | 17.13 | 41.76 |
| P/B | 3.06 | 4.37 |
| Current Ratio | 5.06 | 8.69 |
| Quick Ratio | 3.38 | 7.00 |
| D/E (Debt to Equity) | 0.38 | 0.01 |
| Debt-to-Assets | 23.90% | 0.72% |
| Interest Coverage | 28.37 | 0 |
| Asset Turnover | 0.50 | 0.47 |
| Fixed Asset Turnover | 1.61 | 7.16 |
| Payout Ratio | 0% | 0% |
| Dividend Yield | 0% | 0% |
Interpretation of the Ratios
ON Semiconductor Corporation
ON Semiconductor shows a mix of strong and weak ratios, with favorable net margin at 22.21% and return on equity of 17.88%, but an unfavorable weighted average cost of capital at 10.17% and a high current ratio of 5.06. The company does not pay dividends, reflecting a likely reinvestment strategy or focus on growth rather than shareholder payouts, as indicated by a dividend yield of 0%.
Onto Innovation Inc.
Onto Innovation presents several favorable metrics such as a net margin of 20.43% and a very strong interest coverage ratio, yet it faces challenges with a high price-to-earnings ratio of 41.76 and an unfavorable asset turnover of 0.47. Like ON Semiconductor, Onto Innovation does not distribute dividends, possibly prioritizing reinvestment in research and development or expansion initiatives.
Which one has the best ratios?
ON Semiconductor has a slightly more favorable ratio profile, with 50% of its ratios rated favorable compared to Onto Innovation’s 42.86%. However, ON also has notable weaknesses, including a high current ratio and price-to-book ratio. Onto Innovation’s higher valuation multiples and weaker asset turnover contribute to a more neutral overall assessment.
Strategic Positioning
This section compares the strategic positioning of ON Semiconductor Corporation and Onto Innovation Inc., including market position, key segments, and exposure to technological disruption:
ON
- Large market cap of 24.65B with competitive pressure in global semiconductors industry.
- Diverse segments: Power Solutions, Analog Solutions, Intelligent Sensing driving revenues.
- Exposure through intelligent power and sensing technologies enabling automotive electrification.
ONTO
- Market cap of 10.68B facing competitive pressure in specialized semiconductor process control tools.
- Focused on process control tools, systems, software, and services for semiconductor manufacturing.
- Exposure via innovative metrology, lithography, and process control software development.
ON vs ONTO Positioning
ON demonstrates a diversified business model across multiple semiconductor segments with strong emphasis on automotive and power solutions. ONTO concentrates on niche process control and metrology systems, offering specialized tools and software. ON’s broader market exposure contrasts with ONTO’s focused approach.
Which has the best competitive advantage?
ON shows a slightly favorable moat with growing ROIC above WACC, indicating increasing profitability and value creation. ONTO has a slightly unfavorable moat, shedding value despite improving profitability, reflecting weaker competitive advantage.
Stock Comparison
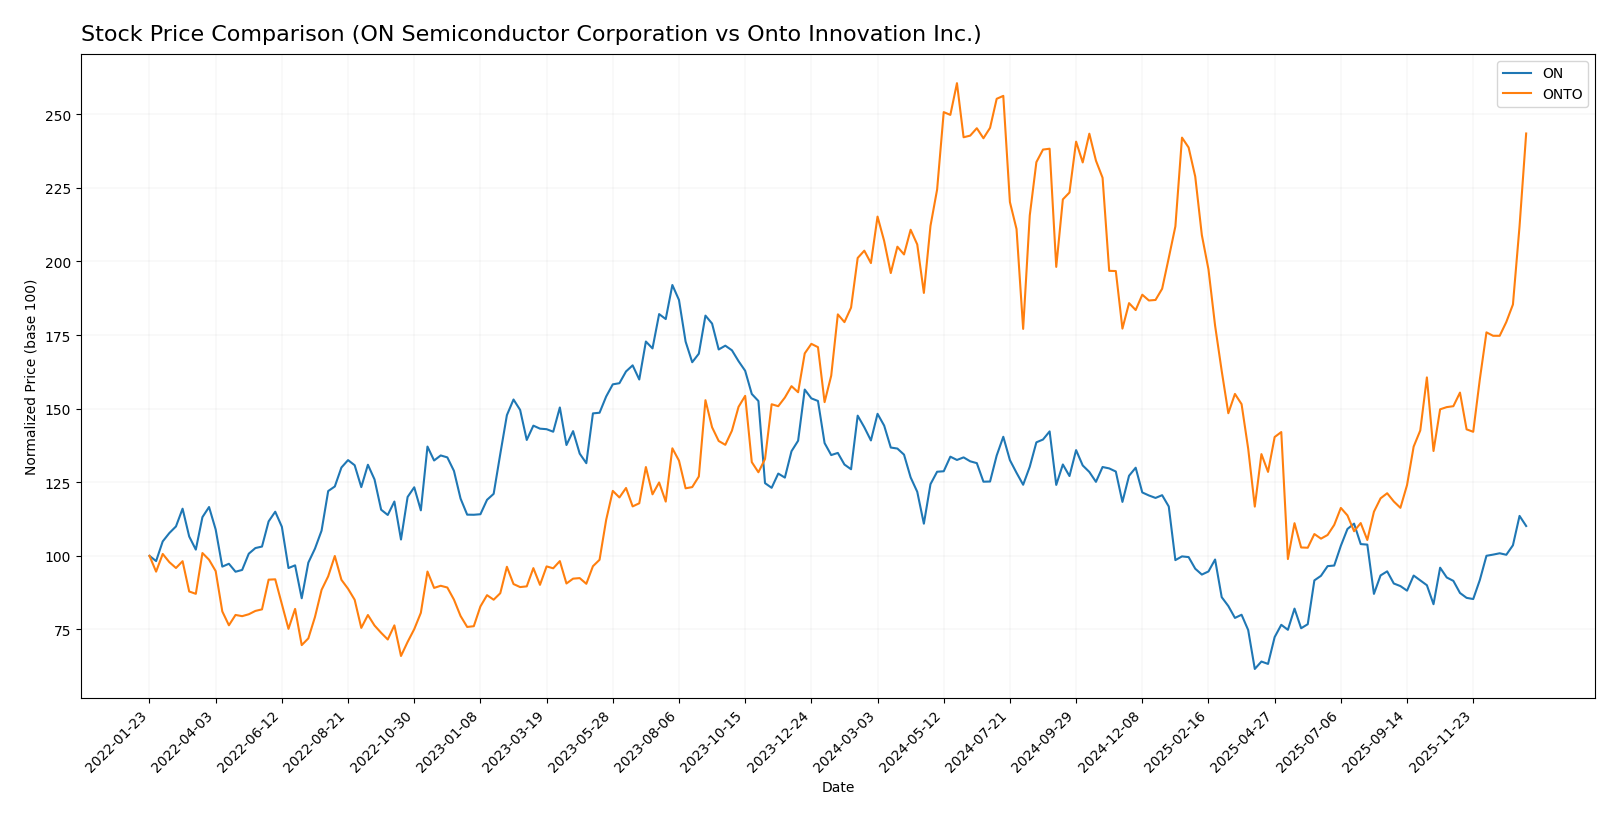
The stock price chart highlights significant divergence in trading dynamics over the past 12 months, with ON Semiconductor Corporation showing a prolonged bearish trend and Onto Innovation Inc. demonstrating strong bullish momentum and heightened volatility.
Trend Analysis
ON Semiconductor Corporation’s stock declined by 20.88% over the past year, confirming a bearish trend with accelerating downward pressure and moderate volatility (std dev 11.97). The stock saw a notable low at 33.7 and a high near 81.14.
Onto Innovation Inc. experienced a 22.07% price increase over the same period, indicating a bullish trend with acceleration and higher volatility (std dev 42.61). The stock’s price ranged from 88.5 to a peak of 233.14, reflecting strong upward momentum.
Comparing both stocks, Onto Innovation Inc. delivered the highest market performance with a positive 22.07% return, contrasting with ON Semiconductor’s significant 20.88% loss.
Target Prices
The current analyst consensus indicates a positive outlook for both ON Semiconductor Corporation and Onto Innovation Inc.
| Company | Target High | Target Low | Consensus |
|---|---|---|---|
| ON Semiconductor Corporation | 64 | 51 | 58.33 |
| Onto Innovation Inc. | 200 | 160 | 178 |
Analysts expect ON Semiconductor’s stock price to hover slightly below the current price of 60.28 USD, suggesting limited upside. Onto Innovation’s consensus target of 178 USD is notably below its current price of 217.85 USD, indicating potential overvaluation or profit-taking risk.
Analyst Opinions Comparison
This section compares analysts’ ratings and grades for ON Semiconductor Corporation and Onto Innovation Inc.:
Rating Comparison
ON Rating
- Rating: B- indicating a very favorable overall rating.
- Discounted Cash Flow Score: Moderate score of 3, suggesting balanced valuation.
- ROE Score: Moderate score of 2, reflecting average efficiency in equity use.
- ROA Score: Moderate score of 3, showing adequate asset utilization.
- Debt To Equity Score: Moderate score of 2, indicating average financial risk.
- Overall Score: Moderate score of 2 reflecting a balanced but cautious view.
ONTO Rating
- Rating: B+ indicating a very favorable overall rating.
- Discounted Cash Flow Score: Moderate score of 3, showing balanced valuation.
- ROE Score: Moderate score of 3, indicating better profit generation from equity.
- ROA Score: Favorable score of 4, demonstrating strong asset utilization.
- Debt To Equity Score: Favorable score of 4, indicating lower financial risk.
- Overall Score: Moderate score of 3 reflecting a somewhat stronger financial standing.
Which one is the best rated?
Based strictly on the provided data, Onto Innovation Inc. holds higher ratings and scores across most key metrics, including ROE, ROA, debt-to-equity, and overall score, compared to ON Semiconductor Corporation.
Scores Comparison
The scores comparison between ON Semiconductor Corporation and Onto Innovation Inc. is as follows:
ON Scores
- Altman Z-Score: 4.84, indicating a safe financial zone with low bankruptcy risk.
- Piotroski Score: 6, classified as average financial strength.
ONTO Scores
- Altman Z-Score: 34.16, indicating a safe financial zone with very low bankruptcy risk.
- Piotroski Score: 4, also classified as average financial strength.
Which company has the best scores?
Based on the provided data, ON has a lower Altman Z-Score but both are in the safe zone, while ON has a higher Piotroski Score, suggesting slightly stronger financial health than ONTO.
Grades Comparison
The following grades comparison summarizes the recent analyst ratings for ON Semiconductor Corporation and Onto Innovation Inc.:
ON Semiconductor Corporation Grades
This table presents recent grades and actions from major grading companies for ON Semiconductor Corporation.
| Grading Company | Action | New Grade | Date |
|---|---|---|---|
| Piper Sandler | Maintain | Overweight | 2026-01-07 |
| Truist Securities | Maintain | Hold | 2025-12-19 |
| Morgan Stanley | Maintain | Equal Weight | 2025-11-24 |
| Truist Securities | Maintain | Hold | 2025-11-04 |
| Baird | Maintain | Neutral | 2025-11-04 |
| Rosenblatt | Maintain | Neutral | 2025-11-04 |
| Morgan Stanley | Maintain | Equal Weight | 2025-11-04 |
| TD Cowen | Maintain | Buy | 2025-11-04 |
| UBS | Maintain | Neutral | 2025-10-27 |
| B of A Securities | Maintain | Neutral | 2025-09-05 |
ON Semiconductor’s grades mostly range from Hold to Buy, with no recent upgrades or downgrades, indicating stable analyst sentiment.
Onto Innovation Inc. Grades
This table shows the latest grades and actions from recognized grading firms for Onto Innovation Inc.
| Grading Company | Action | New Grade | Date |
|---|---|---|---|
| Stifel | Maintain | Hold | 2026-01-14 |
| Needham | Maintain | Buy | 2026-01-06 |
| Jefferies | Maintain | Buy | 2025-12-15 |
| B. Riley Securities | Maintain | Buy | 2025-11-18 |
| Needham | Maintain | Buy | 2025-11-18 |
| Evercore ISI Group | Maintain | Outperform | 2025-11-05 |
| Oppenheimer | Maintain | Outperform | 2025-10-14 |
| Stifel | Maintain | Hold | 2025-10-13 |
| B. Riley Securities | Maintain | Buy | 2025-10-10 |
| Jefferies | Upgrade | Buy | 2025-09-23 |
Onto Innovation’s ratings are predominantly Buy and Outperform, with an upgrade noted, reflecting a generally positive analyst outlook.
Which company has the best grades?
Both companies have a consensus rating of Buy, but Onto Innovation has a higher frequency of Buy and Outperform grades compared to ON Semiconductor’s more mixed Hold and Neutral ratings. This difference may influence investor perception of relative growth potential and risk.
Strengths and Weaknesses
Below is a comparative overview of key strengths and weaknesses for ON Semiconductor Corporation (ON) and Onto Innovation Inc. (ONTO) based on the latest financial and operational data.
| Criterion | ON Semiconductor Corporation (ON) | Onto Innovation Inc. (ONTO) |
|---|---|---|
| Diversification | Strong diversification with three main segments: Power Solutions (3.35B), Analog Solutions (2.61B), Intelligent Sensing (1.13B) in 2024 | Less diversified; heavily reliant on Systems and Software Revenue (850M), with smaller Parts (77M) and Service (60M) segments |
| Profitability | Favorable net margin (22.21%) and ROE (17.88%) with growing ROIC (11.88%) | Good net margin (20.43%), but neutral ROE (10.47%) and ROIC (8.77%); profitability improving but still shedding value |
| Innovation | Moderate innovation reflected in steady growth in ROIC (+156%) and solid product segments | High innovation focus with rapid ROIC growth (+344%), driven by Systems and Software, but currently value destructive |
| Global presence | Large global footprint supported by diversified product segments and stable asset turnover | Smaller global reach; strong fixed asset turnover (7.16) but weaker asset turnover (0.47) suggests operational challenges |
| Market Share | Significant presence in power and analog semiconductor markets with steady revenue growth | Niche market player in semiconductor equipment and software with concentrated revenue streams |
Key takeaway: ON Semiconductor offers a more balanced and diversified business with favorable profitability metrics and improving competitive position. Onto Innovation shows strong innovation and ROIC growth but still faces challenges in value creation and diversification. Investors should weigh ON’s stability against ONTO’s growth potential and risk.
Risk Analysis
Below is a summary table of key risks for ON Semiconductor Corporation (ON) and Onto Innovation Inc. (ONTO) based on the most recent data from 2024.
| Metric | ON Semiconductor Corporation (ON) | Onto Innovation Inc. (ONTO) |
|---|---|---|
| Market Risk | Beta 1.54 indicates above-average volatility in tech sector | Beta 1.46, moderately volatile in semiconductor tools |
| Debt level | Moderate debt-to-equity 0.38, manageable leverage | Very low debt-to-equity 0.01, very low financial risk |
| Regulatory Risk | Moderate, due to semiconductor export controls and automotive industry regulations | Moderate, exposed to semiconductor manufacturing standards and export rules |
| Operational Risk | Medium, given large scale and complex supply chains | Medium, dependent on advanced manufacturing and software development |
| Environmental Risk | Moderate, semiconductor manufacturing has notable environmental impact | Moderate, advanced equipment manufacturing involves resource use and waste |
| Geopolitical Risk | Elevated, semiconductor industry sensitive to US-China tensions | Elevated, supply chain and customer base exposed to global trade tensions |
The most impactful and likely risks for ON relate to market volatility and geopolitical tensions, especially given its automotive electrification focus and global supply chains. ON’s moderate debt level supports resilience. Onto Innovation shows very low debt, reducing financial risk, but faces operational and geopolitical risks from global supply chain dependencies. Both companies must carefully manage exposure to regulatory changes and geopolitical disruptions in the semiconductor sector.
Which Stock to Choose?
ON Semiconductor Corporation shows a favorable income evolution overall despite a recent 14% revenue decline. Its financial ratios are slightly favorable with strong profitability, controlled debt, and a solid B- rating, though some liquidity ratios are less favorable.
Onto Innovation Inc. exhibits a fully favorable income statement with double-digit revenue and net income growth. Its financial ratios are neutral overall, reflecting moderate profitability, minimal debt, and a B+ rating, supported by strong liquidity and asset efficiency.
Investors with a growth-oriented profile might find Onto Innovation’s accelerating income and improving profitability appealing, while those prioritizing financial stability and value creation could see ON Semiconductor’s stronger rating and moderate ratios as advantageous. The choice may depend on one’s risk tolerance and investment strategy.
Disclaimer: Investment carries a risk of loss of initial capital. The past performance is not a reliable indicator of future results. Be sure to understand risks before making an investment decision.
Go Further
I encourage you to read the complete analyses of ON Semiconductor Corporation and Onto Innovation Inc. to enhance your investment decisions: