In the fast-evolving technology sector, ON Semiconductor Corporation and MicroVision, Inc. stand out with their cutting-edge innovations in semiconductors and lidar sensing. ON Semiconductor drives advancements in power solutions for electric vehicles and sustainable energy, while MicroVision focuses on lidar for autonomous driving and augmented reality. This comparison explores their market positions and innovation strategies to help you decide which company could be the smarter addition to your investment portfolio.
Table of contents
Companies Overview
I will begin the comparison between ON Semiconductor Corporation and MicroVision, Inc. by providing an overview of these two companies and their main differences.
ON Semiconductor Corporation Overview
ON Semiconductor Corporation focuses on intelligent sensing and power solutions, primarily serving the automotive and industrial sectors. The company’s mission includes enabling electrification of vehicles and sustainable energy through a broad portfolio of analog and mixed-signal semiconductor products. Headquartered in Arizona, ON operates three segments and offers components critical for power management, signal conditioning, and imaging technologies.
MicroVision, Inc. Overview
MicroVision, Inc. develops lidar sensors and laser scanning technologies for automotive safety and autonomous driving applications. The company also designs micro-display systems for augmented reality headsets and interactive display modules for smart devices. Based in Washington, MicroVision targets original equipment manufacturers with innovative scanning and imaging solutions, leveraging micro-electromechanical systems and advanced optics.
Key similarities and differences
Both companies operate in the technology sector and focus on advanced sensing and imaging solutions. ON Semiconductor has a larger market cap and workforce, emphasizing power management and semiconductor components across multiple industries, while MicroVision is smaller with a niche focus on lidar and display technologies for automotive and AR markets. Their business models differ in scale and product diversification but share a commitment to innovation in hardware and sensing technologies.
Income Statement Comparison
The table below compares the key income statement metrics for ON Semiconductor Corporation and MicroVision, Inc. for the fiscal year 2024, highlighting their financial performance.
| Metric | ON Semiconductor Corporation | MicroVision, Inc. |
|---|---|---|
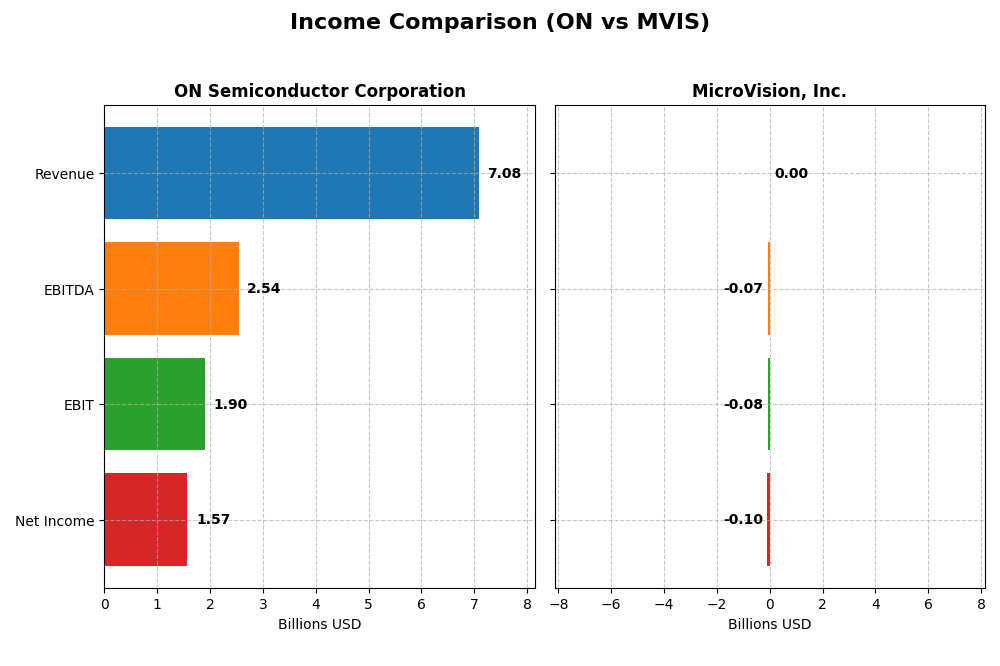
| Market Cap | 23.2B | 272M |
| Revenue | 7.08B | 4.70M |
| EBITDA | 2.54B | -71.0M |
| EBIT | 1.90B | -75.2M |
| Net Income | 1.57B | -96.9M |
| EPS | 3.68 | -0.46 |
| Fiscal Year | 2024 | 2024 |
Income Statement Interpretations
ON Semiconductor Corporation
ON Semiconductor showed a positive overall trend with a 35% revenue increase and a 572% net income growth from 2020 to 2024. Margins remain strong, with a 45.41% gross margin and a 22.21% net margin, both rated favorable. However, 2024 saw a decline in revenue by 14.2% and net income by 16.1%, indicating a slowdown despite solid margin levels.
MicroVision, Inc.
MicroVision experienced a 52% revenue growth over five years but a significant net income decline of 611%, reflecting ongoing losses. Margins are unfavorable, with a -60.35% gross margin and a -2063.78% net margin, underscoring persistent operational challenges. In 2024, revenue dropped 35.3%, and net income worsened further, continuing the negative profitability trend.
Which one has the stronger fundamentals?
ON Semiconductor displays stronger fundamentals, supported by sustained profitability, favorable margins, and significant net income growth over the period despite recent declines. In contrast, MicroVision struggles with unfavorable margins and deepening losses, despite revenue growth, indicating weaker financial health. The comparative analysis favors ON Semiconductor’s more stable and profitable income profile.
Financial Ratios Comparison
Below is a comparison of key financial ratios for ON Semiconductor Corporation and MicroVision, Inc. based on their most recent fiscal year data (2024).
| Ratios | ON Semiconductor Corporation | MicroVision, Inc. |
|---|---|---|
| ROE | 17.9% | -198.7% |
| ROIC | 11.9% | -83.7% |
| P/E | 17.1 | -2.83 |
| P/B | 3.06 | 5.63 |
| Current Ratio | 5.06 | 1.79 |
| Quick Ratio | 3.38 | 1.74 |
| D/E (Debt-to-Equity) | 0.38 | 1.06 |
| Debt-to-Assets | 23.9% | 42.6% |
| Interest Coverage | 28.4 | -19.2 |
| Asset Turnover | 0.50 | 0.039 |
| Fixed Asset Turnover | 1.61 | 0.20 |
| Payout ratio | 0 | 0 |
| Dividend yield | 0 | 0 |
Interpretation of the Ratios
ON Semiconductor Corporation
ON Semiconductor displays generally strong financial ratios with favorable net margin at 22.21%, ROE of 17.88%, and ROIC of 11.88%, indicating solid profitability and capital efficiency. However, the high current ratio of 5.06 and PB ratio of 3.06 raise some concerns about asset utilization and valuation. The company does not pay dividends, focusing on reinvestment and growth.
MicroVision, Inc.
MicroVision’s ratios are largely unfavorable, with a deeply negative net margin of -2063.78%, ROE at -198.72%, and ROIC at -83.73%, reflecting persistent losses and weak operational efficiency. While current and quick ratios are favorable, debt-to-equity and interest coverage ratios highlight financial stress. The company also does not pay dividends, likely prioritizing R&D and development.
Which one has the best ratios?
Comparing the two, ON Semiconductor holds a more favorable ratio profile with half of its key ratios positive and profitability metrics strong, despite some valuation issues. MicroVision faces significant financial challenges with most ratios unfavorable, reflecting higher risk. Therefore, ON Semiconductor has the better overall ratios based on this data.
Strategic Positioning
This section compares the strategic positioning of ON Semiconductor Corporation and MicroVision, Inc., focusing on market position, key segments, and exposure to technological disruption:
ON Semiconductor Corporation
- Large market cap (~23B), operating in competitive semiconductor industry.
- Diverse segments: power solutions, analog solutions, intelligent sensing driving revenues.
- Exposure through semiconductor tech supporting electrification and sensing markets.
MicroVision, Inc.
- Small market cap (~272M), niche player in hardware and equipment.
- Focused on lidar sensors, AR displays, and scanning technology for OEMs.
- Dependent on emerging lidar and scanning tech with potential disruption impact.
ON Semiconductor Corporation vs MicroVision, Inc. Positioning
ON shows a diversified approach with broad semiconductor applications and multiple revenue segments, offering scale advantages. MicroVision concentrates on specialized lidar and AR tech, which could limit scale but targets innovative niches.
Which has the best competitive advantage?
Both companies are shedding value relative to WACC, but ON’s growing ROIC trend indicates improving profitability, suggesting a slightly more favorable competitive position compared to MicroVision’s unfavorable MOAT evaluation.
Stock Comparison
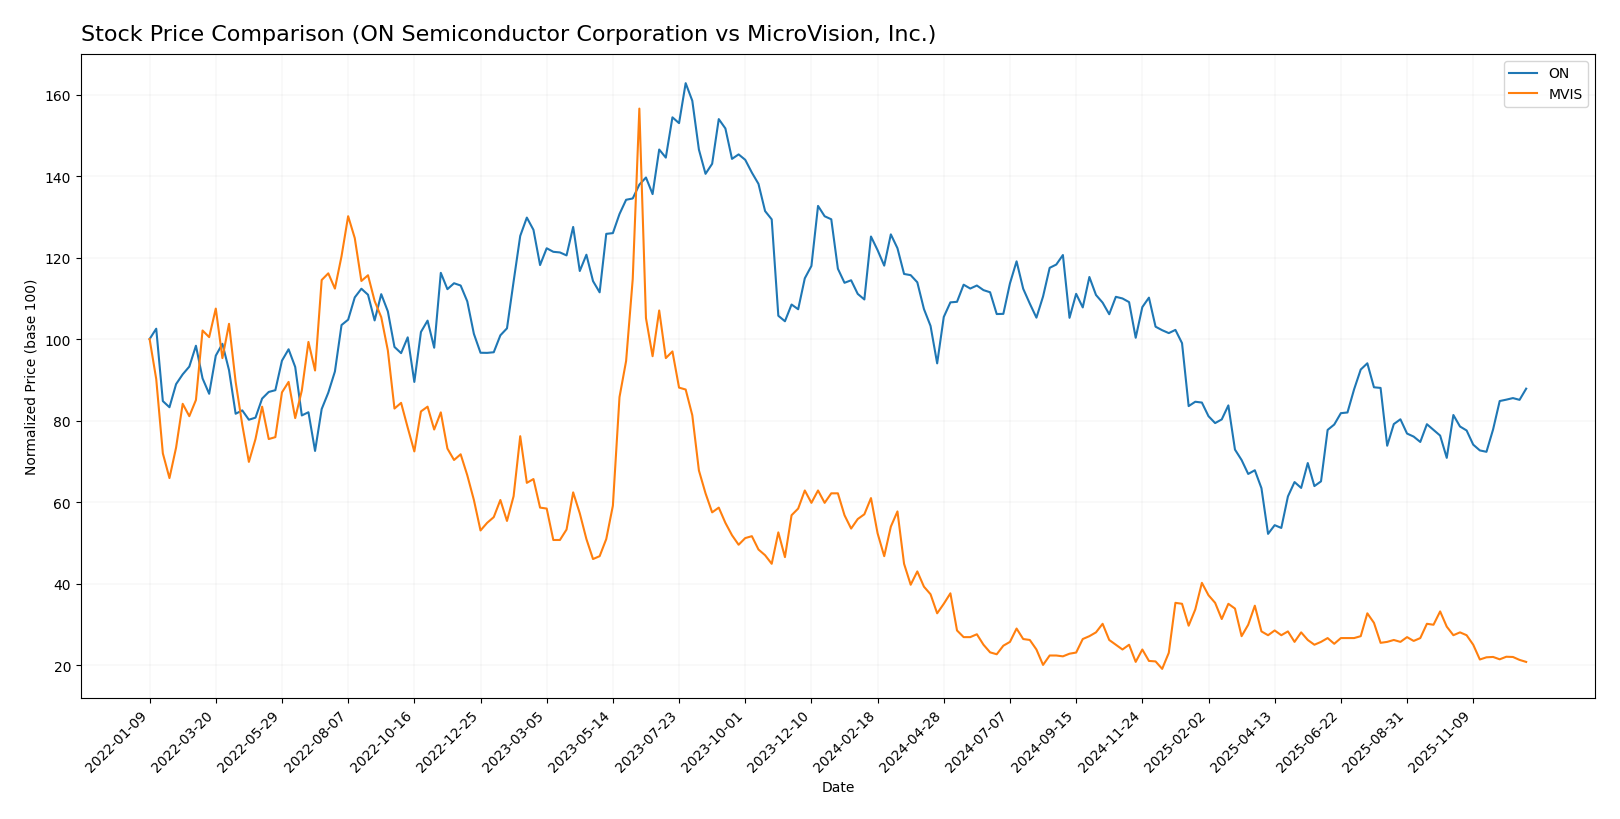
The stock prices of ON Semiconductor Corporation and MicroVision, Inc. have exhibited notable bearish trends over the past 12 months, with ON showing recent signs of recovery while MVIS continues to decline.
Trend Analysis
ON Semiconductor Corporation’s stock experienced a 29.83% decline over the past year, marking a bearish trend with accelerating downward momentum. Its price ranged from a low of 33.7 to a high of 81.14, with notable volatility at a 12.3 std deviation.
MicroVision, Inc. showed a sharper 65.91% drop over the same period, indicating a bearish trend with decelerating loss. The stock fluctuated between 0.82 and 2.61, with very low volatility at a 0.34 std deviation.
Comparing both stocks, ON Semiconductor has delivered higher market performance, especially given its recent 7.94% price increase versus MVIS’s continued 23.96% decline, reflecting stronger recovery dynamics.
Target Prices
Analyst consensus target prices indicate a generally positive outlook for these companies.
| Company | Target High | Target Low | Consensus |
|---|---|---|---|
| ON Semiconductor Corporation | 64 | 51 | 58.33 |
| MicroVision, Inc. | 5 | 5 | 5 |
ON Semiconductor’s consensus target price of 58.33 is slightly above its current price of 56.7, suggesting moderate upside potential. MicroVision’s target is steady at 5, far above its current price of 0.89, indicating strong growth expectations.
Analyst Opinions Comparison
This section compares analysts’ ratings and grades for ON Semiconductor Corporation and MicroVision, Inc.:
Rating Comparison
ON Rating
- Rating: B-, assessed as Very Favorable overall.
- Discounted Cash Flow Score: 4, indicating a Favorable valuation outlook.
- ROE Score: 2, considered Moderate in efficiency generating profit from equity.
- ROA Score: 3, Moderate effectiveness in asset utilization.
- Debt To Equity Score: 2, Moderate financial risk with balanced debt level.
- Overall Score: 3, Moderate overall financial standing.
MVIS Rating
- Rating: C-, assessed as Very Favorable overall.
- Discounted Cash Flow Score: 1, indicating a Very Unfavorable valuation outlook.
- ROE Score: 1, considered Very Unfavorable in profit generation efficiency.
- ROA Score: 1, Very Unfavorable asset utilization effectiveness.
- Debt To Equity Score: 2, Moderate financial risk with balanced debt level.
- Overall Score: 1, Very Unfavorable overall financial standing.
Which one is the best rated?
ON Semiconductor Corporation holds a stronger position with a B- rating and higher scores across discounted cash flow, ROE, ROA, and overall financial standing. MicroVision, Inc. has consistently lower scores except for debt to equity, where both are equal.
Scores Comparison
Here is a comparison of the Altman Z-Score and Piotroski Score for ON Semiconductor Corporation and MicroVision, Inc.:
ON Scores
- Altman Z-Score: 4.54, indicating a safe financial zone and low bankruptcy risk.
- Piotroski Score: 6, reflecting average financial strength and moderate value.
MVIS Scores
- Altman Z-Score: -6.63, indicating financial distress and high bankruptcy risk.
- Piotroski Score: 1, reflecting very weak financial strength and poor value.
Which company has the best scores?
Based strictly on the provided data, ON Semiconductor has stronger scores with a safe Altman Z-Score and an average Piotroski Score. MicroVision shows significant financial distress and very weak Piotroski strength.
Grades Comparison
The following section presents the latest reliable grades for ON Semiconductor Corporation and MicroVision, Inc.:
ON Semiconductor Corporation Grades
Here are the recent grades assigned by reputable grading companies to ON Semiconductor Corporation:
| Grading Company | Action | New Grade | Date |
|---|---|---|---|
| Truist Securities | Maintain | Hold | 2025-12-19 |
| Morgan Stanley | Maintain | Equal Weight | 2025-11-24 |
| Truist Securities | Maintain | Hold | 2025-11-04 |
| Morgan Stanley | Maintain | Equal Weight | 2025-11-04 |
| Rosenblatt | Maintain | Neutral | 2025-11-04 |
| TD Cowen | Maintain | Buy | 2025-11-04 |
| Baird | Maintain | Neutral | 2025-11-04 |
| UBS | Maintain | Neutral | 2025-10-27 |
| B of A Securities | Maintain | Neutral | 2025-09-05 |
| Susquehanna | Maintain | Positive | 2025-08-05 |
Overall, ON Semiconductor’s grades mostly range from Neutral to Hold, with a few Buy and Positive ratings, indicating a cautiously balanced outlook.
MicroVision, Inc. Grades
Below are the recent grades from recognized grading companies for MicroVision, Inc.:
| Grading Company | Action | New Grade | Date |
|---|---|---|---|
| D. Boral Capital | Maintain | Buy | 2025-12-16 |
| D. Boral Capital | Maintain | Buy | 2025-11-12 |
| WestPark Capital | Maintain | Buy | 2025-10-21 |
| WestPark Capital | Maintain | Buy | 2025-09-05 |
| D. Boral Capital | Maintain | Buy | 2025-09-02 |
| WestPark Capital | Maintain | Buy | 2025-08-27 |
| D. Boral Capital | Maintain | Buy | 2025-08-11 |
| D. Boral Capital | Maintain | Buy | 2025-05-21 |
| D. Boral Capital | Maintain | Buy | 2025-05-13 |
| WestPark Capital | Maintain | Buy | 2025-03-27 |
MicroVision, Inc. consistently received Buy ratings across all recent evaluations, signaling strong positive sentiment.
Which company has the best grades?
MicroVision, Inc. has received uniformly positive Buy ratings, contrasting with ON Semiconductor’s more mixed Neutral to Hold grades. This difference may influence investors’ perception of risk and growth potential in their portfolio decisions.
Strengths and Weaknesses
Below is a comparison table highlighting key strengths and weaknesses of ON Semiconductor Corporation (ON) and MicroVision, Inc. (MVIS) based on the latest financial and operational data.
| Criterion | ON Semiconductor Corporation (ON) | MicroVision, Inc. (MVIS) |
|---|---|---|
| Diversification | Strong diversification across Power, Analog, and Intelligent Sensing segments, with revenues of $3.35B, $2.61B, and $1.13B respectively in 2024 | Limited diversification, mostly focused on product revenue ($4.12M) with smaller contract and license revenues |
| Profitability | Favorable profitability with net margin 22.2%, ROIC 11.9%, and ROE 17.9% in 2024 | Poor profitability, net margin -2063.8%, ROIC -83.7%, ROE -198.7% in 2024 |
| Innovation | Consistent growth in ROIC (+156%) indicates improving capital efficiency and likely innovation | ROIC improving (+21%) but still negative, indicating some innovation progress but overall value destruction |
| Global presence | Solid global presence supported by diverse product lines and established market positions | Smaller scale with less global reach, focused on niche technology products |
| Market Share | Larger market share in semiconductor industry with stable revenue streams | Very small market share, early-stage or niche market with fluctuating revenues |
Key takeaways: ON Semiconductor shows clear strengths in diversification, profitability, and growing operational efficiency, positioning it as a more stable investment. MicroVision is still struggling with profitability and scale but shows signs of gradual improvement in innovation. Caution is advised with MVIS due to ongoing value destruction.
Risk Analysis
Below is a comparative risk analysis table for ON Semiconductor Corporation (ON) and MicroVision, Inc. (MVIS) based on the most recent financial year 2024.
| Metric | ON Semiconductor Corporation | MicroVision, Inc. |
|---|---|---|
| Market Risk | Beta 1.57 – moderately volatile | Beta 1.56 – moderately volatile |
| Debt Level | Low debt-to-equity 0.38 (favorable) | Higher debt-to-equity 1.06 (unfavorable) |
| Regulatory Risk | Moderate – semiconductor industry regulations | Moderate – lidar and AR tech regulations |
| Operational Risk | Moderate – diversified segments | High – niche tech with heavy R&D reliance |
| Environmental Risk | Moderate – focus on sustainable energy | Moderate – emerging tech with potential impacts |
| Geopolitical Risk | Moderate – global supply chain exposure | Moderate – US-based with global OEM clients |
Synthesizing these risks, ON Semiconductor presents a more stable financial profile with low leverage and strong operational diversity, making market and debt risks manageable. MicroVision faces significant financial distress risks, reflected in high debt levels and weak profitability, which increase operational and bankruptcy risk substantially. Investors should exercise caution with MVIS due to its distress zone Altman Z-score and very weak Piotroski score, indicating high financial vulnerability.
Which Stock to Choose?
ON Semiconductor Corporation shows a favorable income evolution with strong profitability metrics, including a 22.21% net margin and 17.88% ROE. It maintains low debt levels, a slightly favorable global financial ratio profile, and a very favorable company rating.
MicroVision, Inc. presents an unfavorable income performance marked by deep negative margins and returns, alongside high debt levels. Its financial ratios are predominantly unfavorable, and the company holds a very unfavorable overall rating, reflecting significant challenges.
Considering ratings and overall financial evaluations, ON Semiconductor might appear more suitable for investors seeking moderately stable growth and profitability, while MicroVision could be interpreted as appealing only to those with a high risk tolerance focused on potential turnaround opportunities.
Disclaimer: Investment carries a risk of loss of initial capital. The past performance is not a reliable indicator of future results. Be sure to understand risks before making an investment decision.
Go Further
I encourage you to read the complete analyses of ON Semiconductor Corporation and MicroVision, Inc. to enhance your investment decisions: