In the fast-evolving semiconductor industry, ON Semiconductor Corporation and Arm Holdings plc stand out as key innovators shaping technology’s future. ON Semiconductor focuses on intelligent power and sensing solutions, driving advancements in electric vehicles and sustainable energy. Arm Holdings excels in CPU architecture and licensing, powering a broad range of devices from smartphones to IoT systems. This article will help you decide which company offers the most compelling investment opportunity today.
Table of contents
Companies Overview
I will begin the comparison between ON Semiconductor Corporation and Arm Holdings plc by providing an overview of these two companies and their main differences.
ON Semiconductor Corporation Overview
ON Semiconductor Corporation focuses on providing intelligent sensing and power solutions globally. Its technologies support the electrification of the automotive industry, enabling lighter and longer-range electric vehicles, fast-charging systems, and sustainable energy applications. The company offers a broad portfolio of analog and mixed-signal semiconductor products and operates through three main segments: Power Solutions, Advanced Solutions, and Intelligent Sensing.
Arm Holdings plc Overview
Arm Holdings plc specializes in architecting, developing, and licensing CPU products and related technologies for semiconductor companies and OEMs. Its portfolio includes microprocessors, system IPs, GPUs, physical IPs, and software tools. Arm’s products are widely used across automotive, computing infrastructure, consumer technologies, and IoT markets. The company is headquartered in Cambridge, UK, and operates internationally as a subsidiary of Kronos II LLC.
Key similarities and differences
Both companies operate in the semiconductor industry with a focus on technology innovation, but ON Semiconductor emphasizes power solutions and sensing technologies, while Arm concentrates on CPU architecture and IP licensing. ON Semiconductor’s business model includes manufacturing and design services, whereas Arm’s primarily involves licensing its intellectual property. Their market reach is global, yet ON has a stronger presence in automotive electrification, while Arm targets diverse sectors through its processor designs.
Income Statement Comparison
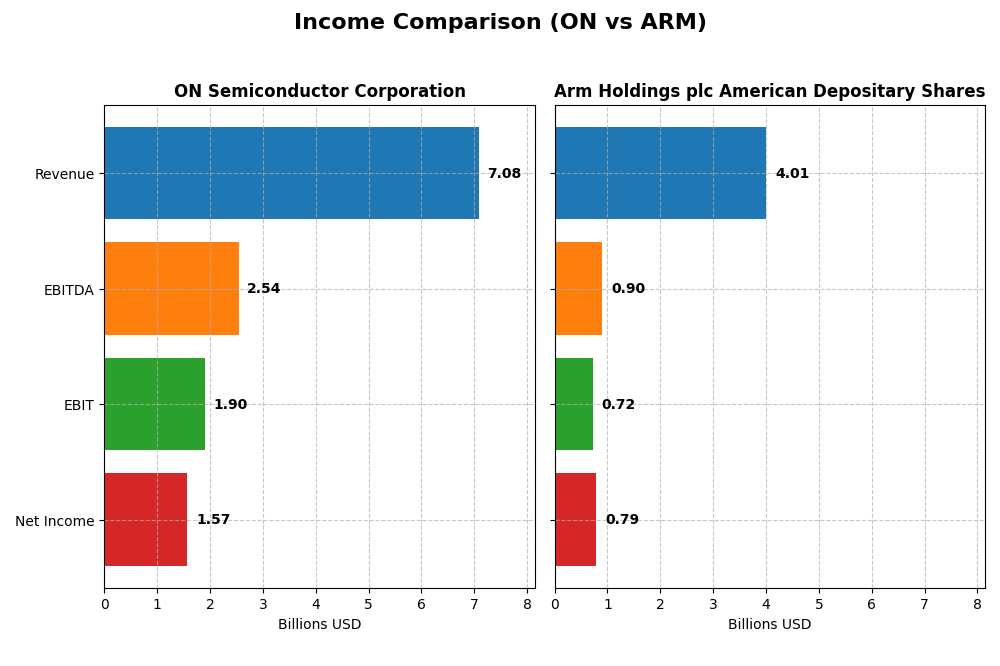
This table presents the latest fiscal year income statement metrics for ON Semiconductor Corporation and Arm Holdings plc American Depositary Shares, facilitating a straightforward financial comparison.
| Metric | ON Semiconductor Corporation | Arm Holdings plc American Depositary Shares |
|---|---|---|
| Market Cap | 23.2B | 121.2B |
| Revenue | 7.1B | 4.0B |
| EBITDA | 2.5B | 903M |
| EBIT | 1.9B | 720M |
| Net Income | 1.57B | 792M |
| EPS | 3.68 | 0.75 |
| Fiscal Year | 2024 | 2025 |
Income Statement Interpretations
ON Semiconductor Corporation
From 2020 to 2024, ON Semiconductor’s revenue grew by 34.77% and net income surged by 571.56%, reflecting strong overall growth. Margins remained favorable, with a gross margin of 45.41% and net margin of 22.21%. However, in 2024, revenue and net income declined by 14.19% and 16.07% respectively, indicating a slowdown, although margins stayed relatively robust.
Arm Holdings plc American Depositary Shares
Arm Holdings showed strong growth from 2021 to 2025, with revenue nearly doubling (+97.68%) and net income increasing by 104.12%. It maintained an exceptional gross margin of 94.86% and a net margin of 19.77%. In the latest year, revenue and net income rose by 23.94% and 108.83%, respectively, alongside significant improvements in EBIT and EPS, highlighting accelerating profitability.
Which one has the stronger fundamentals?
Arm Holdings demonstrates stronger fundamentals with consistently favorable income statement metrics, notably superior gross margins and rapid growth in revenue, EBIT, and net income over the past year. ON Semiconductor, while showing impressive long-term net income growth and solid margins, faced a recent downturn in revenue and earnings. Overall, Arm’s recent performance and margin strength suggest more robust income fundamentals.
Financial Ratios Comparison
The table below presents the most recent key financial ratios for ON Semiconductor Corporation and Arm Holdings plc, providing a direct comparison of their fiscal 2024 and 2025 performances respectively.
| Ratios | ON Semiconductor Corporation (2024) | Arm Holdings plc (2025) |
|---|---|---|
| ROE | 17.88% | 11.58% |
| ROIC | 11.88% | 10.28% |
| P/E | 17.13 | 141.58 |
| P/B | 3.06 | 16.40 |
| Current Ratio | 5.06 | 5.20 |
| Quick Ratio | 3.38 | 5.20 |
| D/E (Debt-to-Equity) | 0.38 | 0.05 |
| Debt-to-Assets | 23.90% | 3.99% |
| Interest Coverage | 28.37 | 0 (not reported) |
| Asset Turnover | 0.50 | 0.45 |
| Fixed Asset Turnover | 1.61 | 5.61 |
| Payout Ratio | 0% | 0% |
| Dividend Yield | 0% | 0% |
Interpretation of the Ratios
ON Semiconductor Corporation
ON Semiconductor’s ratios show strength in net margin (22.21%), ROE (17.88%), and ROIC (11.88%), indicating solid profitability and capital efficiency. However, the high current ratio (5.06) and PB ratio (3.06) raise concerns about asset utilization and valuation. The company does not pay dividends, likely focusing on reinvestment and growth strategies.
Arm Holdings plc American Depositary Shares
Arm’s net margin (19.77%) is favorable, but ROE (11.58%) and ROIC (10.28%) are weaker, with an elevated WACC (23.74%) and high P/E (141.58) suggesting valuation risks. The strong quick ratio (5.2) and low debt (D/E 0.05) indicate good liquidity and low leverage. Arm also does not pay dividends, possibly prioritizing innovation and expansion.
Which one has the best ratios?
ON Semiconductor demonstrates a more balanced and slightly favorable ratio profile with higher profitability and better returns on equity and invested capital. Arm shows strengths in liquidity and low debt but faces challenges with valuation and capital costs. Overall, ON’s ratios appear more robust in fundamental performance compared to Arm’s slightly unfavorable metrics.
Strategic Positioning
This section compares the strategic positioning of ON Semiconductor Corporation and Arm Holdings plc, focusing on market position, key segments, and exposure to technological disruption:
ON Semiconductor Corporation
- Mid-cap player in semiconductors with moderate competition pressure in power and sensing technologies.
- Diverse revenue streams: Power Solutions, Analog, and Intelligent Sensing segments drive business.
- Moderate exposure to disruption, focusing on electrification and sensing technologies in automotive and energy.
Arm Holdings plc American Depositary Shares
- Large-cap semiconductor IP licensor with strong competitive pressure and global reach.
- Concentrated on licensing CPU designs and royalties in automotive, computing, and IoT markets.
- High exposure to technological disruption, innovating in CPU architectures and system IP globally.
ON Semiconductor Corporation vs Arm Holdings plc Positioning
ON Semiconductor pursues a diversified approach across power, analog, and sensing markets, balancing multiple business drivers. Arm is more concentrated on IP licensing and royalties, focusing on microprocessors and system IP. ON’s broader segment spread contrasts with Arm’s specialized licensing model.
Which has the best competitive advantage?
Both companies are shedding value relative to cost of capital. ON shows a slightly favorable moat with growing ROIC, while Arm faces an unfavorable moat with stable but value-destroying profitability, indicating ON currently holds a marginally stronger competitive advantage.
Stock Comparison
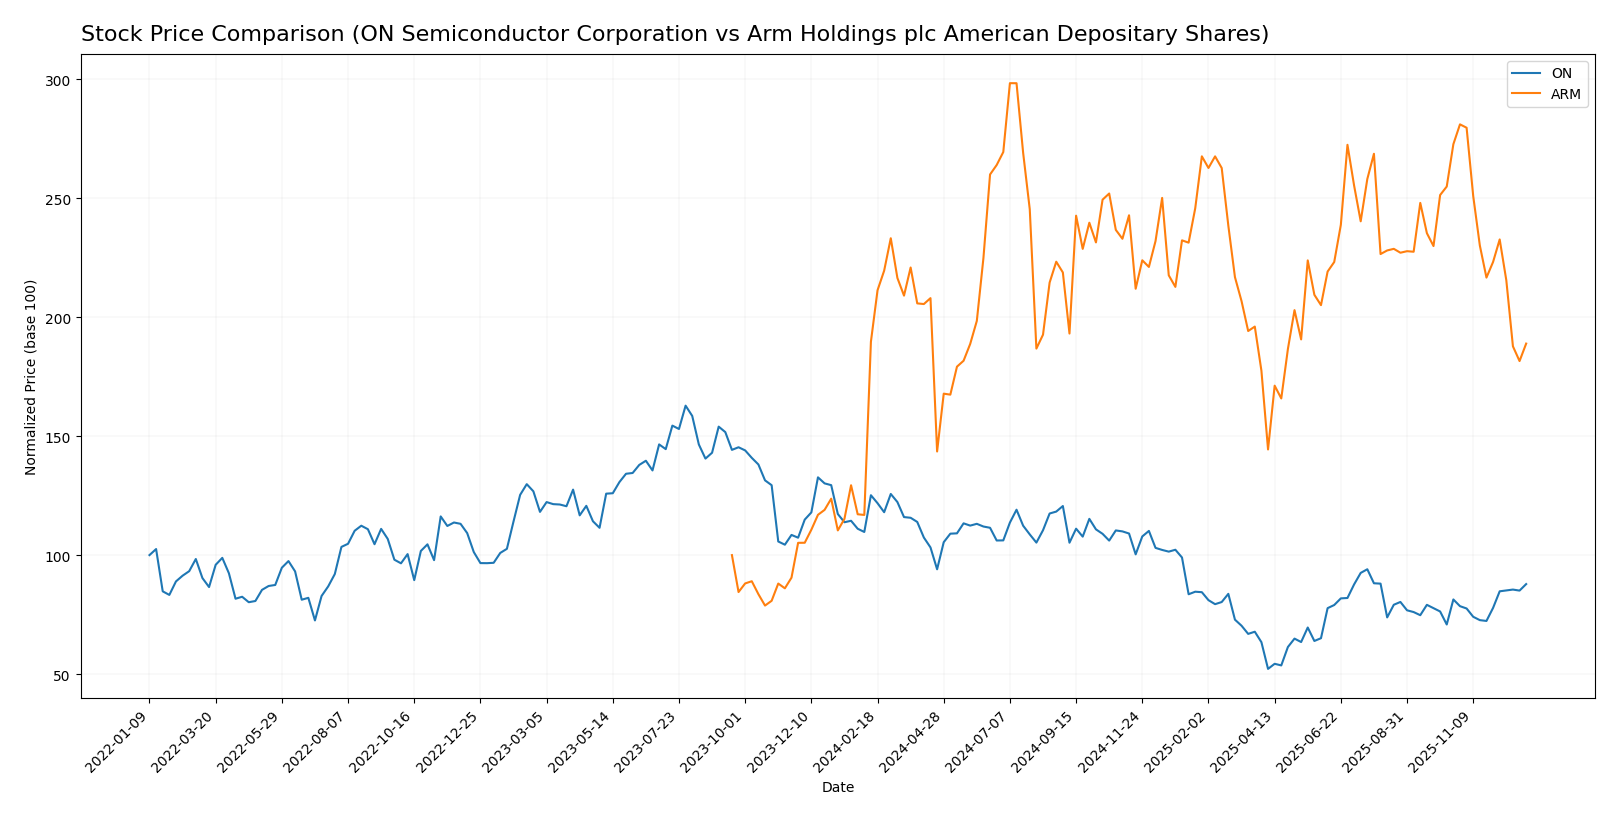
The stock price movements over the past 12 months reveal distinct trading dynamics, with ON Semiconductor Corporation showing a marked decline and recent recovery, while Arm Holdings plc ADS displays a near-flat yearly trend followed by sharper losses in the latest quarter.
Trend Analysis
ON Semiconductor Corporation’s stock experienced a bearish trend over the past year with a -29.83% price change, showing acceleration in its decline and a high volatility level with 12.3 standard deviation. Notable price extremes ranged from 33.7 to 81.14.
Arm Holdings plc ADS exhibited a nearly neutral yearly trend with a -0.42% price change but classified bearish due to the marginal loss. The trend decelerated, volatility was higher at 19.03 standard deviation, and the price fluctuated between 87.19 and 181.19.
Comparatively, ON Semiconductor’s stock delivered the lowest market performance with a substantial yearly drop, while Arm Holdings remained relatively stable before recent sharp declines, indicating ON faced the more pronounced negative trend.
Target Prices
The current analyst consensus provides a clear outlook on expected price ranges for ON Semiconductor Corporation and Arm Holdings plc American Depositary Shares.
| Company | Target High | Target Low | Consensus |
|---|---|---|---|
| ON Semiconductor Corporation | 64 | 51 | 58.33 |
| Arm Holdings plc American Depositary Shares | 210 | 120 | 173.33 |
Analysts expect ON Semiconductor shares to trade moderately above the current price of $56.7, signaling cautious optimism. Arm Holdings is forecasted significantly higher than its $114.73 current price, indicating strong growth expectations.
Analyst Opinions Comparison
This section compares analysts’ ratings and grades for ON Semiconductor Corporation and Arm Holdings plc American Depositary Shares:
Rating Comparison
ON Rating
- Rating: B-, rated as Very Favorable overall by analysts.
- Discounted Cash Flow Score: 4, considered Favorable, indicating a positive cash flow outlook.
- ROE Score: 2, Moderate efficiency in generating profit from equity.
- ROA Score: 3, Moderate asset utilization effectiveness.
- Debt To Equity Score: 2, Moderate financial risk with moderate debt levels.
- Overall Score: 3, Moderate overall financial standing assessment.
ARM Rating
- Rating: B-, also rated as Very Favorable overall by analysts.
- Discounted Cash Flow Score: 2, Moderate, suggesting less confidence in future cash flows.
- ROE Score: 3, Moderate but higher efficiency in profit generation from equity than ON.
- ROA Score: 4, Favorable, showing better asset utilization compared to ON.
- Debt To Equity Score: 4, Favorable, indicating a stronger balance sheet with lower financial risk.
- Overall Score: 3, Moderate overall financial standing assessment.
Which one is the best rated?
Both ON and ARM have the same overall rating of B- and an overall score of 3, indicating moderate financial standing. However, ARM scores better in return on equity, return on assets, and debt-to-equity metrics, suggesting stronger operational efficiency and financial stability compared to ON.
Scores Comparison
The scores comparison for ON Semiconductor Corporation and Arm Holdings plc American Depositary Shares is as follows:
ON Scores
- Altman Z-Score: 4.54, safe zone indicates low bankruptcy risk.
- Piotroski Score: 6, average financial strength rating.
ARM Scores
- Altman Z-Score: 32.36, safe zone with very low bankruptcy risk.
- Piotroski Score: 7, strong financial strength rating.
Which company has the best scores?
Based on the provided data, Arm Holdings has higher Altman Z-Score and Piotroski Score than ON Semiconductor, indicating stronger financial stability and health.
Grades Comparison
This section compares the recent grades assigned to ON Semiconductor Corporation and Arm Holdings plc American Depositary Shares:
ON Semiconductor Corporation Grades
The following table summarizes recent grades from reputable grading companies for ON Semiconductor Corporation:
| Grading Company | Action | New Grade | Date |
|---|---|---|---|
| Truist Securities | Maintain | Hold | 2025-12-19 |
| Morgan Stanley | Maintain | Equal Weight | 2025-11-24 |
| Truist Securities | Maintain | Hold | 2025-11-04 |
| Morgan Stanley | Maintain | Equal Weight | 2025-11-04 |
| Rosenblatt | Maintain | Neutral | 2025-11-04 |
| TD Cowen | Maintain | Buy | 2025-11-04 |
| Baird | Maintain | Neutral | 2025-11-04 |
| UBS | Maintain | Neutral | 2025-10-27 |
| B of A Securities | Maintain | Neutral | 2025-09-05 |
| Susquehanna | Maintain | Positive | 2025-08-05 |
Overall, ON Semiconductor’s grades generally reflect a neutral to hold consensus with occasional buy and positive ratings.
Arm Holdings plc American Depositary Shares Grades
The following table presents recent grades from reputable grading companies for Arm Holdings plc American Depositary Shares:
| Grading Company | Action | New Grade | Date |
|---|---|---|---|
| B of A Securities | Maintain | Buy | 2025-12-16 |
| Goldman Sachs | Downgrade | Sell | 2025-12-15 |
| Loop Capital | Maintain | Buy | 2025-11-12 |
| Rosenblatt | Maintain | Buy | 2025-11-06 |
| Barclays | Maintain | Overweight | 2025-11-06 |
| Mizuho | Maintain | Outperform | 2025-11-06 |
| Needham | Maintain | Hold | 2025-11-06 |
| UBS | Maintain | Buy | 2025-11-06 |
| TD Cowen | Maintain | Buy | 2025-11-06 |
| Keybanc | Maintain | Overweight | 2025-11-06 |
Arm Holdings’ grades show a stronger inclination toward buy and outperform ratings, with one recent downgrade to sell.
Which company has the best grades?
Arm Holdings has received generally more favorable grades, including multiple buy and outperform ratings, compared to ON Semiconductor’s predominantly neutral and hold grades. This could suggest higher analyst confidence in Arm Holdings’ prospects, potentially impacting investor sentiment differently for each company.
Strengths and Weaknesses
Below is a comparative overview of key strengths and weaknesses for ON Semiconductor Corporation and Arm Holdings plc based on their latest financial and strategic data.
| Criterion | ON Semiconductor Corporation | Arm Holdings plc American Depositary Shares |
|---|---|---|
| Diversification | High: Balanced revenue streams from Power Solutions (3.35B), Analog (2.61B), and Intelligent Sensing (1.13B) | Moderate: Revenue mainly from License and Royalty segments (1.84B and 2.17B) |
| Profitability | Favorable: Net margin 22.21%, ROIC 11.88%, ROE 17.88% | Mixed: Net margin 19.77% favorable, but ROIC 10.28% unfavorable, ROE 11.58% neutral |
| Innovation | Growing ROIC trend (+156%), indicating improving capital efficiency | Neutral ROIC trend, showing stable but no growth in profitability |
| Global presence | Strong: Diversified product groups serving various global markets | Strong: Global licensing and royalties in semiconductor IP market |
| Market Share | Moderate: Competitive semiconductor player without strong moat | Weaker: ROIC below WACC, indicating value destruction despite market presence |
Key takeaways: ON Semiconductor shows a balanced and diversified business model with improving profitability and solid financial ratios, suggesting potential value creation. Arm Holdings, while possessing strong licensing revenues and global reach, struggles with value destruction and high valuation multiples, signaling caution for investors.
Risk Analysis
Below is a comparison table summarizing key risks for ON Semiconductor Corporation (ON) and Arm Holdings plc (ARM) based on the most recent data.
| Metric | ON Semiconductor Corporation | Arm Holdings plc American Depositary Shares |
|---|---|---|
| Market Risk | Beta 1.57 (moderate volatility) | Beta 4.25 (high volatility) |
| Debt level | Debt-to-Equity 0.38 (low) | Debt-to-Equity 0.05 (very low) |
| Regulatory Risk | US-based, moderate regulatory exposure | UK-based, global operations including China, higher regulatory complexity |
| Operational Risk | Large workforce (26.4K), diversified segments | Smaller workforce (8.3K), heavy reliance on IP licensing |
| Environmental Risk | Exposure to semiconductor manufacturing impacts | Lower direct manufacturing footprint, moderate risk |
| Geopolitical Risk | US-centric, some global sales | Significant exposure to China, Taiwan, South Korea political risks |
In synthesis, ARM faces higher market and geopolitical risks due to its high beta and extensive operations in politically sensitive regions, while ON Semiconductor shows moderate market risk with stronger debt management and operational diversification. Both companies have no dividend yield, which may affect income-focused investors. ON’s financials indicate slightly more stable risk metrics overall.
Which Stock to Choose?
ON Semiconductor Corporation has shown a favorable overall income statement with a 34.77% revenue growth over 2020-2024 despite a recent 14.19% decline. Financial ratios reveal a slightly favorable profile with strong profitability and low debt, while its rating remains very favorable with a B- score. Its ROIC is growing but remains below WACC, indicating slight value shedding.
Arm Holdings plc American Depositary Shares exhibits robust income growth with a 23.94% revenue increase in the last year and strong profitability metrics. However, its financial ratios are slightly unfavorable overall, reflecting high valuations and moderate leverage. The company’s rating is very favorable (B-), supported by strong Altman Z and Piotroski scores, but its ROIC is below WACC, signaling value destruction.
Investors seeking growth might find Arm’s rapid income expansion and strong financial scores appealing, while those prioritizing improving profitability and moderate valuation metrics could view ON Semiconductor’s slightly favorable ratios and growing ROIC as positive. The choice may depend on the investor’s risk tolerance and preference for growth versus improving operational efficiency.
Disclaimer: Investment carries a risk of loss of initial capital. The past performance is not a reliable indicator of future results. Be sure to understand risks before making an investment decision.
Go Further
I encourage you to read the complete analyses of ON Semiconductor Corporation and Arm Holdings plc American Depositary Shares to enhance your investment decisions: