Home > Comparison > Industrials > ODFL vs CSX
The strategic rivalry between Old Dominion Freight Line and CSX Corporation shapes the competitive landscape of the Industrials sector. Old Dominion operates as a less-than-truckload (LTL) motor carrier, focusing on regional and national trucking services. CSX dominates rail-based freight transportation with an extensive rail network spanning 23 states. This analysis evaluates their distinct operational models to identify which offers superior risk-adjusted returns for a well-diversified portfolio.
Table of contents
Companies Overview
Old Dominion Freight Line and CSX Corporation each hold pivotal roles in North American freight transportation, shaping logistics across land networks.
Old Dominion Freight Line, Inc.: Premier Less-Than-Truckload Carrier
Old Dominion Freight Line dominates the less-than-truckload (LTL) trucking sector across the US and North America. It generates revenue by providing regional, inter-regional, and national LTL services, complemented by value-added offerings like container drayage and supply chain consulting. In 2021, the company emphasized expanding its fleet and service centers, reinforcing its asset-light yet extensive network for expedited freight delivery.
CSX Corporation: Rail Freight Network Leader
CSX operates a vast rail-based freight transportation system spanning 19,500 route miles throughout 23 US states and parts of Canada. Its core revenue comes from hauling diverse commodities—chemicals, automotive products, coal—and providing intermodal and drayage services. The 2021 focus centered on optimizing its rail-to-truck transfer capabilities and expanding intermodal terminals to enhance connectivity and efficiency in freight movement.
Strategic Collision: Similarities & Divergences
Both companies prioritize freight transport but diverge in their modal approaches—Old Dominion with trucking’s speed and flexibility, CSX with rail’s volume and cost-efficiency. They compete primarily in the intermodal logistics market, vying for shippers seeking integrated supply chains. Their investment profiles differ sharply: Old Dominion leverages fleet expansion for nimble service, while CSX invests in infrastructure to sustain heavy haul capacity, reflecting distinct risk-return dynamics.
Income Statement Comparison
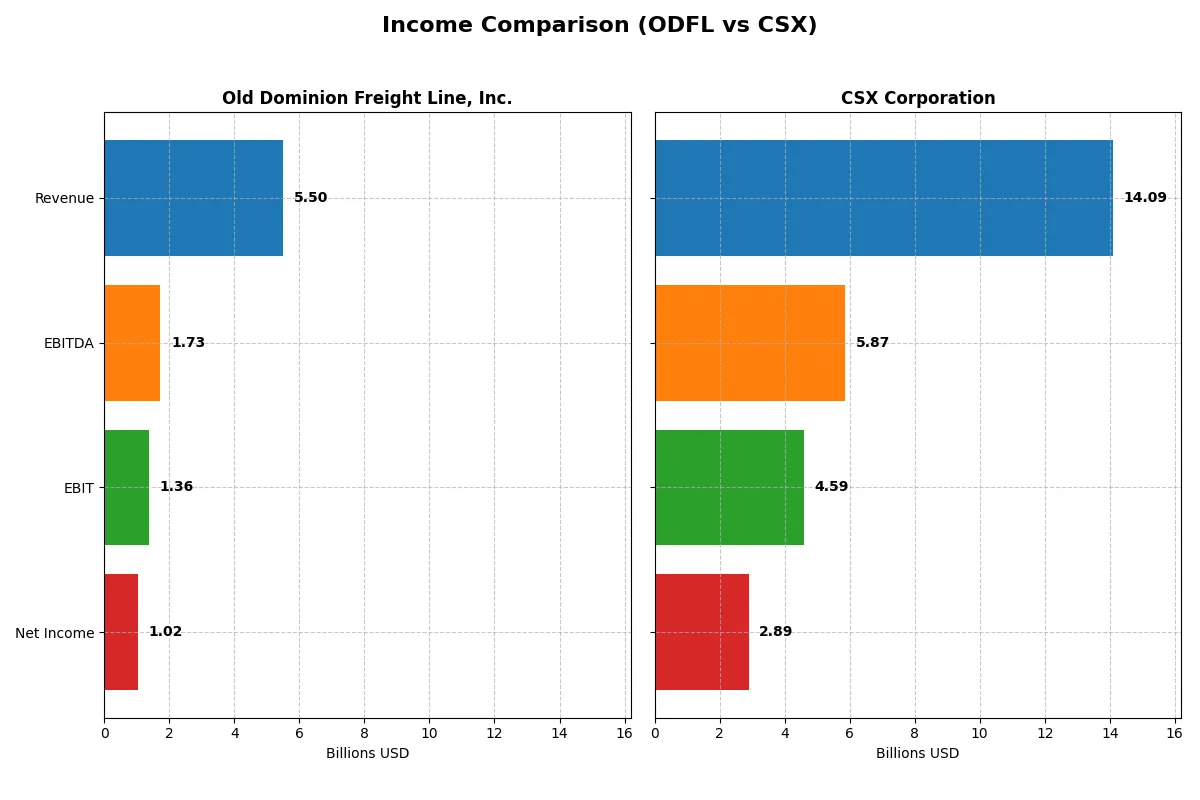
The following data dissects the core profitability and scalability of both corporate engines to reveal who dominates the bottom line:
| Metric | Old Dominion Freight Line, Inc. (ODFL) | CSX Corporation (CSX) |
|---|---|---|
| Revenue | 5.50B | 14.09B |
| Cost of Revenue | 3.73B | 9.41B |
| Operating Expenses | 406M | 164M |
| Gross Profit | 1.77B | 4.69B |
| EBITDA | 1.73B | 5.87B |
| EBIT | 1.36B | 4.59B |
| Interest Expense | 296K | 844M |
| Net Income | 1.02B | 2.89B |
| EPS | 4.85 | 1.54 |
| Fiscal Year | 2025 | 2025 |
Income Statement Analysis: The Bottom-Line Duel
This income statement comparison reveals how efficiently Old Dominion Freight Line and CSX Corporation convert revenue into profit, exposing their operational strengths.
Old Dominion Freight Line, Inc. Analysis
Old Dominion’s revenue dipped 5.5% to $5.5B in 2025, with net income falling 13.7% to $1.02B. Its gross margin remains healthy at 32.2%, while the net margin stands at a robust 18.6%. Despite recent declines, ODFL sustains operational efficiency and maintains favorable margins, reflecting solid control over costs.
CSX Corporation Analysis
CSX reported a 3.1% revenue decline to $14.1B in 2025, with net income dropping 16.7% to $2.89B. The company holds a better gross margin of 33.3% and a stronger net margin of 20.5%. However, higher interest expenses pressure profitability. CSX’s scale supports margin strength, but recent margin erosion signals operational challenges.
Margin Power vs. Scale Efficiency
CSX commands greater revenue and net income scale with superior margins but faces margin pressure from interest costs. Old Dominion offers slightly lower scale but preserves solid margin health and operational efficiency. For investors, ODFL’s tighter cost control presents a cleaner margin profile, while CSX’s size underpins its market influence despite margin headwinds.
Financial Ratios Comparison
These vital ratios act as a diagnostic tool to expose the underlying fiscal health, valuation premiums, and capital efficiency of each company:
| Ratios | Old Dominion Freight Line, Inc. (ODFL) | CSX Corporation (CSX) |
|---|---|---|
| ROE | 27.94% (2024) | 21.95% (2025) |
| ROIC | 23.58% (2024) | -8.13% (2025) |
| P/E | 32.02 (2024) | 23.39 (2025) |
| P/B | 8.95 (2024) | 5.13 (2025) |
| Current Ratio | 1.33 (2024) | 0.15 (2025) |
| Quick Ratio | 1.33 (2024) | 0.15 (2025) |
| D/E | 0.04 (2024) | 1.43 (2025) |
| Debt-to-Assets | 3.06% (2024) | 43.21% (2025) |
| Interest Coverage | 7,283x (2024) | 5.36x (2025) |
| Asset Turnover | 1.06 (2024) | 0.32 (2025) |
| Fixed Asset Turnover | 1.29 (2024) | N/A |
| Payout ratio | 18.85% (2024) | 33.64% (2025) |
| Dividend yield | 0.59% (2024) | 1.44% (2025) |
| Fiscal Year | 2024 | 2025 |
Efficiency & Valuation Duel: The Vital Signs
Ratios act as a company’s DNA, exposing hidden risks and operational strengths critical to investor decisions.
Old Dominion Freight Line, Inc.
Old Dominion shows a strong net margin of 18.63%, reflecting operational efficiency. However, its zero reported ROE and ROIC raise concerns about capital returns. The stock appears expensive with a P/E of 32.15. Dividend yield is low at 0.71%, suggesting limited shareholder payouts and possible reinvestment elsewhere.
CSX Corporation
CSX posts a favorable net margin of 20.5% and a robust ROE of 21.95%, indicating effective equity utilization. The valuation is moderate with a P/E of 23.39. Despite higher debt levels, interest coverage remains healthy at 5.44. Dividend yield stands at 1.44%, balancing returns with growth prospects.
Operational Efficiency vs. Valuation Discipline
Old Dominion’s operational margins impress but lack of returns on equity and capital dampens appeal, paired with a stretched valuation. CSX delivers better shareholder returns and a more balanced valuation despite elevated leverage. Risk-averse investors may favor CSX’s steadier profile, while growth-focused investors might scrutinize Old Dominion’s reinvestment strategy.
Which one offers the Superior Shareholder Reward?
I observe that Old Dominion Freight Line (ODFL) pays a modest 0.71% dividend yield with a conservative 23% payout ratio and robust free cash flow coverage. Its steady dividend growth complements a disciplined buyback program, enhancing total return sustainably. Conversely, CSX offers a higher 1.44% dividend yield but with a 34% payout ratio and weaker free cash flow coverage, coupled with heavier leverage that may constrain buybacks. CSX’s aggressive distribution risks long-term sustainability. I conclude ODFL’s balanced dividend and buyback strategy delivers superior shareholder reward and long-term value in 2026.
Comparative Score Analysis: The Strategic Profile
The radar chart reveals the fundamental DNA and trade-offs of Old Dominion Freight Line, Inc. and CSX Corporation, highlighting their contrasting financial strengths and vulnerabilities:

Old Dominion Freight Line exhibits a more balanced profile with top scores in ROE, ROA, and Debt/Equity, indicating efficient asset use and a conservative capital structure. CSX matches on ROE but lags in Debt/Equity, signaling higher financial risk. Both share moderate DCF scores, but both suffer from weak valuation metrics, especially in price-to-book.
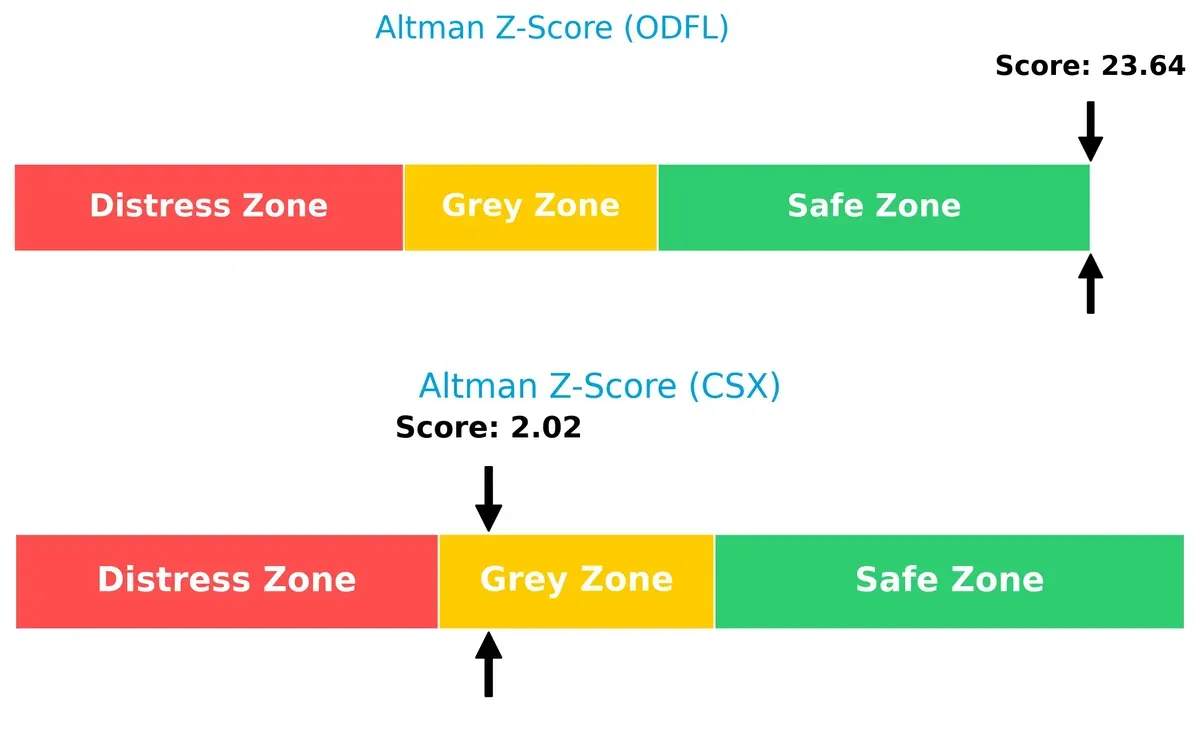
Bankruptcy Risk: Solvency Showdown
Old Dominion’s Altman Z-Score of 23.64 places it firmly in the safe zone, while CSX’s 2.02 hovers in the grey zone. This gap signals a stark difference in long-term survival resilience amid economic cycles:
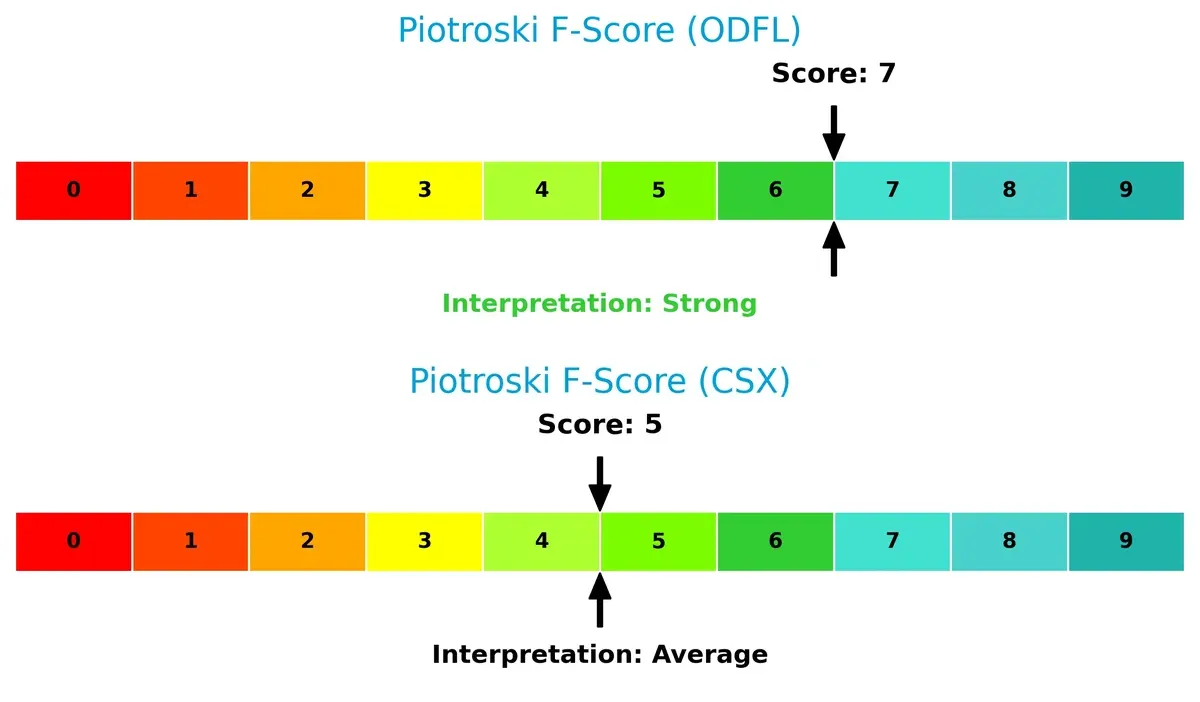
Financial Health: Quality of Operations
Old Dominion’s Piotroski F-Score of 7 suggests strong financial health, reflecting solid profitability and efficient operations. CSX’s score of 5 indicates average financial quality with potential red flags in internal metrics compared to its peer:
How are the two companies positioned?
This section dissects the operational DNA of ODFL and CSX by comparing their revenue distribution by segment and internal dynamics. The goal is to confront their economic moats and reveal which model offers the most resilient competitive advantage today.
Revenue Segmentation: The Strategic Mix
This visual comparison dissects how Old Dominion Freight Line, Inc. and CSX Corporation diversify their income streams and reveals their primary sector bets:
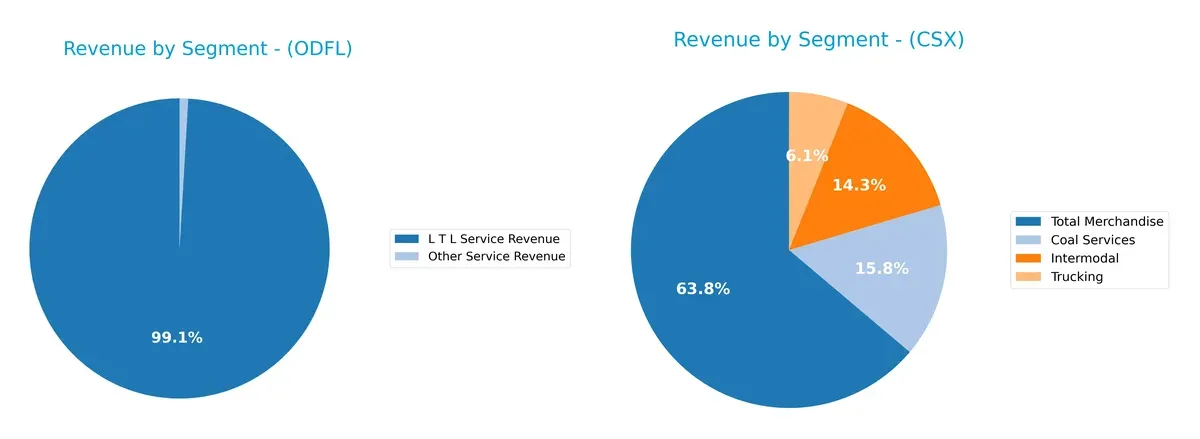
Old Dominion Freight Line relies heavily on its L T L Service Revenue, generating about $5.76B in 2024, anchoring its revenue with minimal diversification. In contrast, CSX Corporation boasts a broader portfolio, with Total Merchandise at $8.9B complemented by Coal Services ($2.2B), Intermodal ($2B), and Trucking ($844M). CSX’s mix reduces concentration risk, leveraging infrastructure dominance, while ODFL’s focus signals vulnerability but strong niche expertise.
Strengths and Weaknesses Comparison
This table compares the strengths and weaknesses of Old Dominion Freight Line (ODFL) and CSX Corporation (CSX):
ODFL Strengths
- Strong net margin at 18.63%
- Favorable debt-to-assets and interest coverage ratios
- Low debt levels support financial stability
CSX Strengths
- Higher net margin at 20.5%
- Strong return on equity at 21.95%
- Robust interest coverage ratio of 5.44
ODFL Weaknesses
- Zero return on equity and ROIC signals poor capital efficiency
- Unfavorable liquidity ratios
- High P/E ratio suggests overvaluation
CSX Weaknesses
- Negative ROIC at -813.48% reflects poor capital returns
- Elevated debt-to-equity ratio at 1.43
- Low liquidity ratios pose short-term risks
Both companies show strengths in profitability metrics but face challenges in capital efficiency and liquidity. ODFL’s low leverage contrasts with CSX’s higher debt burden, impacting risk profiles and strategic flexibility.
The Moat Duel: Analyzing Competitive Defensibility
A structural moat alone shields long-term profits from relentless competitive pressures and market disruption. Let’s dissect the competitive moats of two transport giants:
Old Dominion Freight Line, Inc.: Switching Costs and Service Network Moat
Old Dominion leverages high switching costs through its expansive LTL service network, reflected in stable gross margins near 32%. Revenue dips in 2025 hint at pressure, but new value-added logistics services could deepen its moat.
CSX Corporation: Asset-Intensive Scale and Rail Network Moat
CSX’s moat stems from its vast rail infrastructure and scale economies, enabling superior EBIT margins above 32%. Yet, its declining ROIC and shrinking margins warn of eroding profitability despite expansion opportunities in intermodal freight.
Scale Infrastructure vs. Service Network: Who Holds the Deeper Moat?
Both firms face margin and growth headwinds, but Old Dominion’s customer lock-in and service diversification create a wider moat. CSX’s asset-heavy model suffers from value destruction and declining returns, making Old Dominion better positioned to defend market share in 2026.
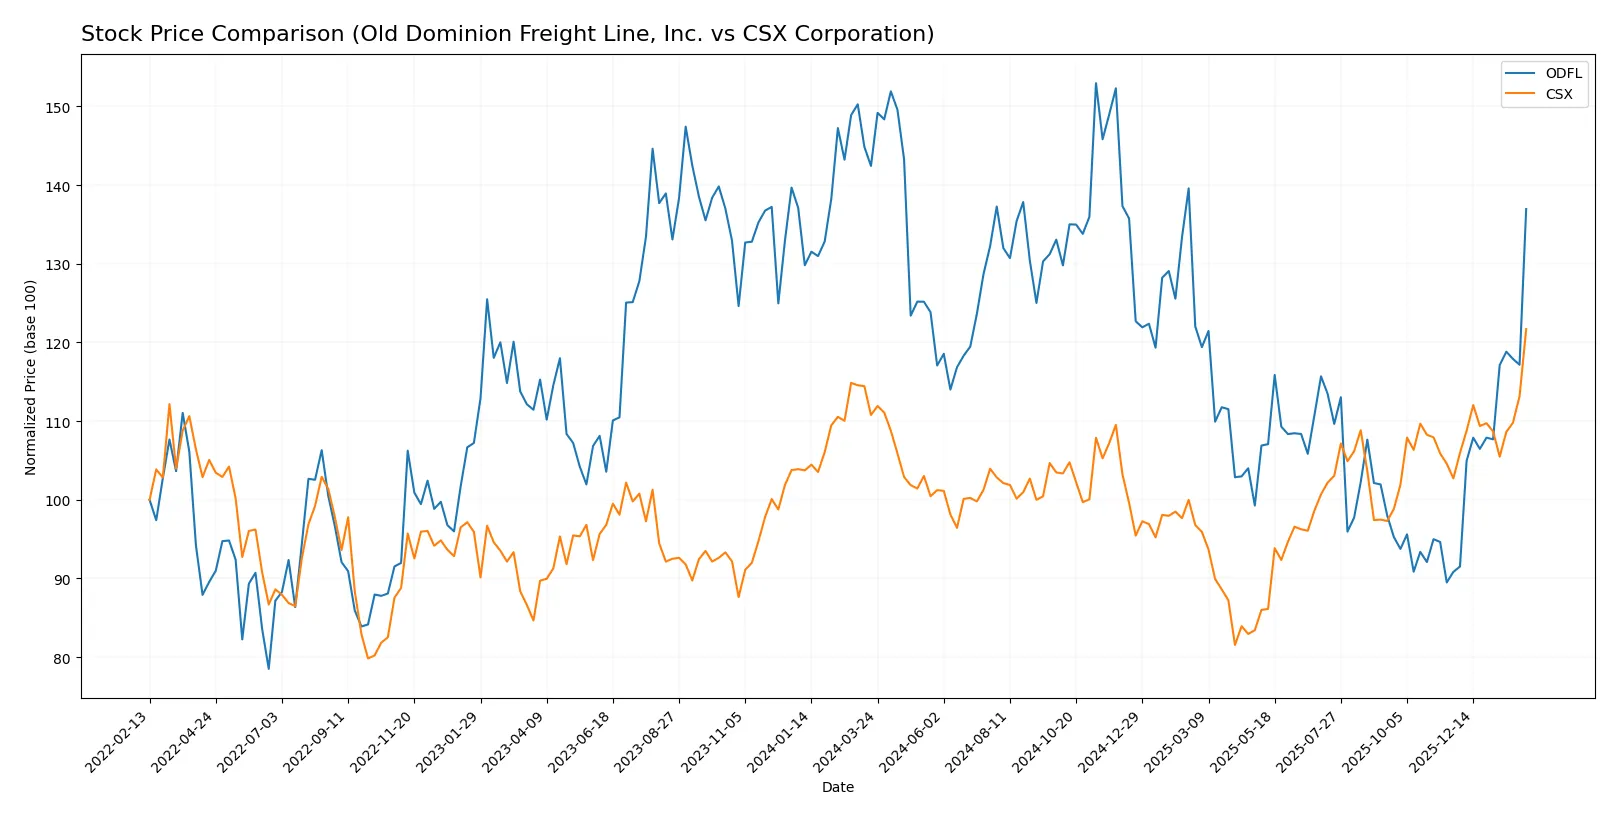
Which stock offers better returns?
Stock prices show contrasting dynamics over the past year, with Old Dominion Freight Line experiencing a bearish trend overall but a strong recent rebound, while CSX maintains a steady bullish trajectory with moderate volatility.
Trend Comparison
Old Dominion Freight Line’s stock declined 3.84% over the past year, marking a bearish trend with accelerating downward momentum. The price ranged from 132.29 to 226.11, exhibiting high volatility (std dev 24.41).
CSX’s stock gained 9.85% over the same period, reflecting a bullish trend with accelerating growth. Price volatility remains low (std dev 2.36), and the range was between 27.21 and 40.61.
CSX outperformed Old Dominion Freight Line overall, delivering the highest market return with steady, less volatile price appreciation.
Target Prices
Analysts present a clear target price consensus for Old Dominion Freight Line and CSX Corporation.
| Company | Target Low | Target High | Consensus |
|---|---|---|---|
| Old Dominion Freight Line, Inc. | 138 | 232 | 189 |
| CSX Corporation | 30 | 45 | 39 |
For Old Dominion Freight Line, the consensus target of 189 sits slightly below the current price of 202.47, signaling moderate caution. CSX’s consensus target of 39 is just under today’s price of 40.61, reflecting tempered upside expectations.

Don’t Let Luck Decide Your Entry Point
Optimize your entry points with our advanced ProRealTime indicators. You’ll get efficient buy signals with precise price targets for maximum performance. Start outperforming now!
How do institutions grade them?
Old Dominion Freight Line, Inc. Grades
The following table summarizes recent grades issued by reputable firms for Old Dominion Freight Line, Inc.:
| Grading Company | Action | New Grade | Date |
|---|---|---|---|
| Jefferies | Maintain | Hold | 2026-02-05 |
| UBS | Maintain | Neutral | 2026-02-05 |
| TD Cowen | Maintain | Hold | 2026-02-05 |
| JP Morgan | Maintain | Neutral | 2026-02-05 |
| Morgan Stanley | Maintain | Overweight | 2026-02-05 |
| Wells Fargo | Maintain | Underweight | 2026-02-05 |
| Baird | Downgrade | Underperform | 2026-02-05 |
| Evercore ISI Group | Maintain | In Line | 2026-02-05 |
| Stifel | Maintain | Buy | 2026-01-21 |
| Truist Securities | Maintain | Buy | 2026-01-15 |
CSX Corporation Grades
Below is a summary of recent grades from recognized analysts for CSX Corporation:
| Grading Company | Action | New Grade | Date |
|---|---|---|---|
| Bernstein | Maintain | Market Perform | 2026-01-23 |
| Citigroup | Maintain | Buy | 2026-01-23 |
| Evercore ISI Group | Maintain | Outperform | 2026-01-23 |
| JP Morgan | Maintain | Overweight | 2026-01-12 |
| Morgan Stanley | Maintain | Equal Weight | 2025-12-08 |
| JP Morgan | Maintain | Overweight | 2025-10-20 |
| Barclays | Maintain | Overweight | 2025-10-20 |
| Baird | Maintain | Outperform | 2025-10-20 |
| UBS | Maintain | Buy | 2025-10-17 |
| Evercore ISI Group | Maintain | Outperform | 2025-10-17 |
Which company has the best grades?
CSX Corporation has received more consistent “Buy,” “Outperform,” and “Overweight” ratings than Old Dominion Freight Line, which shows a wider range from “Buy” to “Underperform.” Investors may view CSX’s stronger consensus grades as a signal of greater analyst confidence.
Risks specific to each company
The following categories identify the critical pressure points and systemic threats facing both firms in the 2026 market environment:
1. Market & Competition
Old Dominion Freight Line, Inc.
- Strong niche in LTL trucking but faces intense pricing pressure and capacity constraints.
CSX Corporation
- Dominates rail freight east of Mississippi but exposed to cyclical commodity demand swings.
2. Capital Structure & Debt
Old Dominion Freight Line, Inc.
- Very conservative debt profile; excellent interest coverage signals low financial risk.
CSX Corporation
- High debt-to-equity ratio (1.43) raises financial leverage concerns despite manageable interest coverage.
3. Stock Volatility
Old Dominion Freight Line, Inc.
- Beta of 1.27 suggests moderate volatility, consistent with industrial transportation sector norms.
CSX Corporation
- Slightly higher beta (1.29) indicates similar market sensitivity but larger volume may amplify moves.
4. Regulatory & Legal
Old Dominion Freight Line, Inc.
- Subject to trucking regulations and environmental compliance; regulatory risks manageable.
CSX Corporation
- Faces complex rail safety rules and labor negotiations, increasing regulatory uncertainty.
5. Supply Chain & Operations
Old Dominion Freight Line, Inc.
- Extensive fleet and service centers support operational resilience; supply chain disruptions remain a moderate risk.
CSX Corporation
- Large rail network vulnerable to weather and infrastructure issues; intermodal service mitigates some risks.
6. ESG & Climate Transition
Old Dominion Freight Line, Inc.
- Trucking faces pressure to reduce emissions; investment in fuel efficiency critical for compliance.
CSX Corporation
- Rail’s lower carbon footprint is an advantage, but infrastructure upgrades require capital outlays.
7. Geopolitical Exposure
Old Dominion Freight Line, Inc.
- Primarily domestic US operations reduce geopolitical risk; limited exposure to international trade tensions.
CSX Corporation
- Operations extend into Canada, adding some cross-border regulatory and trade risk.
Which company shows a better risk-adjusted profile?
Old Dominion Freight Line’s strongest risk lies in market competition and pricing pressures typical of the trucking sector. CSX faces significant financial leverage and regulatory complexities as its key risks. ODFL’s pristine debt profile and safe-zone Altman Z-score contrast with CSX’s grey-zone bankruptcy risk and heavier leverage. Despite CSX’s scale advantages, Old Dominion’s lower financial risk and stronger liquidity give it a superior risk-adjusted profile in 2026.
Final Verdict: Which stock to choose?
Old Dominion Freight Line’s superpower lies in its operational efficiency and robust cash flow generation, making it a resilient cash machine in a volatile sector. Its point of vigilance is a recent dip in revenue growth, which could signal near-term pressures. It fits well in an aggressive growth portfolio seeking operational excellence.
CSX’s strategic moat is its entrenched rail network and steady recurring revenue, which provide competitive barriers and stable cash flows. Compared to Old Dominion, it offers a safer profile despite some leverage concerns. CSX suits a GARP (Growth at a Reasonable Price) investor looking for income with moderate growth.
If you prioritize operational efficiency and cash flow strength, Old Dominion outshines with its disciplined capital allocation. However, if you seek better stability and an established moat in transportation, CSX offers a more defensive stance despite some financial risks. Both present analytical scenarios worth considering based on risk tolerance and growth expectations.
Disclaimer: Investment carries a risk of loss of initial capital. The past performance is not a reliable indicator of future results. Be sure to understand risks before making an investment decision.
Go Further
I encourage you to read the complete analyses of Old Dominion Freight Line, Inc. and CSX Corporation to enhance your investment decisions: