In the fast-evolving world of cloud security and identity management, Zscaler, Inc. (ZS) and Okta, Inc. (OKTA) stand out as pioneering software infrastructure companies. Both firms serve overlapping markets with innovative solutions that secure digital access for businesses worldwide. This comparison explores their strategies, growth potential, and market positioning to help you decide which company deserves a place in your investment portfolio. Let’s uncover which one offers the most compelling opportunity.

Table of contents
Companies Overview
I will begin the comparison between Zscaler and Okta by providing an overview of these two companies and their main differences.
Zscaler Overview
Zscaler, Inc. is a cloud security company headquartered in San Jose, California, focused on providing secure access solutions for users, servers, and IoT devices. Its platform includes Internet Access, Private Access, and Digital Experience solutions designed to protect SaaS applications and internal resources. Zscaler serves a wide range of industries, including healthcare, financial services, and telecommunications, positioning itself as a key player in the cloud security infrastructure market.
Okta Overview
Okta, Inc., based in San Francisco, California, specializes in identity management and security solutions for enterprises, SMBs, and public sector clients globally. Its Okta Identity Cloud offers services such as Single Sign-On, Multi-Factor Authentication, Lifecycle Management, and API Access Management. Okta also provides the Auth0 product suite, enhancing login experiences and security for various applications, supporting both cloud and on-premise environments.
Key similarities and differences
Both Zscaler and Okta operate in the software infrastructure sector, focusing on cybersecurity solutions, but they address different aspects: Zscaler centers on cloud security and workload segmentation, while Okta specializes in identity and access management. Each company targets diverse customer bases but with overlapping industries. Zscaler’s platform emphasizes network and application security, whereas Okta’s solutions concentrate on user authentication and authorization management.
Income Statement Comparison
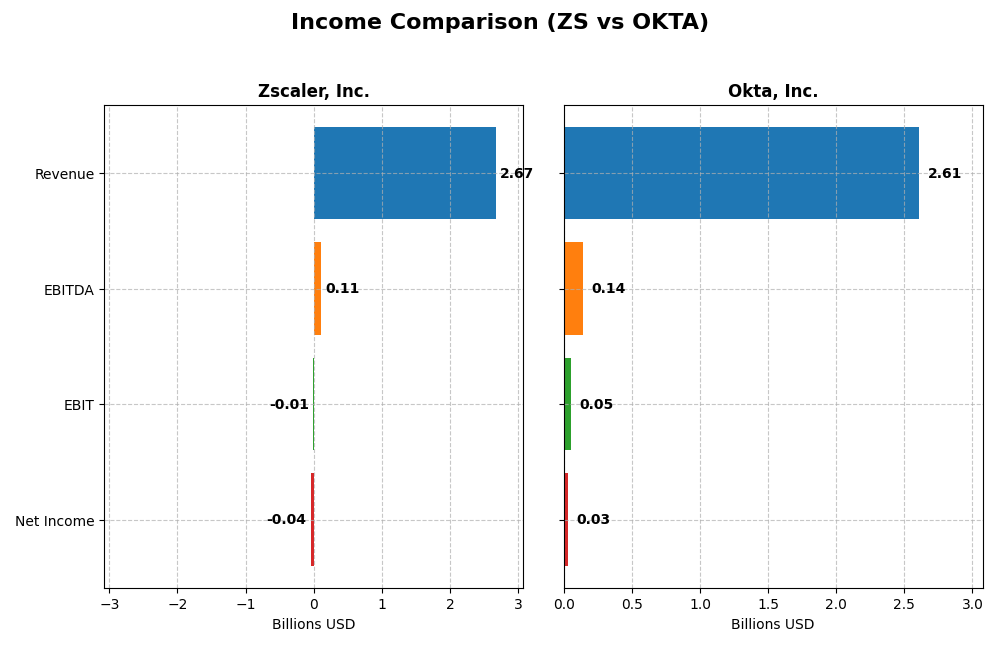
This table presents a factual comparison of key income statement metrics for Zscaler, Inc. and Okta, Inc. based on their most recent fiscal year data.
| Metric | Zscaler, Inc. (ZS) | Okta, Inc. (OKTA) |
|---|---|---|
| Market Cap | 34.1B | 15.2B |
| Revenue | 2.67B | 2.61B |
| EBITDA | 112M | 139M |
| EBIT | -8.8M | 51M |
| Net Income | -41.5M | 28M |
| EPS | -0.27 | 0.17 |
| Fiscal Year | 2025 | 2025 |
Income Statement Interpretations
Zscaler, Inc.
Zscaler, Inc. has shown strong revenue growth from 673M in 2021 to 2.67B in 2025, reflecting a 297% increase. Despite negative net income across the period, losses have narrowed significantly, improving net margins from deeply negative to -1.55% in 2025. The latest fiscal year saw a 23.3% revenue increase and a 41.7% improvement in net margin, indicating accelerating profitability trends.
Okta, Inc.
Okta, Inc. experienced revenue growth from 835M in 2021 to 2.61B in 2025, a 213% rise. The company returned to profitability in 2025 with a net income of 28M and a positive net margin of 1.07%, after years of losses. Margins improved steadily, and the most recent year recorded a 15.3% revenue growth and more than doubled net income, signaling solid margin recovery and operational efficiency.
Which one has the stronger fundamentals?
Both companies demonstrate favorable income statement trends, with robust revenue and margin improvements. Zscaler’s higher overall revenue growth and gross margin strength contrast with persistent net losses. Okta shows a positive net margin and profitability in 2025, underpinned by steady margin gains. Okta’s profitability and margin stabilization present comparatively stronger fundamentals at this stage.
Financial Ratios Comparison
The table below presents key financial ratios for Zscaler, Inc. (ZS) and Okta, Inc. (OKTA) based on their most recent fiscal year data, facilitating a direct comparison of their financial performance and stability.
| Ratios | Zscaler, Inc. (ZS) 2025 | Okta, Inc. (OKTA) 2025 |
|---|---|---|
| ROE | -2.31% | 0.44% |
| ROIC | -3.18% | -0.61% |
| P/E | -1063 | 571 |
| P/B | 24.51 | 2.49 |
| Current Ratio | 2.01 | 1.35 |
| Quick Ratio | 2.01 | 1.35 |
| D/E (Debt to Equity) | 1.00 | 0.15 |
| Debt-to-Assets | 27.98% | 10.09% |
| Interest Coverage | -13.49 | -14.80 |
| Asset Turnover | 0.42 | 0.28 |
| Fixed Asset Turnover | 4.22 | 22.31 |
| Payout Ratio | 0 | 0 |
| Dividend Yield | 0 | 0 |
Interpretation of the Ratios
Zscaler, Inc.
Zscaler shows a mixed ratio profile with a slightly unfavorable overall evaluation. Key concerns include negative net margin (-1.55%) and return on equity (-2.31%), alongside a high price-to-book ratio (24.51). However, liquidity ratios like current and quick ratios stand strong at around 2.0, indicating solid short-term financial health. Zscaler does not pay dividends, reflecting its reinvestment focus and growth strategy typical for cloud security firms.
Okta, Inc.
Okta’s ratios present a neutral overall picture with both strengths and weaknesses. Though net margin (1.07%) and return on equity (0.44%) remain low, it benefits from favorable debt metrics such as a low debt-to-equity ratio (0.15) and high interest coverage (10.2). The company also does not pay dividends, consistent with its prioritization of growth investments and R&D in identity solutions and cloud platforms.
Which one has the best ratios?
Comparing the two, Okta holds a more balanced ratio profile with a neutral global opinion, supported by better debt management and interest coverage. Zscaler, while strong in liquidity, faces more unfavorable profitability and valuation ratios, leading to a slightly unfavorable stance. Neither company currently offers dividends, emphasizing growth over shareholder payouts.
Strategic Positioning
This section compares the strategic positioning of Zscaler, Inc. and Okta, Inc., focusing on market position, key segments, and exposure to technological disruption:
Zscaler, Inc.
- Leading cloud security provider with $34B market cap facing competition in software infrastructure.
- Focuses on cloud security access, workload segmentation, and digital experience across various industries.
- Positioned in evolving cloud security, with solutions mitigating risks in SaaS, IaaS, and PaaS environments.
Okta, Inc.
- Identity solutions provider with $15B market cap, serving diverse client base globally.
- Specializes in identity cloud platform with multi-factor authentication and lifecycle management.
- Adapts to identity security trends, offering passwordless and adaptive authentication technologies.
Zscaler, Inc. vs Okta, Inc. Positioning
Zscaler has a diversified approach targeting broad cloud security needs across multiple industries, while Okta concentrates on identity management solutions. Zscaler’s wider scope offers industry breadth; Okta’s focus emphasizes specialized identity security services.
Which has the best competitive advantage?
Both companies exhibit slightly unfavorable MOAT evaluations, shedding value despite growing ROIC trends. Neither currently demonstrates a strong sustainable competitive advantage based on ROIC versus WACC metrics.
Stock Comparison
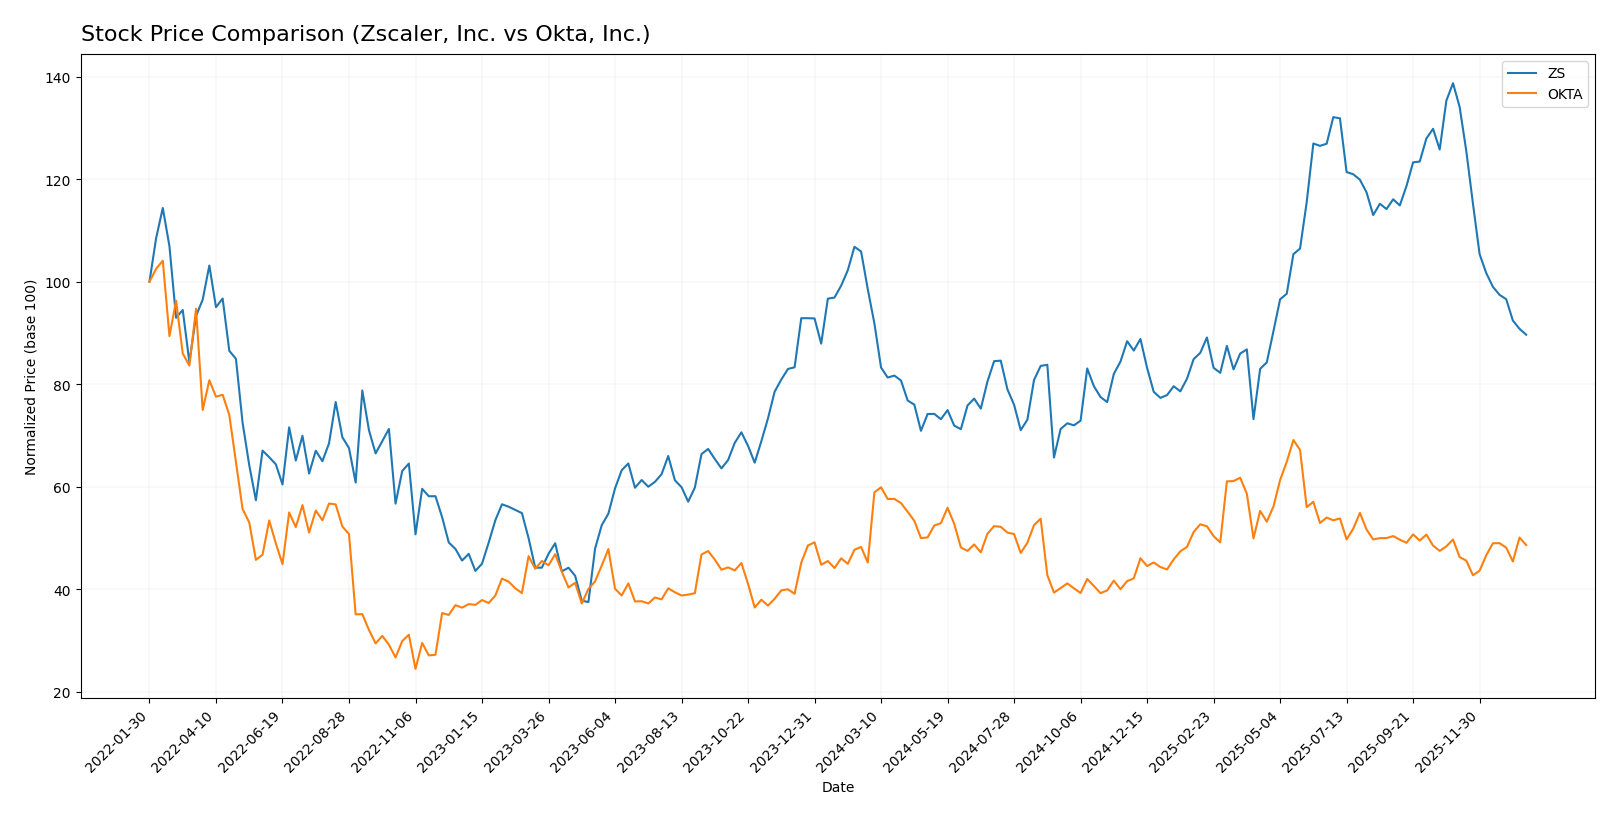
The stock price dynamics over the past year reveal contrasting trajectories for Zscaler, Inc. and Okta, Inc., marked by a notable bearish trend with deceleration for Zscaler and a bullish trend with acceleration for Okta.
Trend Analysis
Zscaler, Inc. experienced a bearish trend over the past 12 months with a -9.03% price change, showing deceleration. The stock fluctuated between a high of 331.14 and a low of 156.78 with significant volatility (std deviation 47.11).
Okta, Inc. showed a bullish trend with a 7.58% price increase over the same period, accompanied by acceleration. The stock ranged from 72.24 to 127.3 and exhibited lower volatility (std deviation 11.38).
Comparing the two, Okta outperformed Zscaler with positive returns and accelerating momentum, while Zscaler faced a declining trend and higher volatility, indicating weaker market performance.
Target Prices
The current analyst consensus reveals optimistic targets for both Zscaler, Inc. and Okta, Inc., indicating potential upside from their current market prices.
| Company | Target High | Target Low | Consensus |
|---|---|---|---|
| Zscaler, Inc. | 360 | 260 | 311.41 |
| Okta, Inc. | 140 | 60 | 110.67 |
Analysts expect Zscaler’s stock to appreciate significantly from its current price of $213.98, while Okta’s consensus target at $110.67 also suggests meaningful upside compared to its current price of $89.55.
Analyst Opinions Comparison
This section compares analysts’ ratings and grades for Zscaler, Inc. and Okta, Inc.:
Rating Comparison
Zscaler, Inc. Rating
- Rating: C-, considered very favorable overall.
- Discounted Cash Flow Score: 4, favorable valuation metric.
- ROE Score: 1, very unfavorable for profit generation efficiency.
- ROA Score: 1, very unfavorable asset utilization.
- Debt To Equity Score: 1, very unfavorable financial risk.
- Overall Score: 1, very unfavorable financial standing.
Okta, Inc. Rating
- Rating: B, considered very favorable overall.
- Discounted Cash Flow Score: 4, favorable valuation metric.
- ROE Score: 2, moderate efficiency in profit generation.
- ROA Score: 3, moderate asset utilization efficiency.
- Debt To Equity Score: 4, favorable financial stability.
- Overall Score: 3, moderate financial standing.
Which one is the best rated?
Based strictly on the provided data, Okta holds better ratings and scores overall, including higher ROE, ROA, debt-to-equity, and overall scores. Zscaler’s ratings show much weaker performance except for discounted cash flow.
Scores Comparison
The comparison of Zscaler, Inc. and Okta, Inc. scores is as follows:
Zscaler, Inc. Scores
- Altman Z-Score: 4.89, indicating the company is in the safe zone.
- Piotroski Score: 3, classified as very weak financial strength.
Okta, Inc. Scores
- Altman Z-Score: 4.15, indicating the company is in the safe zone.
- Piotroski Score: 8, classified as very strong financial strength.
Which company has the best scores?
Both companies have Altman Z-Scores in the safe zone, indicating low bankruptcy risk. However, Okta’s Piotroski Score of 8 shows significantly stronger financial health compared to Zscaler’s very weak score of 3.
Grades Comparison
Here is a comparison of the recent grades assigned to Zscaler, Inc. and Okta, Inc. by reputable grading firms:
Zscaler, Inc. Grades
This table presents recent grades issued by recognized financial institutions for Zscaler, Inc.:
| Grading Company | Action | New Grade | Date |
|---|---|---|---|
| Citigroup | Maintain | Buy | 2026-01-13 |
| Keybanc | Maintain | Overweight | 2026-01-12 |
| Piper Sandler | Maintain | Neutral | 2026-01-05 |
| RBC Capital | Maintain | Outperform | 2026-01-05 |
| Mizuho | Upgrade | Outperform | 2025-12-16 |
| Bernstein | Downgrade | Market Perform | 2025-12-01 |
| Citigroup | Maintain | Buy | 2025-12-01 |
| JP Morgan | Maintain | Overweight | 2025-11-26 |
| Baird | Maintain | Outperform | 2025-11-26 |
| BTIG | Maintain | Buy | 2025-11-26 |
The grades for Zscaler show mostly stable to positive outlooks with some upgrades and a single downgrade, indicating a generally favorable consensus.
Okta, Inc. Grades
This table lists recent grades assigned to Okta, Inc. by verified grading entities:
| Grading Company | Action | New Grade | Date |
|---|---|---|---|
| Stephens & Co. | Upgrade | Overweight | 2026-01-14 |
| Piper Sandler | Maintain | Neutral | 2026-01-05 |
| RBC Capital | Maintain | Outperform | 2026-01-05 |
| Jefferies | Upgrade | Buy | 2025-12-16 |
| Needham | Maintain | Buy | 2025-12-12 |
| BTIG | Maintain | Buy | 2025-12-04 |
| Susquehanna | Maintain | Neutral | 2025-12-03 |
| Cantor Fitzgerald | Maintain | Overweight | 2025-12-03 |
| Canaccord Genuity | Maintain | Buy | 2025-12-03 |
| Scotiabank | Maintain | Sector Perform | 2025-12-03 |
Okta’s grades reflect a positive trend with upgrades and multiple buy ratings, showing a generally optimistic analyst view.
Which company has the best grades?
Both Zscaler, Inc. and Okta, Inc. share a consensus “Buy” rating, but Okta exhibits a higher frequency of upgrades and buy ratings compared to Zscaler’s mix of buy, outperform, and neutral grades. This suggests Okta may currently enjoy stronger analyst support, potentially influencing investor confidence and portfolio positioning.
Strengths and Weaknesses
Below is a comparison of key strengths and weaknesses for Zscaler, Inc. (ZS) and Okta, Inc. (OKTA) based on recent financial and operational data.
| Criterion | Zscaler, Inc. (ZS) | Okta, Inc. (OKTA) |
|---|---|---|
| Diversification | Moderate, single reportable segment (~2.67B) | Moderate, mainly subscription (~2.56B) with smaller tech services (~54M) |
| Profitability | Negative net margin (-1.55%), ROIC -3.18%, shedding value but improving ROIC trend | Slightly positive net margin (1.07%), ROIC -0.61%, also shedding value but improving ROIC trend |
| Innovation | Strong fixed asset turnover (4.22), indicating efficient use of assets | Very high fixed asset turnover (22.31), showing strong asset efficiency |
| Global presence | Solid current and quick ratios (2.01), moderate debt levels | Adequate liquidity (current ratio 1.35), low debt-to-assets (10.09%) |
| Market Share | High price-to-book ratio (24.51) may indicate growth expectations | Moderate price-to-book ratio (2.49), reflecting market confidence |
Key takeaways: Both companies face challenges with profitability and value creation as their ROIC remains below WACC, signaling value destruction. However, improving ROIC trends and strong asset efficiency, especially for Okta, suggest potential for future profitability growth. Investors should weigh these factors carefully against inherent risks.
Risk Analysis
Below is a comparative overview of key risks for Zscaler, Inc. (ZS) and Okta, Inc. (OKTA) based on the most recent 2025 data:
| Metric | Zscaler, Inc. (ZS) | Okta, Inc. (OKTA) |
|---|---|---|
| Market Risk | Beta 1.02, moderate volatility | Beta 0.76, lower volatility |
| Debt Level | Debt-to-Assets 28%, moderate leverage | Debt-to-Assets 10%, low leverage |
| Regulatory Risk | Moderate, cloud security sector scrutiny | Moderate, identity management regulations |
| Operational Risk | Risks from cloud infrastructure complexity | Risks from integration of acquired technologies |
| Environmental Risk | Low, primarily software-based | Low, primarily software-based |
| Geopolitical Risk | Moderate, global client base exposure | Moderate, global client base exposure |
Synthesis: Zscaler carries moderate market and leverage risks with unfavorable profitability metrics, suggesting caution. Okta shows lower debt risk and stronger financial scores but faces challenges with high valuation ratios. Both companies operate in a regulatory-sensitive sector with operational risks linked to technology complexity.
Which Stock to Choose?
Zscaler, Inc. (ZS) has shown strong revenue growth of 23.31% in 2025 and favorable income statement trends overall, despite negative profitability ratios and a net margin of -1.55%. Its debt levels are manageable, supported by a current ratio above 2, but financial ratios appear slightly unfavorable, and the company is rated very favorably overall but with mixed score evaluations.
Okta, Inc. (OKTA) presents moderate revenue growth at 15.33% in 2025 and a neutral net margin of 1.07%, with improving profitability metrics. Its financial ratios are more balanced, with several favorable indicators including low debt-to-equity and strong interest coverage. The company holds a very favorable rating with a strong Piotroski score and a safe Altman Z-Score.
Considering the ratings and financial evaluations, Okta may appear more suitable for investors seeking financial stability and improving profitability, while Zscaler could be of interest to those focusing on high revenue growth despite some profitability challenges. The choice could depend on an investor’s risk tolerance and preference for growth versus financial steadiness.
Disclaimer: Investment carries a risk of loss of initial capital. The past performance is not a reliable indicator of future results. Be sure to understand risks before making an investment decision.
Go Further
I encourage you to read the complete analyses of Zscaler, Inc. and Okta, Inc. to enhance your investment decisions: