In the fast-evolving technology sector, Okta, Inc. and Wix.com Ltd. stand out as influential players in software infrastructure. Okta specializes in identity and access management solutions, while Wix empowers users with cloud-based website development tools. Despite their different core offerings, both companies innovate to enhance digital experiences and secure online operations. This article will help you decide which company presents the most promising investment opportunity in 2026.

Table of contents
Companies Overview
I will begin the comparison between Okta and Wix by providing an overview of these two companies and their main differences.
Okta Overview
Okta, Inc. focuses on identity solutions, serving enterprises, SMBs, educational institutions, non-profits, and governments globally. Its flagship product, Okta Identity Cloud, offers a comprehensive suite including Single Sign-On, Multi-Factor Authentication, Lifecycle Management, and API security. Okta aims to secure user identities and access across cloud and on-premise environments, positioning itself strongly in the software infrastructure market.
Wix Overview
Wix.com Ltd. develops a cloud-based platform enabling users worldwide to create websites and web applications with drag-and-drop tools. Its offerings include Wix Editor, Wix ADI, and business growth tools like Ascend and Wix Payments. Wix caters primarily to individuals and small businesses, providing complementary services such as an app marketplace and customer support infrastructure to facilitate online business management.
Key similarities and differences
Both Okta and Wix operate in the software infrastructure sector and serve international markets, but their business models differ significantly. Okta specializes in identity and access management solutions for a broad range of organizations, focusing on security. Wix targets website creation and business growth tools, emphasizing user-friendly design and e-commerce capabilities. While Okta’s offerings center around enterprise security, Wix provides a platform for digital presence and customer engagement.
Income Statement Comparison
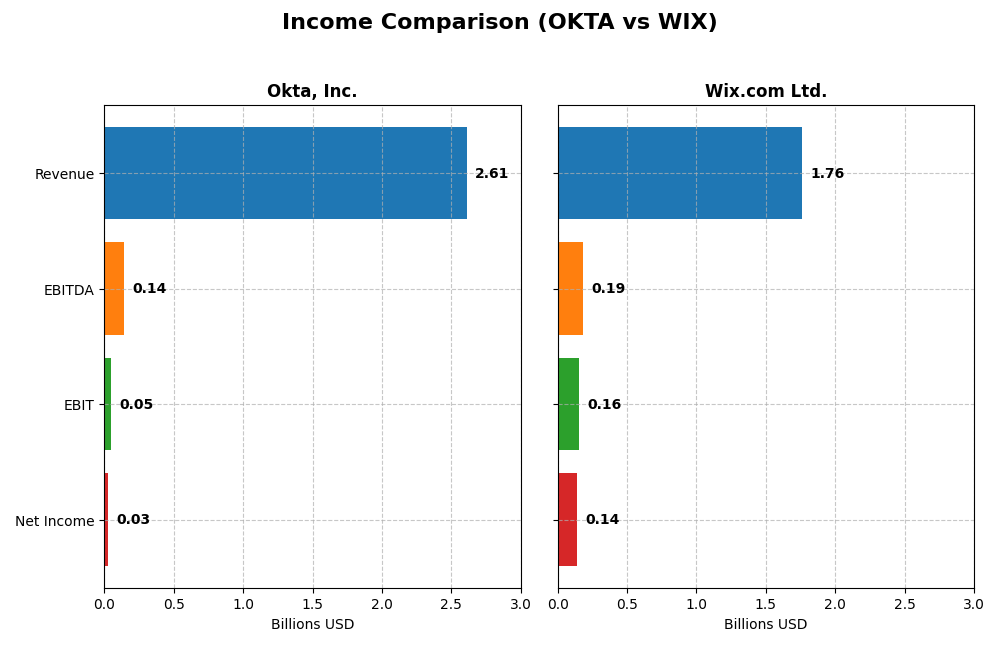
The table below presents a side-by-side comparison of the most recent full fiscal year income statements for Okta, Inc. and Wix.com Ltd., highlighting key financial metrics.
| Metric | Okta, Inc. | Wix.com Ltd. |
|---|---|---|
| Market Cap | 15.2B | 4.5B |
| Revenue | 2.61B | 1.76B |
| EBITDA | 139M | 186M |
| EBIT | 51M | 155M |
| Net Income | 28M | 138M |
| EPS | 0.17 | 2.49 |
| Fiscal Year | 2025 | 2024 |
Income Statement Interpretations
Okta, Inc.
Okta’s revenue grew substantially from $835M in 2021 to $2.61B in 2025, with net income turning positive at $28M in 2025 after consistent losses. Gross margin improved to 76.32%, while net margin remained modest at 1.07%. The latest year showed strong revenue growth of 15.33% and a significant turnaround in profitability, marking a favorable shift in fundamentals.
Wix.com Ltd.
Wix’s revenue increased steadily from $985M in 2020 to $1.76B in 2024, with net income turning positive at $138M in 2024 after losses in earlier years. Gross margin stood at 67.93% and net margin reached 7.86%. The most recent year delivered favorable growth of 12.74% in revenue and a notable jump in net margin, reflecting improved operational efficiency and profitability.
Which one has the stronger fundamentals?
Both Okta and Wix demonstrate favorable income statement trends with strong revenue and net income growth. Okta shows higher gross margins and a solid recovery in profitability, while Wix presents a higher net margin and consistent positive net income in the latest year. Okta’s faster revenue growth contrasts with Wix’s stronger net margin, indicating different strengths in their fundamentals.
Financial Ratios Comparison
The table below compares key financial ratios for Okta, Inc. and Wix.com Ltd. based on their most recent full fiscal year data.
| Ratios | Okta, Inc. (2025) | Wix.com Ltd. (2024) |
|---|---|---|
| ROE | 0.44% | -175.57% |
| ROIC | -0.61% | 9.13% |
| P/E | 570.6 | 86.21 |
| P/B | 2.49 | -151.35 |
| Current Ratio | 1.35 | 0.84 |
| Quick Ratio | 1.35 | 0.84 |
| D/E (Debt-to-Equity) | 0.15 | -12.31 |
| Debt-to-Assets | 10.09% | 50.70% |
| Interest Coverage | -14.8 | 25.92 |
| Asset Turnover | 0.28 | 0.92 |
| Fixed Asset Turnover | 22.31 | 3.33 |
| Payout ratio | 0% | 0% |
| Dividend yield | 0% | 0% |
Interpretation of the Ratios
Okta, Inc.
Okta’s financial ratios present a mixed picture with 42.86% favorable and 42.86% unfavorable ratings, leading to a neutral overall assessment. Concerns include low net margin (1.07%) and return on equity (0.44%), alongside a very high P/E ratio (570.6), suggesting overvaluation risk. The company does not pay dividends, reflecting a reinvestment strategy typical for growth-focused tech firms.
Wix.com Ltd.
Wix shows a slightly unfavorable ratio profile, with 28.57% favorable and 35.71% unfavorable ratios. While it benefits from strong interest coverage (40.14) and a low debt-to-equity ratio (-12.31), its current ratio is weak (0.84), indicating liquidity concerns. Wix also does not pay dividends, likely prioritizing growth and reinvestment given its mixed profitability and capital structure.
Which one has the best ratios?
Neither Okta nor Wix stands out definitively, as both face significant challenges. Okta’s neutral rating contrasts with Wix’s slightly unfavorable profile. Okta’s low profitability and high valuation raise caution, whereas Wix’s liquidity and leverage metrics suggest risk. Investors must weigh these nuanced factors within their broader analysis framework.
Strategic Positioning
This section compares the strategic positioning of Okta and Wix, including market position, key segments, and exposure to technological disruption:
Okta, Inc.
- Market leader in identity solutions with moderate competitive pressure in software infrastructure.
- Focused on enterprise identity cloud solutions, subscription services dominate revenue streams.
- Exposed to evolving cloud security tech but offers advanced, adaptive authentication and API management.
Wix.com Ltd.
- Smaller market cap, faces higher volatility with competitive pressure in website creation platforms.
- Diversified cloud platform for website creation and business tools, driven by subscriptions and business solutions.
- Faces disruption risks in web development tech; integrates AI and automation in website and business tools.
Okta vs Wix Positioning
Okta’s strategy centers on specialized identity and security solutions with a subscription-driven model, while Wix offers a broader cloud platform for website and business services. Okta benefits from focused enterprise clients, Wix from a diverse user base but with higher beta risk.
Which has the best competitive advantage?
Both companies show growing ROIC trends but are currently shedding value relative to WACC, indicating slightly unfavorable moats. Okta’s stronger market position contrasts with Wix’s broader service offering; neither has a clear competitive moat advantage based on current MOAT evaluation.
Stock Comparison
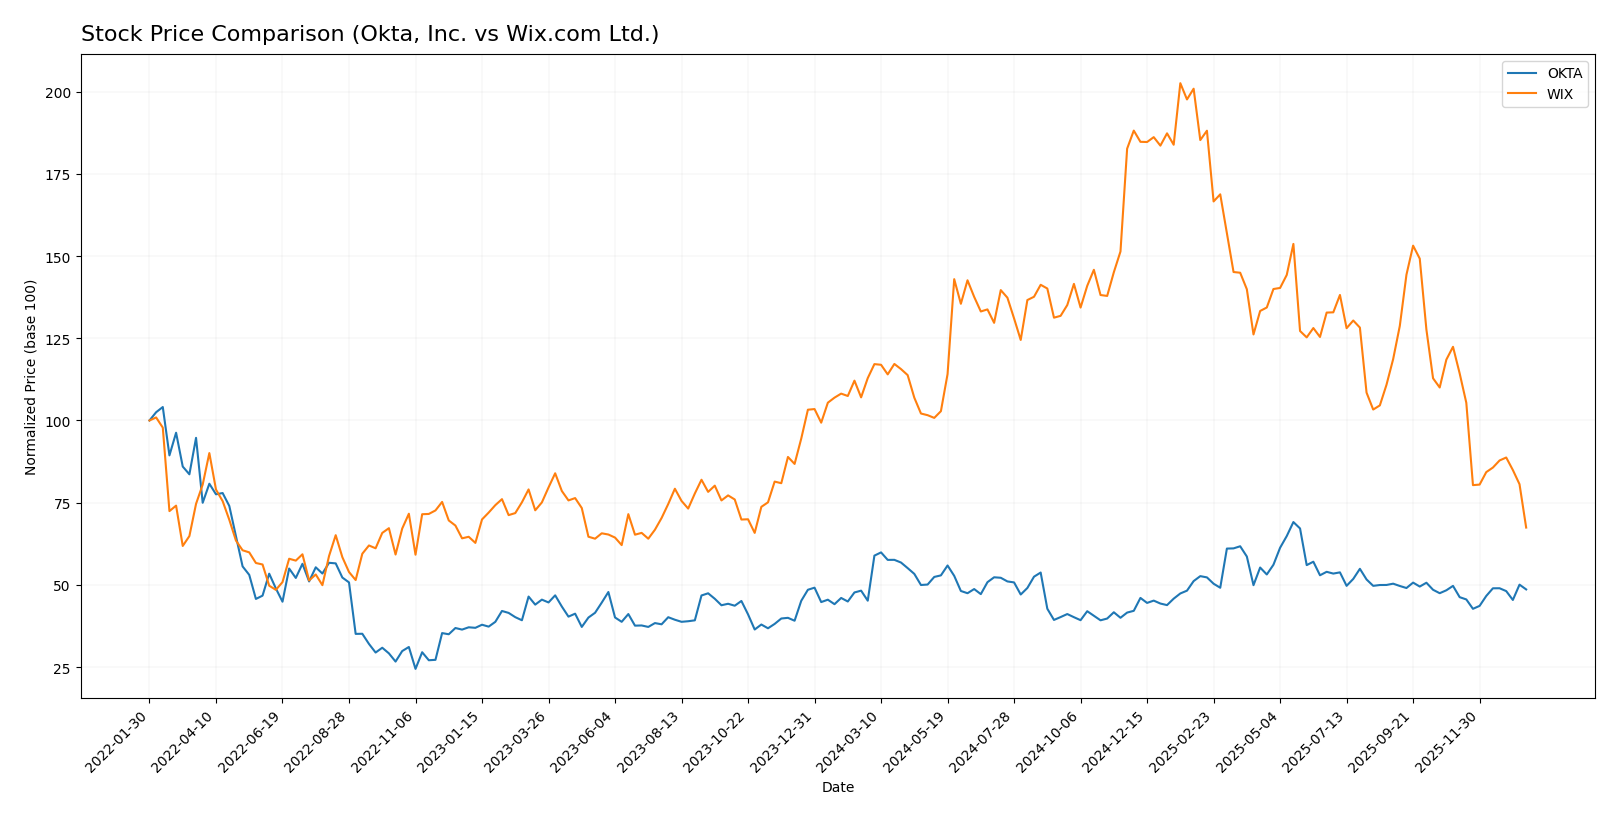
The stock price movements of Okta, Inc. and Wix.com Ltd. over the past year reveal contrasting dynamics, with Okta showing a moderate upward trajectory and Wix experiencing a significant decline in value.
Trend Analysis
Okta, Inc. exhibited a bullish trend over the past 12 months with a 7.58% price increase and accelerating momentum, despite recent slight negative movement of -2.16% since November 2025. Volatility is moderate with an 11.38 std deviation.
Wix.com Ltd. displayed a bearish trend over the past year, losing 40.28% in value with decelerating downward momentum. Recent performance worsened with a -44.92% price change since November 2025, accompanied by high volatility at 34.39 std deviation.
Comparing the two, Okta has delivered the highest market performance with a positive price trend, whereas Wix’s stock has sharply declined, reflecting divergent investor sentiment and market conditions.
Target Prices
The consensus target prices for Okta, Inc. and Wix.com Ltd. suggest significant upside potential from current levels.
| Company | Target High | Target Low | Consensus |
|---|---|---|---|
| Okta, Inc. | 140 | 60 | 110.67 |
| Wix.com Ltd. | 210 | 70 | 160.27 |
Analysts expect Okta’s stock to rise moderately above its current price of $89.55, while Wix.com shows a stronger upside potential compared to its $80.16 market price.
Analyst Opinions Comparison
This section compares analysts’ ratings and grades for Okta, Inc. and Wix.com Ltd.:
Rating Comparison
Okta, Inc. Rating
- Rating: B, indicating a very favorable outlook.
- Discounted Cash Flow Score: 4, favorable valuation level.
- ROE Score: 2, moderate efficiency in generating profit.
- ROA Score: 3, moderate asset utilization effectiveness.
- Debt To Equity Score: 4, favorable financial stability.
- Overall Score: 3, moderate overall financial standing.
Wix.com Ltd. Rating
- Rating: C, also reflecting a very favorable outlook.
- Discounted Cash Flow Score: 3, showing a moderate level.
- ROE Score: 1, very unfavorable profit generation.
- ROA Score: 4, favorable asset utilization.
- Debt To Equity Score: 1, very unfavorable financial risk.
- Overall Score: 2, moderate but lower than Okta’s score.
Which one is the best rated?
Based on the provided data, Okta holds a higher overall rating (B vs. C) and scores better in discounted cash flow and debt-to-equity metrics. Wix performs better in return on assets but has weaker ratings in other areas, making Okta the better rated company overall.
Scores Comparison
The following table compares the Altman Z-Score and Piotroski Score of Okta, Inc. and Wix.com Ltd.:
Okta Scores
- Altman Z-Score: 4.15, placing Okta in the safe zone.
- Piotroski Score: 8, indicating very strong financial health.
Wix Scores
- Altman Z-Score: 1.83, placing Wix in the grey zone.
- Piotroski Score: 6, indicating average financial health.
Which company has the best scores?
Okta shows stronger financial stability with a safe zone Altman Z-Score and a very strong Piotroski Score, while Wix remains in the grey zone with an average Piotroski Score.
Grades Comparison
The following is a comparison of the most recent and reliable grades assigned to Okta, Inc. and Wix.com Ltd.:
Okta, Inc. Grades
This table summarizes the latest grades and rating actions from reputable financial institutions for Okta, Inc.:
| Grading Company | Action | New Grade | Date |
|---|---|---|---|
| Stephens & Co. | Upgrade | Overweight | 2026-01-14 |
| Piper Sandler | Maintain | Neutral | 2026-01-05 |
| RBC Capital | Maintain | Outperform | 2026-01-05 |
| Jefferies | Upgrade | Buy | 2025-12-16 |
| Needham | Maintain | Buy | 2025-12-12 |
| BTIG | Maintain | Buy | 2025-12-04 |
| Susquehanna | Maintain | Neutral | 2025-12-03 |
| Cantor Fitzgerald | Maintain | Overweight | 2025-12-03 |
| Canaccord Genuity | Maintain | Buy | 2025-12-03 |
| Scotiabank | Maintain | Sector Perform | 2025-12-03 |
Overall, Okta shows a positive trend with multiple upgrades and a predominance of buy and overweight ratings, indicating confidence from several grading companies.
Wix.com Ltd. Grades
The table below presents recent grades and rating actions for Wix.com Ltd. from established grading firms:
| Grading Company | Action | New Grade | Date |
|---|---|---|---|
| Morgan Stanley | Maintain | Overweight | 2026-01-15 |
| Wells Fargo | Maintain | Overweight | 2025-12-19 |
| Cantor Fitzgerald | Maintain | Overweight | 2025-12-11 |
| Wells Fargo | Maintain | Overweight | 2025-11-20 |
| Barclays | Maintain | Overweight | 2025-11-20 |
| Citizens | Maintain | Market Outperform | 2025-11-20 |
| Citigroup | Maintain | Buy | 2025-11-20 |
| Scotiabank | Maintain | Sector Outperform | 2025-11-20 |
| Needham | Maintain | Buy | 2025-11-20 |
| Evercore ISI Group | Maintain | Outperform | 2025-11-20 |
Wix.com Ltd. consistently holds overweight and outperform grades with no downgrades, reflecting steady positive sentiment from several key analysts.
Which company has the best grades?
Both Okta, Inc. and Wix.com Ltd. have received predominantly positive grades with consensus ratings of “Buy.” Wix.com Ltd. shows a consistent pattern of overweight and outperform ratings without recent upgrades, while Okta, Inc. features some recent upgrades and a broader mix of buy and overweight ratings. This suggests that investors may perceive Wix as having more stable analyst confidence, whereas Okta shows signs of improving analyst sentiment.
Strengths and Weaknesses
Below is a comparative overview of key strengths and weaknesses for Okta, Inc. and Wix.com Ltd. based on their recent financial and strategic data:
| Criterion | Okta, Inc. | Wix.com Ltd. |
|---|---|---|
| Diversification | Focused mainly on subscription services with some tech services; limited product diversification | Balanced revenue from business solutions and creative subscriptions, showing moderate diversification |
| Profitability | Low net margin (1.07%), negative ROIC (-0.61%), shedding value but improving profitability | Moderate net margin (7.86%), neutral ROIC (9.13%), also shedding value but with a growing ROIC trend |
| Innovation | Strong innovation in identity and access management, reflected by growing ROIC trend | Continuous platform enhancements, reflected by increasing subscription revenues and ROIC growth |
| Global presence | Significant global footprint in security solutions, expanding subscription base | Global reach with growing user base, especially in creative and business solutions segments |
| Market Share | Leading position in identity management but facing intense competition | Solid market share in website building and creative platforms, with steady revenue growth |
Key takeaways: Both companies show increasing profitability trends despite currently shedding value. Okta is more specialized with strengths in innovation and global presence in security, while Wix benefits from broader product diversification and steady market growth. Investors should weigh growth potential against current profitability challenges.
Risk Analysis
Below is a comparison of key risks for Okta, Inc. and Wix.com Ltd. based on the latest available data:
| Metric | Okta, Inc. | Wix.com Ltd. |
|---|---|---|
| Market Risk | Beta 0.76, relatively low volatility | Beta 1.42, higher market volatility risk |
| Debt Level | Low debt-to-equity (0.15), favorable | High debt-to-equity (negative value, complex), debt-to-assets 50.7% unfavorable |
| Regulatory Risk | Moderate due to US and international data privacy laws | Moderate, operating in multiple jurisdictions including Israel and global markets |
| Operational Risk | Moderate, reliant on cloud infrastructure and enterprise clients | Moderate, dependent on platform stability and user engagement |
| Environmental Risk | Low, software sector with limited direct environmental impact | Low, similar software industry profile |
| Geopolitical Risk | Moderate, US-based but global presence | Elevated, headquartered in Israel with exposure to regional instability |
In summary, Wix shows higher market and debt-related risks, coupled with geopolitical concerns due to its Israeli base. Okta benefits from lower financial leverage and market volatility but faces moderate regulatory and operational risks typical for identity management in cloud environments. Investors should weigh these factors carefully, prioritizing risk tolerance and diversification.
Which Stock to Choose?
Okta, Inc. shows a favorable income evolution with 15.33% revenue growth in 2025 and strong profitability improvements. Financial ratios are mixed, with 43% favorable and 43% unfavorable metrics; debt is well managed, and the rating is very favorable (B). The company’s MOAT status is slightly unfavorable due to value destruction but improving profitability.
Wix.com Ltd. reports favorable income growth with 12.74% revenue increase in 2024 and solid profitability metrics. Its financial ratios are slightly unfavorable overall, with 29% favorable and 36% unfavorable; debt levels are higher, and the rating remains very favorable (C). The MOAT status is also slightly unfavorable, reflecting value destruction but with a growing ROIC.
Investors focused on growth might find Okta’s improving profitability and balanced financial ratios appealing, while those prioritizing income growth with moderate risk tolerance could consider Wix despite its higher debt and recent stock weakness. Both companies exhibit value-destroying MOATs but show signs of profitability improvement.
Disclaimer: Investment carries a risk of loss of initial capital. The past performance is not a reliable indicator of future results. Be sure to understand risks before making an investment decision.
Go Further
I encourage you to read the complete analyses of Okta, Inc. and Wix.com Ltd. to enhance your investment decisions: