In the fast-evolving technology sector, Okta, Inc. and Veritone, Inc. stand out as innovators offering distinct yet overlapping software infrastructure solutions. Okta specializes in identity management, securing user access across enterprises, while Veritone leverages artificial intelligence to unlock insights from complex data. This comparison explores their market positions, innovation strategies, and growth potential to help you decide which company deserves a place in your investment portfolio.

Table of contents
Companies Overview
I will begin the comparison between Okta and Veritone by providing an overview of these two companies and their main differences.
Okta Overview
Okta, Inc. is a leading provider of identity solutions catering to enterprises, SMBs, universities, non-profits, and government agencies worldwide. Its flagship platform, Okta Identity Cloud, offers a comprehensive suite of products including single sign-on, adaptive multi-factor authentication, lifecycle management, API access management, and advanced server access. Headquartered in San Francisco, Okta focuses on securing user and device profiles across cloud and on-premise environments.
Veritone Overview
Veritone, Inc. delivers artificial intelligence computing solutions primarily in the US and UK through its AI operating system, aiWARE. The platform leverages machine learning and cognitive processes such as transcription, language translation, and object recognition to extract insights from structured and unstructured data. Based in Denver, Veritone serves diverse sectors including media, government, legal, and energy, also offering media advertising agency services and analytics.
Key similarities and differences
Both Okta and Veritone operate in the technology sector within software infrastructure, focusing on advanced digital solutions. Okta specializes in identity and access management, emphasizing security for cloud and on-premise applications. In contrast, Veritone centers on AI-driven data analysis and media services, targeting a broader range of industry verticals. Okta’s platform is designed for identity security, while Veritone’s core competency lies in AI-enabled insights and advertising solutions.
Income Statement Comparison
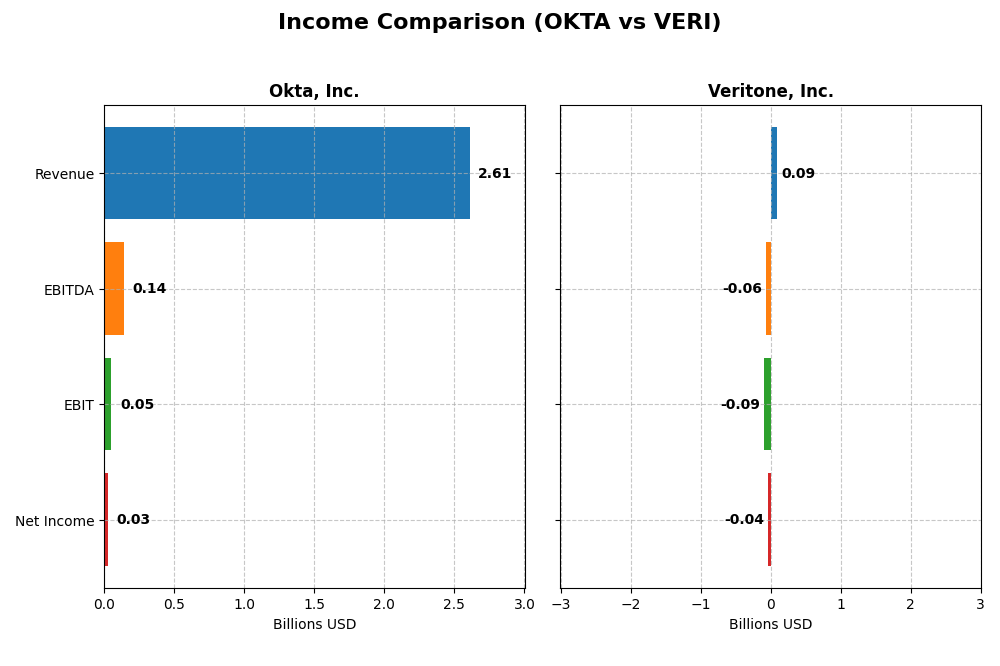
Below is a side-by-side comparison of the most recent fiscal year income statement metrics for Okta, Inc. and Veritone, Inc., providing a clear view of their financial performance.
| Metric | Okta, Inc. (OKTA) | Veritone, Inc. (VERI) |
|---|---|---|
| Market Cap | 15.2B | 225M |
| Revenue | 2.61B | 93M |
| EBITDA | 139M | -59M |
| EBIT | 51M | -88M |
| Net Income | 28M | -37M |
| EPS | 0.17 | -0.98 |
| Fiscal Year | 2025 | 2024 |
Income Statement Interpretations
Okta, Inc.
Okta exhibited strong revenue growth from 2021 to 2025, reaching $2.61B in 2025 with a net income of $28M, reversing previous losses. Gross margin remained favorable at 76.3%, while net margin improved to a neutral 1.07%. The latest year showed favorable growth in revenue, gross profit, EBIT, and net margin, indicating improving profitability and operational efficiency.
Veritone, Inc.
Veritone’s revenue peaked near $150M in 2022 but declined to $92.6M by 2024, with net income remaining negative at -$37M. Gross margin stayed favorable at 70.6%, but EBIT and net margins were unfavorable, reflecting ongoing losses. The most recent year showed a revenue decline but improvements in net margin and EPS growth, suggesting some operational adjustments despite persistent challenges.
Which one has the stronger fundamentals?
Okta demonstrates stronger fundamentals with consistent revenue and net income growth, high gross margins, and improving profitability metrics over the period. Veritone, while showing some favorable margin trends and earnings growth, continues to face significant net losses and higher interest expenses, indicating weaker overall income statement health compared to Okta.
Financial Ratios Comparison
The table below presents a side-by-side comparison of key financial ratios for Okta, Inc. and Veritone, Inc. based on the most recent fiscal year data available.
| Ratios | Okta, Inc. (2025) | Veritone, Inc. (2024) |
|---|---|---|
| ROE | 0.44% | -277.91% |
| ROIC | -0.61% | -58.27% |
| P/E | 570.60 | -3.34 |
| P/B | 2.49 | 9.27 |
| Current Ratio | 1.35 | 0.97 |
| Quick Ratio | 1.35 | 0.97 |
| D/E | 0.15 | 8.91 |
| Debt-to-Assets | 10.09% | 60.54% |
| Interest Coverage | -14.8 | -7.31 |
| Asset Turnover | 0.28 | 0.47 |
| Fixed Asset Turnover | 22.31 | 8.51 |
| Payout Ratio | 0 | 0 |
| Dividend Yield | 0 | 0 |
Interpretation of the Ratios
Okta, Inc.
Okta displays a mixed ratio profile with 42.86% favorable and unfavorable ratios each, and 14.29% neutral, resulting in a neutral overall assessment. Key concerns include weak profitability ratios such as net margin at 1.07% and return on equity at 0.44%, alongside a very high PE ratio of 570.6. The company does not pay dividends, likely focusing on reinvestment and growth, with no dividend yield or payout risk.
Veritone, Inc.
Veritone’s ratios are largely unfavorable, with 78.57% negative and only 14.29% favorable, signaling financial stress. Profitability metrics like net margin at -40.36% and return on equity at -277.91% are significantly weak, and the company has a high debt-to-equity ratio of 8.91. It also does not distribute dividends, reflecting possible reinvestment priorities or losses.
Which one has the best ratios?
Comparing both, Okta holds a more balanced ratio profile with several favorable liquidity and leverage metrics, while Veritone suffers from predominantly unfavorable profitability and solvency ratios. Okta’s neutral stance contrasts with Veritone’s very unfavorable financial ratios, indicating relatively stronger financial health for Okta based on the available data.
Strategic Positioning
This section compares the strategic positioning of Okta and Veritone, focusing on Market position, Key segments, and exposure to disruption:
Okta, Inc.
- Leading identity solutions provider with a $15B market cap facing moderate competitive pressure.
- Key segments include identity subscription services and technology services driving revenue growth.
- Exposure to technological disruption through cloud-based identity security and adaptive authentication.
Veritone, Inc.
- Smaller AI computing solutions provider with a $225M market cap and higher competitive volatility.
- Diverse AI software products, managed services, and advertising across media, legal, government, and energy sectors.
- Focused on AI platform innovation, cognitive AI models, and media-related AI services with evolving technology risks.
Okta vs Veritone Positioning
Okta exhibits a concentrated focus on identity and access management, leveraging a large enterprise base, while Veritone pursues diversification across AI applications and media services. Okta’s scale offers market stability; Veritone’s niche segments imply higher growth variability.
Which has the best competitive advantage?
Both companies are currently shedding value as per MOAT evaluation; Okta shows improving profitability trends, whereas Veritone faces declining returns, indicating Okta has a relatively stronger competitive advantage despite challenges.
Stock Comparison
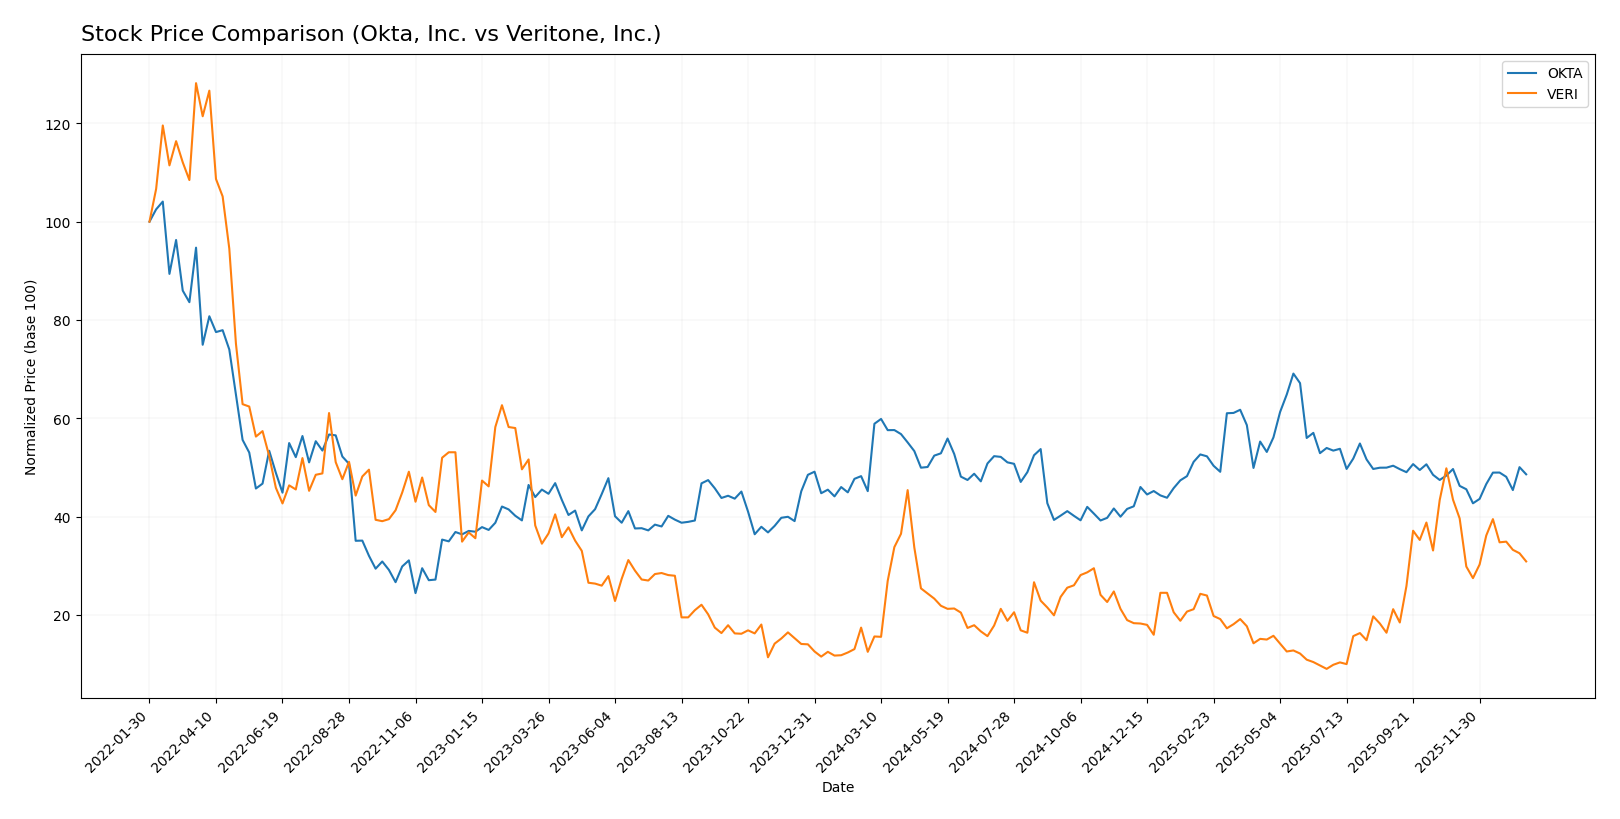
The stock price chart over the past 12 months highlights significant bullish momentum in both Okta, Inc. and Veritone, Inc., with notable price increases and distinct trading volume dynamics influencing their trajectories.
Trend Analysis
Okta, Inc. showed a 7.58% price increase over the past year, indicating a bullish trend with acceleration. The stock ranged between 72.24 and 127.3, exhibiting high volatility with an 11.38 standard deviation.
Veritone, Inc. posted a 147.22% price increase over the same period, also bullish but with deceleration. Its price fluctuated from 1.3 to 7.18 and demonstrated low volatility at a 1.26 standard deviation.
Comparing trends, Veritone, Inc. delivered the highest market performance with a substantially stronger price gain, despite a recent sharper decline and decelerating momentum.
Target Prices
Analysts provide a clear target price consensus for Okta, Inc. and Veritone, Inc., reflecting varied growth expectations.
| Company | Target High | Target Low | Consensus |
|---|---|---|---|
| Okta, Inc. | 140 | 60 | 110.67 |
| Veritone, Inc. | 10 | 9 | 9.5 |
Okta’s consensus target price of 110.67 USD suggests upside potential from its current 89.55 USD stock price, indicating moderate analyst optimism. Veritone’s consensus at 9.5 USD is significantly above its 4.45 USD current price, highlighting expectations of substantial growth.
Analyst Opinions Comparison
This section compares analysts’ ratings and grades for Okta, Inc. and Veritone, Inc.:
Rating Comparison
Okta Rating
- Rating: B, considered very favorable by analysts.
- Discounted Cash Flow Score: 4, favorable indication of valuation.
- Return on Equity Score: 2, moderate efficiency in generating profit.
- Return on Assets Score: 3, moderate asset utilization.
- Debt To Equity Score: 4, favorable financial stability.
- Overall Score: 3, moderate overall financial standing.
Veritone Rating
- Rating: C, considered very favorable by analysts.
- Discounted Cash Flow Score: 5, very favorable for valuation.
- Return on Equity Score: 1, very unfavorable efficiency.
- Return on Assets Score: 1, very unfavorable asset utilization.
- Debt To Equity Score: 1, very unfavorable financial risk.
- Overall Score: 2, moderate overall financial standing.
Which one is the best rated?
Based strictly on the provided data, Okta holds a better overall rating (B vs. C) with stronger scores in ROE, ROA, and debt-to-equity, indicating comparatively better financial health than Veritone.
Scores Comparison
Here is a comparison of the key financial scores for Okta, Inc. and Veritone, Inc.:
Okta Scores
- Altman Z-Score: 4.15, indicating a safe zone with low bankruptcy risk.
- Piotroski Score: 8, classified as very strong financial health.
Veritone Scores
- Altman Z-Score: -0.07, indicating distress zone with high bankruptcy risk.
- Piotroski Score: 3, classified as very weak financial health.
Which company has the best scores?
Based strictly on the provided data, Okta has significantly better scores than Veritone, with a safe zone Altman Z-Score and a very strong Piotroski Score, compared to Veritone’s distress zone and very weak scores.
Grades Comparison
The following is a comparison of the latest reliable grades assigned to Okta, Inc. and Veritone, Inc.:
Okta, Inc. Grades
This table summarizes recent analyst grades and actions for Okta, Inc.
| Grading Company | Action | New Grade | Date |
|---|---|---|---|
| Stephens & Co. | Upgrade | Overweight | 2026-01-14 |
| Piper Sandler | Maintain | Neutral | 2026-01-05 |
| RBC Capital | Maintain | Outperform | 2026-01-05 |
| Jefferies | Upgrade | Buy | 2025-12-16 |
| Needham | Maintain | Buy | 2025-12-12 |
| BTIG | Maintain | Buy | 2025-12-04 |
| Susquehanna | Maintain | Neutral | 2025-12-03 |
| Cantor Fitzgerald | Maintain | Overweight | 2025-12-03 |
| Canaccord Genuity | Maintain | Buy | 2025-12-03 |
| Scotiabank | Maintain | Sector Perform | 2025-12-03 |
Overall, Okta shows a positive trend with multiple upgrades and a strong consensus of buy ratings.
Veritone, Inc. Grades
This table summarizes recent analyst grades and actions for Veritone, Inc.
| Grading Company | Action | New Grade | Date |
|---|---|---|---|
| D. Boral Capital | Maintain | Buy | 2025-12-09 |
| D. Boral Capital | Maintain | Buy | 2025-12-04 |
| Needham | Maintain | Buy | 2025-12-02 |
| D. Boral Capital | Maintain | Buy | 2025-12-02 |
| D. Boral Capital | Maintain | Buy | 2025-11-07 |
| D. Boral Capital | Maintain | Buy | 2025-10-28 |
| HC Wainwright & Co. | Maintain | Buy | 2025-10-20 |
| D. Boral Capital | Maintain | Buy | 2025-10-15 |
| D. Boral Capital | Maintain | Buy | 2025-09-24 |
| D. Boral Capital | Maintain | Buy | 2025-09-09 |
Veritone’s grades are consistently “Buy” with no upgrades or downgrades, reflecting stable analyst sentiment.
Which company has the best grades?
Okta has received a broader range of grades including upgrades and a consensus strongly leaning towards buy and outperform, indicating more dynamic analyst confidence. Veritone maintains steady buy ratings but lacks recent upgrades, suggesting a more stable but less bullish outlook. Investors might interpret Okta’s grades as signaling greater potential momentum.
Strengths and Weaknesses
The table below summarizes the key strengths and weaknesses of Okta, Inc. and Veritone, Inc. based on their recent financial performance, market position, and operational metrics.
| Criterion | Okta, Inc. | Veritone, Inc. |
|---|---|---|
| Diversification | Focused primarily on subscription services with growing tech service segment | More diversified product range including license, managed services, and software products |
| Profitability | Slightly unfavorable net margin (1.07%), growing ROIC but still value-destroying | Very unfavorable profitability with negative net margin (-40.36%) and declining ROIC |
| Innovation | Strong innovation-driven growth in subscription services | Innovation reflected in AI platform and SaaS solutions but profitability lagging |
| Global presence | Established global footprint with scalable cloud services | More niche market presence, less global scale |
| Market Share | Growing market share in identity management | Smaller market share, struggling to scale profitably |
Key takeaways: Okta shows promising growth and improving profitability despite current value destruction, supported by a focused, scalable subscription model. Veritone faces significant profitability challenges and a declining financial trend despite a diversified product portfolio and AI innovation presence. Investors should weigh Okta’s improving fundamentals against Veritone’s riskier profile.
Risk Analysis
Below is a comparison of key risks for Okta, Inc. and Veritone, Inc. based on the most recent data available in 2026:
| Metric | Okta, Inc. | Veritone, Inc. |
|---|---|---|
| Market Risk | Moderate (Beta 0.76) | High (Beta 2.05) |
| Debt Level | Low (D/E 0.15) | Very High (D/E 8.91) |
| Regulatory Risk | Moderate | Moderate |
| Operational Risk | Moderate | High |
| Environmental Risk | Low | Low |
| Geopolitical Risk | Low | Low |
The most impactful risks are Veritone’s very high debt level and operational challenges, reflected in its distress zone Altman Z-score and weak profitability. Okta shows more financial stability but faces market risk from valuation concerns and moderate operational risks. Caution is warranted with Veritone given its financial distress signals.
Which Stock to Choose?
Okta, Inc. shows a favorable income evolution with 15.33% revenue growth in 2025 and strong overall growth since 2021. Its financial ratios present a balanced profile with 42.86% favorable and unfavorable metrics each, and a very favorable rating of B. Profitability is low but improving, debt levels are moderate, and the company’s economic moat is slightly unfavorable yet improving.
Veritone, Inc. exhibits a mixed income profile with a 7.35% revenue decline in 2024 but favorable growth over the longer term. Its financial ratios are predominantly unfavorable at 78.57%, with a very favorable rating of C driven by valuation metrics. Profitability is negative, debt is high, and the economic moat is very unfavorable with declining returns on invested capital.
Investors seeking growth and improving profitability might find Okta’s profile more appealing due to its favorable income trends and balanced ratios. Conversely, those willing to tolerate higher risk for potential value opportunities could interpret Veritone’s metrics as indicative of a turnaround play, despite weaker financial health and profitability.
Disclaimer: Investment carries a risk of loss of initial capital. The past performance is not a reliable indicator of future results. Be sure to understand risks before making an investment decision.
Go Further
I encourage you to read the complete analyses of Okta, Inc. and Veritone, Inc. to enhance your investment decisions: