In today’s fast-evolving tech landscape, Okta, Inc. and UiPath Inc. stand out as key players in the software infrastructure sector. Okta specializes in identity and access management, while UiPath leads in robotic process automation, both driving innovation in enterprise software solutions. Their market overlap and growth potential make them compelling options. This article will help you identify which company offers the most promising investment opportunity in 2026.
Table of contents
Companies Overview
I will begin the comparison between Okta and UiPath by providing an overview of these two companies and their main differences.
Okta Overview
Okta, Inc. specializes in identity solutions for enterprises, SMBs, universities, non-profits, and government agencies globally. Its flagship product, Okta Identity Cloud, offers services like single sign-on, adaptive multi-factor authentication, lifecycle management, and API access management. The company operates primarily in the software infrastructure industry and is headquartered in San Francisco, with a market capitalization of about 15.2B USD.
UiPath Overview
UiPath Inc. delivers an end-to-end automation platform centered on robotic process automation (RPA), combining AI and low-code tools to help organizations automate workflows. It serves sectors including banking, healthcare, and government, primarily in the US, Romania, and Japan. UiPath is a software infrastructure company based in New York City, valued at roughly 7.7B USD, with a focus on process automation and compliance.
Key similarities and differences
Both companies operate in the software infrastructure sector but focus on distinct niches: Okta on identity management and security, UiPath on automation and RPA. Each provides cloud-based platforms with complementary offerings—Okta secures user access and authentication, while UiPath automates business processes using AI and robotics. Their customer bases and geographic focuses differ, with Okta having a broader global reach and UiPath targeting specific international markets.
Income Statement Comparison
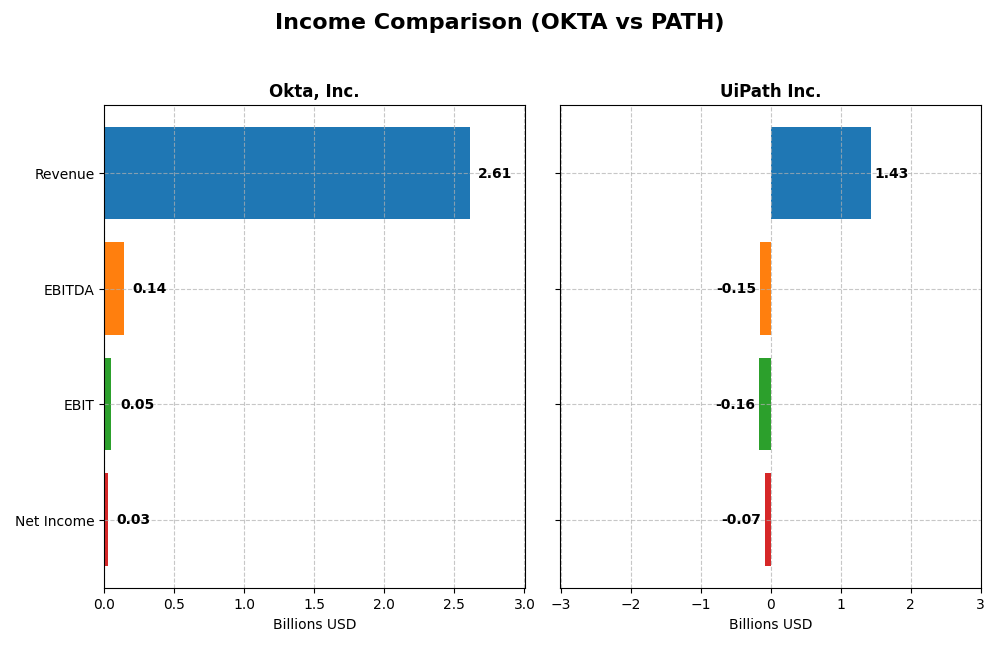
Below is a comparison of key income statement metrics for Okta, Inc. and UiPath Inc. for the most recent fiscal year 2025.
| Metric | Okta, Inc. | UiPath Inc. |
|---|---|---|
| Market Cap | 15.2B | 7.7B |
| Revenue | 2.61B | 1.43B |
| EBITDA | 139M | -145M |
| EBIT | 51M | -163M |
| Net Income | 28M | -74M |
| EPS | 0.17 | -0.13 |
| Fiscal Year | 2025 | 2025 |
Income Statement Interpretations
Okta, Inc.
Okta’s revenue showed a strong growth from 2021 to 2025, rising from $835M to $2.61B, with net income turning positive in 2025 after several years of losses. Gross margins remained favorable, around 76%, while net margin improved to 1.07%. The latest year saw a 15.33% revenue increase and a significant net margin growth, reflecting improved profitability and operational efficiency.
UiPath Inc.
UiPath’s revenue grew steadily from $608M in 2021 to $1.43B in 2025, with net losses narrowing but remaining negative at -$74M in 2025. Gross margins were strong at 82.7%, but EBIT and net margins remained unfavorable, indicating ongoing operating losses. The recent year showed a modest 9.3% revenue growth and a 25% improvement in net margin, signaling gradual progress.
Which one has the stronger fundamentals?
Okta exhibits stronger fundamentals with higher revenue growth (212% vs. 135%) and a positive net income in the latest year, supported by a solid gross margin and improving EBIT margin. UiPath maintains higher gross margins but struggles with persistent operating losses and negative net margins. Okta’s financial improvements suggest better profitability trends compared to UiPath’s slower progress.
Financial Ratios Comparison
The table below compares key financial ratios for Okta, Inc. and UiPath Inc. based on their most recent full fiscal year data available for 2025.
| Ratios | Okta, Inc. (OKTA) | UiPath Inc. (PATH) |
|---|---|---|
| ROE | 0.44% | -3.99% |
| ROIC | -0.61% | -7.41% |
| P/E | 570.6 | -108.0 |
| P/B | 2.49 | 4.31 |
| Current Ratio | 1.35 | 2.93 |
| Quick Ratio | 1.35 | 2.93 |
| D/E | 0.15 | 0.04 |
| Debt-to-Assets | 10.1% | 2.7% |
| Interest Coverage | -14.8 | 0 |
| Asset Turnover | 0.28 | 0.50 |
| Fixed Asset Turnover | 22.31 | 14.41 |
| Payout ratio | 0 | 0 |
| Dividend yield | 0 | 0 |
Interpretation of the Ratios
Okta, Inc.
Okta shows a mixed ratio profile with several unfavorable metrics, including a low net margin of 1.07% and a weak return on equity at 0.44%, indicating limited profitability. However, its strong interest coverage (10.2) and low debt-to-equity ratio (0.15) suggest solid financial stability. The company does not pay dividends, likely focusing on reinvestment and growth, as evidenced by no dividend yield and payout.
UiPath Inc.
UiPath exhibits more unfavorable ratios, including a negative net margin of -5.15% and negative returns on equity and invested capital, reflecting ongoing losses and inefficiency. Despite these, it maintains a strong liquidity position with a current ratio of 2.93 and low leverage. UiPath also does not distribute dividends, likely prioritizing growth investments and absorbing losses in a competitive environment.
Which one has the best ratios?
Both companies face profitability challenges with unfavorable returns and margins. Okta demonstrates better financial stability through its interest coverage and leverage ratios, while UiPath benefits from stronger liquidity but suffers more significant losses. Overall, Okta’s ratio profile is neutral, whereas UiPath’s is slightly unfavorable, reflecting a marginally better balance in Okta’s financial ratios.
Strategic Positioning
This section compares the strategic positioning of Okta and UiPath, focusing on market position, key segments, and exposure to technological disruption:
Okta, Inc.
- Market leader in identity solutions with moderate beta 0.76; faces competitive pressure in software infrastructure.
- Key business drivers are subscription and circulation revenues, totaling over 2.5B USD in 2025, focused on identity management.
- Offers cloud-based identity security with adaptive multi-factor authentication and passwordless options; exposed to evolving cybersecurity trends.
UiPath Inc.
- Provides RPA automation platform; higher beta 1.08; competes in automation software sector.
- Revenue mainly from licenses and subscription services, totaling approximately 1.39B USD in 2025, focused on automation.
- Combines AI and robotic process automation with low-code environments; vulnerable to rapid AI advancements.
Okta vs UiPath Positioning
Okta concentrates on identity management with a subscription-heavy model, benefiting from a focused product suite. UiPath diversifies across licenses and professional services, emphasizing automation with AI integration, presenting broader segment exposure.
Which has the best competitive advantage?
Both companies have slightly unfavorable MOAT ratings, shedding value but showing growing profitability trends. Okta has a smaller ROIC deficit relative to WACC, indicating a marginally stronger competitive advantage than UiPath.
Stock Comparison
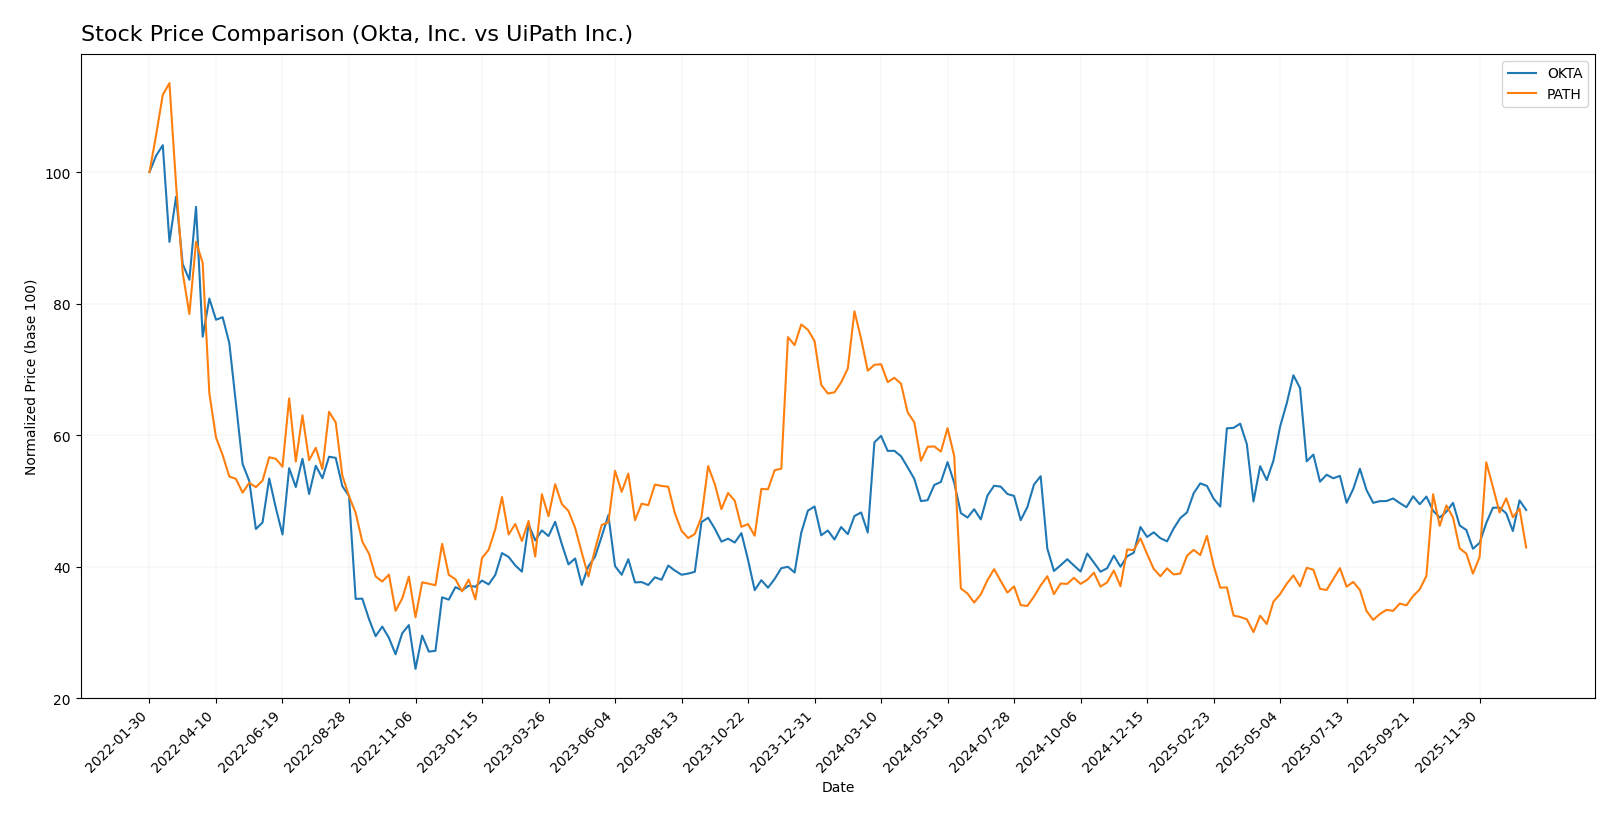
The stock price performance of Okta, Inc. (OKTA) and UiPath Inc. (PATH) over the past 12 months reveals divergent trends, with Okta showing a moderate uptrend and UiPath experiencing a significant decline, reflecting distinct trading dynamics.
Trend Analysis
Okta, Inc. exhibited a bullish trend over the past 12 months, with a price increase of 7.58% and accelerating momentum. The stock traded between 72.24 and 127.3, showing notable volatility with an 11.38 std deviation.
UiPath Inc. displayed a bearish trend with a price decline of 38.53% over the same period, also with accelerating downward momentum. The price ranged from 10.04 to 23.66, with lower volatility at 3.33 std deviation.
Comparing the two, Okta delivered the highest market performance with a positive 7.58% gain, while UiPath suffered a substantial loss of 38.53%, reflecting stronger buyer dominance for Okta overall.
Target Prices
The consensus target prices for Okta, Inc. and UiPath Inc. suggest moderate upside potential based on current market prices.
| Company | Target High | Target Low | Consensus |
|---|---|---|---|
| Okta, Inc. | 140 | 60 | 110.67 |
| UiPath Inc. | 19 | 14 | 16.6 |
Analysts expect Okta’s stock to rise from $89.55 to an average target near $110.67, indicating upside potential. UiPath’s consensus target of $16.6 is slightly above its current price of $14.34, suggesting mild positive momentum.
Analyst Opinions Comparison
This section compares analysts’ ratings and grades for Okta, Inc. and UiPath Inc.:
Rating Comparison
Okta, Inc. Rating
- Rating: B, evaluated as Very Favorable overall.
- Discounted Cash Flow Score: 4, indicating favorable valuation based on cash flows.
- ROE Score: 2, a moderate measure of profit generation efficiency from equity.
- ROA Score: 3, moderate effectiveness in using assets to generate earnings.
- Debt To Equity Score: 4, favorable financial stability with low reliance on debt.
- Overall Score: 3, representing a moderate overall financial standing.
UiPath Inc. Rating
- Rating: B+, also rated Very Favorable overall.
- Discounted Cash Flow Score: 3, representing a moderate valuation assessment.
- ROE Score: 4, reflecting a favorable ability to generate profit from shareholders’ equity.
- ROA Score: 4, favorable asset utilization to produce earnings.
- Debt To Equity Score: 4, also favorable, indicating strong balance sheet management.
- Overall Score: 3, likewise moderate in overall financial assessment.
Which one is the best rated?
UiPath holds a slightly higher rating of B+ compared to Okta’s B. UiPath scores better on ROE and ROA, indicating stronger profitability and asset utilization, while both share similar overall and debt-to-equity scores.
Scores Comparison
Here is a comparison of the Altman Z-Score and Piotroski Score for Okta and UiPath:
Okta Scores
- Altman Z-Score: 4.15, indicating a safe zone with low bankruptcy risk.
- Piotroski Score: 8, classified as very strong financial health.
UiPath Scores
- Altman Z-Score: 5.27, also in the safe zone, indicating low bankruptcy risk.
- Piotroski Score: 7, classified as strong financial health.
Which company has the best scores?
UiPath has a higher Altman Z-Score, indicating slightly lower bankruptcy risk, while Okta has a better Piotroski Score, showing stronger financial health. Both companies are financially stable but excel in different score categories.
Grades Comparison
Here is a comparison of the latest available grades from verified grading companies for Okta, Inc. and UiPath Inc.:
Okta, Inc. Grades
The following table summarizes recent grades assigned by reputable grading firms for Okta, Inc.:
| Grading Company | Action | New Grade | Date |
|---|---|---|---|
| Stephens & Co. | Upgrade | Overweight | 2026-01-14 |
| Piper Sandler | Maintain | Neutral | 2026-01-05 |
| RBC Capital | Maintain | Outperform | 2026-01-05 |
| Jefferies | Upgrade | Buy | 2025-12-16 |
| Needham | Maintain | Buy | 2025-12-12 |
| BTIG | Maintain | Buy | 2025-12-04 |
| Susquehanna | Maintain | Neutral | 2025-12-03 |
| Cantor Fitzgerald | Maintain | Overweight | 2025-12-03 |
| Canaccord Genuity | Maintain | Buy | 2025-12-03 |
| Scotiabank | Maintain | Sector Perform | 2025-12-03 |
Okta’s grades show a positive trend with multiple upgrades and several buy or overweight ratings, indicating overall confidence from analysts.
UiPath Inc. Grades
The following table summarizes recent grades assigned by reputable grading firms for UiPath Inc.:
| Grading Company | Action | New Grade | Date |
|---|---|---|---|
| Barclays | Maintain | Equal Weight | 2026-01-12 |
| RBC Capital | Maintain | Sector Perform | 2026-01-05 |
| RBC Capital | Maintain | Sector Perform | 2025-12-10 |
| Morgan Stanley | Maintain | Equal Weight | 2025-12-09 |
| DA Davidson | Maintain | Neutral | 2025-12-05 |
| Canaccord Genuity | Maintain | Buy | 2025-12-04 |
| Mizuho | Maintain | Neutral | 2025-12-04 |
| RBC Capital | Maintain | Sector Perform | 2025-12-04 |
| Wells Fargo | Maintain | Equal Weight | 2025-12-04 |
| Evercore ISI Group | Maintain | In Line | 2025-12-04 |
UiPath’s grades are generally stable, with most ratings maintaining equal weight, sector perform, or neutral positions, indicating a cautious stance from analysts.
Which company has the best grades?
Okta, Inc. has received notably stronger grades, including multiple buy and overweight ratings and recent upgrades, compared to UiPath Inc.’s predominantly neutral and sector perform grades. This difference may influence investor perception of growth potential and risk exposure.
Strengths and Weaknesses
Here is a comparative overview of the strengths and weaknesses of Okta, Inc. and UiPath Inc. based on their latest financial and operational data.
| Criterion | Okta, Inc. (OKTA) | UiPath Inc. (PATH) |
|---|---|---|
| Diversification | Primarily subscription-based with minor technology services; growing subscription revenue (2.56B in 2025). | Balanced revenue from licenses (587M), subscription services (802M), and professional services (71M) in 2025. |
| Profitability | Slightly profitable with low net margin (1.07%) and ROIC negative (-0.61%), but improving ROIC trend. | Unprofitable with negative net margin (-5.15%) and ROIC (-7.41%), though ROIC is growing. |
| Innovation | High fixed asset turnover (22.31) indicating efficient use of assets for innovation delivery. | Good fixed asset turnover (14.41), supporting innovation but less efficient than Okta. |
| Global presence | Strong global presence suggested by growing revenues and stable financial ratios. | Also global, with growing revenues but weaker profitability and coverage ratios. |
| Market Share | Subscription market leader with continued revenue growth; however, high P/E (570.6) may indicate overvaluation. | Market presence solid but challenged by negative earnings; P/E ratio negative, reflecting losses. |
Key takeaways: Both companies are in growth phases with increasing ROIC trends but currently destroy value. Okta shows better profitability and asset efficiency, while UiPath’s diversified revenue and stronger liquidity ratios offer resilience despite profitability challenges. Investors should weigh growth potential against current value destruction risks.
Risk Analysis
Below is a comparison of key risk factors for Okta, Inc. (OKTA) and UiPath Inc. (PATH) based on the latest 2025 data:
| Metric | Okta, Inc. (OKTA) | UiPath Inc. (PATH) |
|---|---|---|
| Market Risk | Beta 0.76, lower volatility | Beta 1.08, moderate volatility |
| Debt level | Low debt-to-equity 0.15, favorable | Very low debt-to-equity 0.04, favorable |
| Regulatory Risk | Moderate, software sector compliance | Moderate, software sector compliance |
| Operational Risk | Moderate, with stable asset turnover | Elevated, negative margins and ROIC |
| Environmental Risk | Low, minimal direct impact | Low, minimal direct impact |
| Geopolitical Risk | Moderate, global operations | Moderate, global operations |
The most impactful risks are operational and market-related. UiPath shows higher operational risk due to persistent negative margins (-5.15%) and return on invested capital (-7.41%), signaling challenges in profitability. Okta maintains better financial health with positive but slim net margin (1.07%) and stronger liquidity. Both face regulatory and geopolitical risks typical for global tech firms, but low debt levels mitigate financial distress concerns. Caution is advised with UiPath’s profitability and interest coverage (zero), while Okta’s high P/E ratio (570.6) suggests valuation risk.
Which Stock to Choose?
Okta, Inc. shows a favorable income evolution with revenue growth of 15.33% in 2025 and strong profitability improvements. Its financial ratios present a balanced profile with a neutral global evaluation, supported by low debt and good interest coverage. The company’s rating is very favorable, reflecting solid financial health despite some unfavorable metrics like a high P/E ratio.
UiPath Inc. demonstrates moderate income growth with a 9.3% revenue increase in 2025 but faces challenges in profitability, reflected in negative net margins and operating returns. Its financial ratios are slightly unfavorable overall, although liquidity and low debt levels remain strengths. UiPath’s rating is very favorable, supported mainly by solid return on equity and assets scores.
Considering their ratings and financial evaluations, growth-focused investors might find Okta’s improving profitability and balanced ratios more appealing, while those valuing liquidity and financial stability could see UiPath as a more cautious option. Both companies show value destruction but improving profitability, suggesting different risk profiles for potential investors.
Disclaimer: Investment carries a risk of loss of initial capital. The past performance is not a reliable indicator of future results. Be sure to understand risks before making an investment decision.
Go Further
I encourage you to read the complete analyses of Okta, Inc. and UiPath Inc. to enhance your investment decisions: