In the rapidly evolving technology sector, Okta, Inc. and Teradata Corporation stand out as leaders in software infrastructure, each driving innovation in identity management and data analytics, respectively. Okta excels in secure identity solutions, while Teradata focuses on multi-cloud data platforms. Their overlapping market segments and strategic emphasis on enterprise solutions make them compelling for comparison. This article will help you decide which company holds the most promise for your investment portfolio.

Table of contents
Companies Overview
I will begin the comparison between Okta and Teradata by providing an overview of these two companies and their main differences.
Okta Overview
Okta, Inc. specializes in identity solutions for enterprises, SMBs, universities, non-profits, and government agencies worldwide. Its flagship product, Okta Identity Cloud, offers cloud-based identity and access management services, including Single Sign-On and Adaptive Multi-Factor Authentication. Founded in 2009 and based in San Francisco, Okta positions itself as a leader in secure identity infrastructure with a market cap of approximately 15.2B USD.
Teradata Overview
Teradata Corporation delivers a connected multi-cloud data platform for enterprise analytics, focusing on data integration and ecosystem simplification. Its Teradata Vantage platform supports companies in leveraging data for analytics and migration to the cloud. Established in 1979 and headquartered in San Diego, Teradata serves various sectors globally and holds a market capitalization near 2.8B USD.
Key similarities and differences
Both Okta and Teradata operate in the Software – Infrastructure industry, providing cloud-based technology solutions to enterprises. Okta centers on identity and access management, enhancing security and user authentication, while Teradata emphasizes data analytics and multi-cloud data management. Their business models include direct sales forces and global reach, but they target distinct aspects of enterprise IT infrastructure with different core product offerings.
Income Statement Comparison
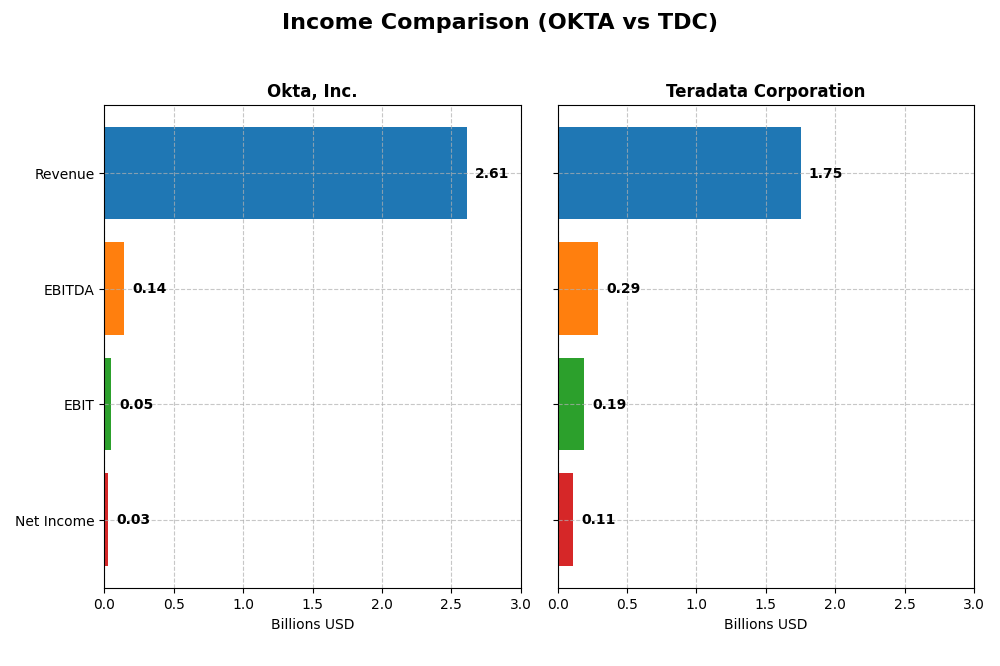
This table presents a side-by-side comparison of key income statement metrics for Okta, Inc. and Teradata Corporation for their most recent fiscal years.
| Metric | Okta, Inc. (2025) | Teradata Corporation (2024) |
|---|---|---|
| Market Cap | 15.2B | 2.8B |
| Revenue | 2.61B | 1.75B |
| EBITDA | 139M | 293M |
| EBIT | 51M | 193M |
| Net Income | 28M | 114M |
| EPS | 0.17 | 1.18 |
| Fiscal Year | 2025 | 2024 |
Income Statement Interpretations
Okta, Inc.
Okta’s revenue grew substantially from $835M in 2021 to $2.61B in 2025, with net income improving from a loss of $266M to a positive $28M. Gross margin remained strong at 76.32%, while net margin turned positive to 1.07%. In 2025, the company showed significant margin improvements and strong growth momentum across key profitability metrics.
Teradata Corporation
Teradata’s revenue slightly declined from $1.84B in 2020 to $1.75B in 2024, with net income decreasing from $129M to $114M. Despite the revenue decrease, gross margin held steady around 60.46%, and net margin improved to 6.51%. The 2024 results showed margin expansion and earnings growth, even as top-line growth slowed.
Which one has the stronger fundamentals?
Okta demonstrates robust revenue and net income growth with improving margins and profitability in recent years, reflecting strong operational scaling. Teradata shows stable margins and positive net income but faces declining revenue and net income over the period. Overall, Okta’s fundamentals indicate more pronounced growth and margin improvement, while Teradata maintains steadier profitability amid shrinking revenue.
Financial Ratios Comparison
The following table presents a side-by-side comparison of key financial ratios for Okta, Inc. and Teradata Corporation based on their most recent fiscal year data, providing a clear view of their financial performance and position.
| Ratios | Okta, Inc. (2025) | Teradata Corporation (2024) |
|---|---|---|
| ROE | 0.44% | 85.7% |
| ROIC | -0.61% | 16.9% |
| P/E | 570.6 | 26.3 |
| P/B | 2.49 | 22.6 |
| Current Ratio | 1.35 | 0.81 |
| Quick Ratio | 1.35 | 0.79 |
| D/E (Debt to Equity) | 0.15 | 4.33 |
| Debt-to-Assets | 10.1% | 33.8% |
| Interest Coverage | -14.8 | 7.21 |
| Asset Turnover | 0.28 | 1.03 |
| Fixed Asset Turnover | 22.31 | 9.07 |
| Payout Ratio | 0% | 0% |
| Dividend Yield | 0% | 0% |
Interpretation of the Ratios
Okta, Inc.
Okta shows a mixed financial profile with several unfavorable ratios including low net margin (1.07%) and return on equity (0.44%), alongside a negative return on invested capital (-0.61%). However, it benefits from a favorable weighted average cost of capital (7.18%), low debt-to-equity (0.15), and strong interest coverage (10.2). Okta does not pay dividends, likely reflecting a reinvestment strategy in growth and product development.
Teradata Corporation
Teradata exhibits strong profitability ratios, such as an 85.71% return on equity and 16.89% return on invested capital, supported by a low weighted average cost of capital at 5.85%. Some weaknesses include unfavorable price-to-book (22.58) and debt-to-equity (4.33) ratios, plus weak liquidity indicated by a current ratio of 0.81. Teradata also does not pay dividends, possibly prioritizing reinvestment and operational growth.
Which one has the best ratios?
Both companies have an equal proportion of favorable and unfavorable ratios, resulting in a neutral overall evaluation. Okta demonstrates better liquidity and lower leverage, while Teradata shows superior profitability metrics but weaker liquidity and higher leverage. The balance of strengths and weaknesses suggests neither company clearly outperforms the other on financial ratios alone.
Strategic Positioning
This section compares the strategic positioning of Okta, Inc. and Teradata Corporation, including their market position, key segments, and exposure to technological disruption:
Okta, Inc.
- Leading identity solutions provider with moderate beta; faces competition in cloud security software.
- Focuses on subscription-based identity cloud services and technology services; key driver is cloud security.
- Positioned in a rapidly evolving cloud identity space with exposure to adaptive security and authentication disruptions.
Teradata Corporation
- Established multi-cloud data platform vendor with low beta; competes in enterprise analytics market.
- Diverse revenue from consulting, recurring products, services, and subscription software licenses in analytics.
- Exposed to cloud migration and multi-cloud ecosystem disruption, with strong consulting and platform integration.
Okta vs Teradata Positioning
Okta concentrates on identity cloud solutions with subscription revenues driving growth, while Teradata offers a diversified multi-cloud analytics platform and consulting services. Okta’s focus on security contrasts with Teradata’s broader enterprise data strategy. Each has distinct market and technological exposures.
Which has the best competitive advantage?
Teradata demonstrates a very favorable moat with ROIC well above WACC and strong growth, indicating durable competitive advantage. Okta shows slightly unfavorable moat status despite growing ROIC, suggesting challenges in value creation.
Stock Comparison
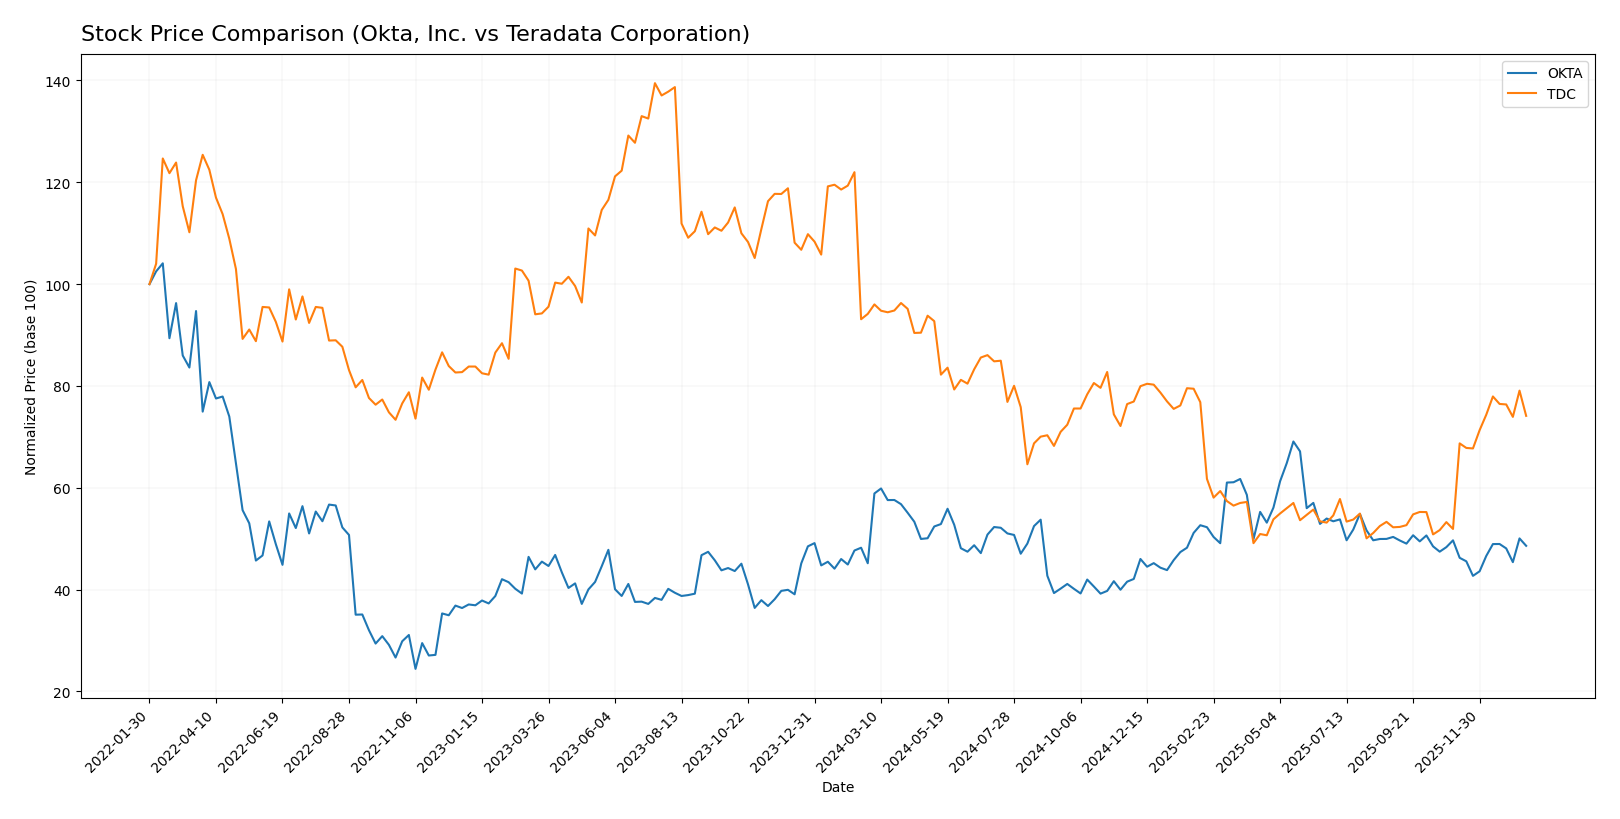
The stock prices of Okta, Inc. and Teradata Corporation have experienced contrasting movements over the past year, with Okta showing a clear upward trend while Teradata faced a significant decline followed by recent recovery attempts.
Trend Analysis
Okta, Inc. recorded a bullish trend over the past 12 months, with a 7.58% price increase and accelerating momentum. The stock ranged between 72.24 and 127.3, showing notable volatility with an 11.38 std deviation.
Teradata Corporation exhibited a bearish trend over the same period, with a 21.26% price decline accompanied by accelerating downside pressure. The stock traded between 19.73 and 38.67, with moderate volatility measured by a 5.63 std deviation.
Comparing their recent trends, Okta’s price slightly decreased by 2.16%, maintaining a neutral near-term trend, while Teradata surged by 42.78%. Overall, Okta delivered the highest market performance over the past year despite Teradata’s recent rebound.
Target Prices
Analysts present a clear target price consensus for both Okta, Inc. and Teradata Corporation, indicating expected stock performance ranges.
| Company | Target High | Target Low | Consensus |
|---|---|---|---|
| Okta, Inc. | 140 | 60 | 110.67 |
| Teradata Corporation | 35 | 27 | 31 |
The consensus target prices suggest upside potential for Okta, trading currently at $89.55, and moderate growth for Teradata, whose price stands at $29.77. Overall, analysts expect both stocks to appreciate relative to current market prices.
Analyst Opinions Comparison
This section compares analysts’ ratings and grades for Okta, Inc. and Teradata Corporation:
Rating Comparison
Okta, Inc. Rating
- Rating: B, categorized as Very Favorable.
- Discounted Cash Flow Score: 4, indicating Favorable valuation.
- ROE Score: 2, reflecting Moderate efficiency in generating profit from equity.
- ROA Score: 3, indicating Moderate asset utilization effectiveness.
- Debt To Equity Score: 4, suggesting a Favorable balance sheet with lower financial risk.
- Overall Score: 3, rated as Moderate overall financial standing.
Teradata Corporation Rating
- Rating: B+, categorized as Very Favorable.
- Discounted Cash Flow Score: 4, indicating Favorable valuation.
- ROE Score: 5, showing Very Favorable profit generation from equity.
- ROA Score: 4, indicating Favorable asset utilization effectiveness.
- Debt To Equity Score: 1, indicating Very Unfavorable financial risk due to higher debt.
- Overall Score: 3, rated as Moderate overall financial standing.
Which one is the best rated?
Teradata holds a slightly better rating (B+) than Okta (B) and excels significantly in ROE and ROA scores, while Okta shows a stronger debt-to-equity position. Both share the same overall moderate score.
Scores Comparison
The following table presents a comparison of Okta and Teradata’s financial health scores:
Okta Scores
- Altman Z-Score: 4.15, indicating a safe zone with low bankruptcy risk.
- Piotroski Score: 8, reflecting very strong financial strength.
Teradata Scores
- Altman Z-Score: 0.81, indicating distress zone and high bankruptcy risk.
- Piotroski Score: 8, reflecting very strong financial strength.
Which company has the best scores?
Okta has a significantly higher Altman Z-Score, placing it in the safe zone, while Teradata is in distress. Both companies share equally strong Piotroski Scores. Overall, Okta shows better financial stability in this comparison.
Grades Comparison
The following tables summarize the recent grades assigned to Okta, Inc. and Teradata Corporation by reputable grading firms:
Okta, Inc. Grades
This table presents the latest grade changes and maintenance actions for Okta, Inc. by various analysts.
| Grading Company | Action | New Grade | Date |
|---|---|---|---|
| Stephens & Co. | Upgrade | Overweight | 2026-01-14 |
| Piper Sandler | Maintain | Neutral | 2026-01-05 |
| RBC Capital | Maintain | Outperform | 2026-01-05 |
| Jefferies | Upgrade | Buy | 2025-12-16 |
| Needham | Maintain | Buy | 2025-12-12 |
| BTIG | Maintain | Buy | 2025-12-04 |
| Susquehanna | Maintain | Neutral | 2025-12-03 |
| Cantor Fitzgerald | Maintain | Overweight | 2025-12-03 |
| Canaccord Genuity | Maintain | Buy | 2025-12-03 |
| Scotiabank | Maintain | Sector Perform | 2025-12-03 |
The overall trend for Okta shows predominantly positive ratings with several upgrades and multiple maintained Buy and Overweight grades.
Teradata Corporation Grades
This table shows Teradata Corporation’s recent grades and actions from various respected grading companies.
| Grading Company | Action | New Grade | Date |
|---|---|---|---|
| Barclays | Maintain | Underweight | 2026-01-12 |
| RBC Capital | Maintain | Sector Perform | 2026-01-05 |
| Morgan Stanley | Maintain | Overweight | 2025-12-17 |
| Citizens | Upgrade | Market Outperform | 2025-11-10 |
| Barclays | Maintain | Underweight | 2025-11-05 |
| TD Cowen | Maintain | Hold | 2025-11-05 |
| Evercore ISI Group | Maintain | Outperform | 2025-11-05 |
| UBS | Maintain | Neutral | 2025-08-06 |
| Guggenheim | Maintain | Buy | 2025-05-07 |
| Barclays | Maintain | Underweight | 2025-04-21 |
Teradata’s grading pattern is mixed, with some positive ratings but a recurring Underweight position from Barclays and a consensus Hold rating.
Which company has the best grades?
Okta, Inc. has received a stronger and more consistent set of grades, including multiple Buy and Overweight ratings and recent upgrades. Teradata’s ratings are more mixed, with a Hold consensus and recurring Underweight grades, potentially indicating higher caution among analysts. This difference may influence investor sentiment about growth and risk profiles.
Strengths and Weaknesses
Below is a summary comparison of key strengths and weaknesses for Okta, Inc. and Teradata Corporation based on their latest financial and operational data.
| Criterion | Okta, Inc. | Teradata Corporation |
|---|---|---|
| Diversification | Limited product range, mainly subscription services (2.6B USD in 2025) | More diversified with recurring products and consulting services, totaling ~2.8B USD in recurring revenues in 2024 |
| Profitability | Low profitability, net margin 1.07%, ROIC -0.61% (value destroying) | Higher profitability, net margin 6.51%, ROIC 16.89% (value creating) |
| Innovation | Strong innovation focus in identity management, growing ROIC trend despite value destruction | Steady innovation in data analytics and software, very favorable ROIC trend |
| Global presence | Moderate, primarily North America focus | Broad global presence with significant international revenues |
| Market Share | Leader in identity management niche | Strong player in data analytics and enterprise software markets |
Key takeaways: Teradata shows stronger profitability and a durable competitive advantage with diversified offerings and global reach. Okta demonstrates fast growth and innovation but faces challenges with profitability and value creation. Investors should weigh growth potential against current financial health.
Risk Analysis
The table below summarizes key risk factors for Okta, Inc. and Teradata Corporation based on the latest available data from 2025 and 2024.
| Metric | Okta, Inc. | Teradata Corporation |
|---|---|---|
| Market Risk | Moderate (Beta 0.76) | Lower (Beta 0.57) |
| Debt level | Low (Debt/Equity 0.15) | High (Debt/Equity 4.33) |
| Regulatory Risk | Moderate | Moderate |
| Operational Risk | Moderate | Moderate |
| Environmental Risk | Low | Low |
| Geopolitical Risk | Moderate (US focus) | Moderate (US focus) |
Both companies face moderate market risk, but Okta has a slightly higher beta, indicating more sensitivity to market fluctuations. Teradata’s high debt-to-equity ratio (4.33) signals elevated financial leverage risk, while Okta maintains a conservative debt profile. Regulatory and operational risks are similar, given their technology infrastructure sector exposure. Neither company shows significant environmental risk. Geopolitical risks stem mainly from their US headquarters and global operations. Overall, Teradata’s financial leverage and Okta’s market sensitivity are the most impactful risks to monitor closely.
Which Stock to Choose?
Okta, Inc. shows a strong income growth with a 15.33% revenue increase in 2025 and favorable income statement metrics, despite low profitability ratios such as a 1.07% net margin and 0.44% ROE. Its debt metrics and liquidity ratios are favorable, and it holds a “Very Favorable” B rating. However, its ROIC is negative and below WACC, indicating value destruction but with a growing profitability trend.
Teradata Corporation exhibits stable profitability with a 6.51% net margin and very high 85.71% ROE, alongside favorable returns on invested capital exceeding WACC, signaling value creation and a durable competitive advantage. Its financial ratios are mixed, with some unfavorable liquidity and debt scores, but it maintains a “Very Favorable” B+ rating. Revenue growth is negative overall, though recent profitability metrics are positive.
Investors focused on growth and improving profitability might find Okta’s accelerating revenue and improving margins appealing, while those prioritizing value creation and high returns on equity may view Teradata’s strong ROE and positive ROIC trend as more attractive. Both present neutral global financial ratios and favorable income evaluations, suggesting choices could depend on risk tolerance and investment strategy.
Disclaimer: Investment carries a risk of loss of initial capital. The past performance is not a reliable indicator of future results. Be sure to understand risks before making an investment decision.
Go Further
I encourage you to read the complete analyses of Okta, Inc. and Teradata Corporation to enhance your investment decisions: