In the fast-evolving software infrastructure sector, Synopsys, Inc. (SNPS) and Okta, Inc. (OKTA) stand out as influential players with distinct yet overlapping market roles. Synopsys leads in electronic design automation, while Okta specializes in identity and access management solutions. Their innovation strategies drive growth in technology’s backbone, making this comparison essential. Join me as we analyze which company presents the most compelling investment opportunity for your portfolio.
Table of contents
Companies Overview
I will begin the comparison between Synopsys and Okta by providing an overview of these two companies and their main differences.
Synopsys Overview
Synopsys, Inc. specializes in electronic design automation software used to design and test integrated circuits. Its product portfolio includes digital design solutions, verification platforms, FPGA design, and intellectual property cores covering various protocols and applications. Synopsys serves diverse sectors such as electronics, automotive, medicine, and energy, positioning itself as a leader in semiconductor design infrastructure since its founding in 1986.
Okta Overview
Okta, Inc. provides identity management solutions targeting enterprises, SMBs, universities, non-profits, and government agencies globally. Its Okta Identity Cloud platform offers services like single sign-on, adaptive multi-factor authentication, lifecycle management, and API security. Founded in 2009, Okta focuses on cloud-based identity and access management to enhance security and user experience across applications and devices.
Key similarities and differences
Both Synopsys and Okta operate in the software infrastructure industry but target different niches: Synopsys focuses on semiconductor design automation, while Okta specializes in identity and access management solutions. Synopsys’s offerings are hardware design-centric with a broad industrial customer base, whereas Okta’s cloud-based platform serves security and identity needs across various organizations. Their business models differ in product complexity and end-user focus, reflecting distinct market demands.
Income Statement Comparison
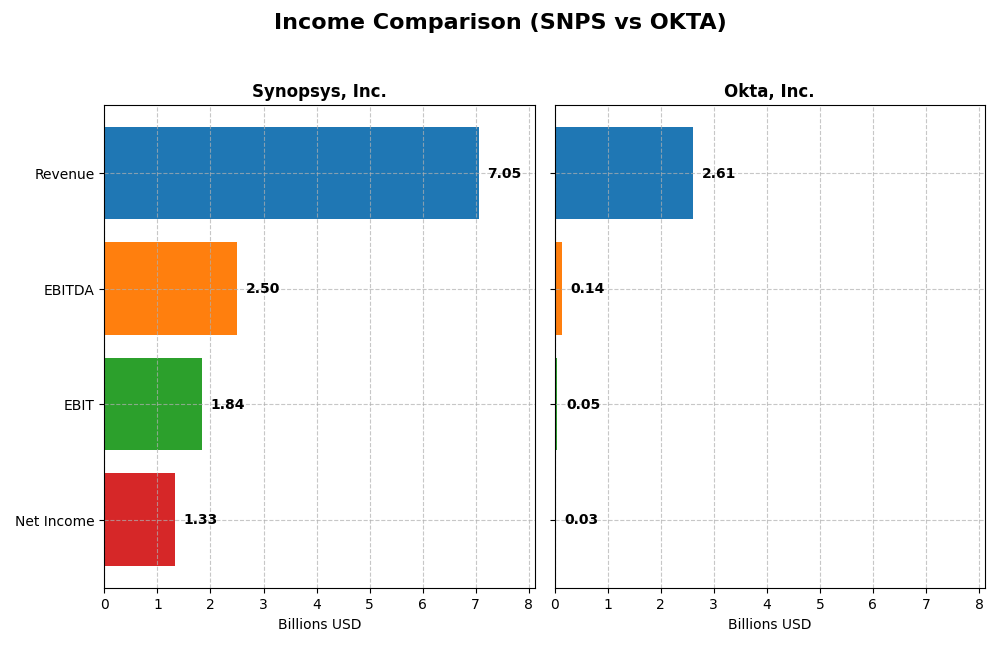
Below is a side-by-side comparison of key income statement metrics for Synopsys, Inc. and Okta, Inc. for their most recent fiscal years.
| Metric | Synopsys, Inc. (SNPS) | Okta, Inc. (OKTA) |
|---|---|---|
| Market Cap | 98.8B | 15.2B |
| Revenue | 7.05B | 2.61B |
| EBITDA | 2.50B | 139M |
| EBIT | 1.84B | 51M |
| Net Income | 1.33B | 28M |
| EPS | 8.13 | 0.17 |
| Fiscal Year | 2025 | 2025 |
Income Statement Interpretations
Synopsys, Inc.
From 2021 to 2025, Synopsys, Inc. showed a consistent upward trend in revenue, growing by nearly 68%, supported by a favorable gross margin of 77%. Net income also increased overall, although it declined significantly in 2025 compared to the prior year. The net margin remained stable at about 19%, but EPS dropped by 45% in the latest year, signaling a slowdown in profitability despite higher revenues and EBIT growth.
Okta, Inc.
Okta, Inc. experienced robust revenue growth of over 210% from 2021 to 2025, with gross margins steady near 76%. Net income turned positive recently after several loss-making years, reflected in a net margin improving to just above 1%. EBIT and net margin both grew sharply in 2025, with EPS more than doubling. Operating expenses grew proportionally with revenue, indicating controlled scalability in their cost structure.
Which one has the stronger fundamentals?
Both companies show favorable income statement trends, but Okta’s faster revenue and net income growth rates, coupled with improving profitability margins, highlight strong momentum. Synopsys maintains higher absolute profitability and margins but faced a recent net income and EPS decline. Okta’s consistent margin improvements and positive net income growth suggest strengthening fundamentals, while Synopsys shows stable but slowing net margin expansion.
Financial Ratios Comparison
The following table presents a side-by-side comparison of key financial ratios for Synopsys, Inc. (SNPS) and Okta, Inc. (OKTA) based on their most recent fiscal year data.
| Ratios | Synopsys, Inc. (SNPS) FY 2025 | Okta, Inc. (OKTA) FY 2025 |
|---|---|---|
| ROE | 4.72% | 0.44% |
| ROIC | 1.97% | -0.61% |
| P/E | 54.36 | 570.60 |
| P/B | 2.57 | 2.49 |
| Current Ratio | 1.62 | 1.35 |
| Quick Ratio | 1.52 | 1.35 |
| D/E | 0.50 | 0.15 |
| Debt-to-Assets | 29.6% | 10.1% |
| Interest Coverage | 2.05 | -14.8 |
| Asset Turnover | 0.15 | 0.28 |
| Fixed Asset Turnover | 5.04 | 22.31 |
| Payout Ratio | 0 | 0 |
| Dividend Yield | 0% | 0% |
Interpretation of the Ratios
Synopsys, Inc.
Synopsys shows a balanced ratio profile with 35.7% favorable and 35.7% unfavorable ratings, indicating mixed financial health. Strengths include a solid current ratio (1.62) and low debt-to-assets (29.64%), while weaker points are a low return on equity (4.72%) and high price-to-earnings ratio (54.36). The company does not pay dividends, likely focusing on reinvestment and growth.
Okta, Inc.
Okta’s ratios present a similar split, with 42.9% favorable and 42.9% unfavorable, suggesting a challenging financial position. It benefits from low leverage (debt-to-assets 10.09%) and strong interest coverage (10.2), but suffers from low profitability metrics, including a net margin of 1.07% and negative return on invested capital (-0.61%). Okta also pays no dividends, probably prioritizing growth and R&D investments.
Which one has the best ratios?
Both companies exhibit a neutral overall ratio profile with comparable proportions of favorable and unfavorable metrics. Synopsys demonstrates stronger liquidity and asset turnover, while Okta shows better debt management and coverage ratios. However, neither company pays dividends, reflecting ongoing reinvestment or growth strategies rather than shareholder distributions.
Strategic Positioning
This section compares the strategic positioning of Synopsys, Inc. and Okta, Inc. regarding Market position, Key segments, and Exposure to technological disruption:
Synopsys, Inc.
- Large market cap of 98.8B in semiconductor design software, facing software infrastructure competition.
- Core segments include electronic design automation licenses, maintenance, and technology services.
- Exposed to disruption through evolving semiconductor and SoC design technologies.
Okta, Inc.
- Smaller market cap of 15.2B focused on identity solutions with moderate competitive pressure.
- Key segments are subscription services and technology support in identity management.
- Faces disruption risk from cloud security and adaptive authentication advances.
Synopsys, Inc. vs Okta, Inc. Positioning
Synopsys operates a diversified business with multiple product lines in electronic design automation, while Okta concentrates on identity management solutions. Synopsys benefits from scale but faces complex technology demands; Okta’s narrower focus may allow agility but limits market breadth.
Which has the best competitive advantage?
Based on MOAT evaluation, Okta shows a slightly unfavorable moat but improving profitability, while Synopsys displays a very unfavorable moat with declining returns, indicating Okta currently holds a marginally stronger competitive position.
Stock Comparison
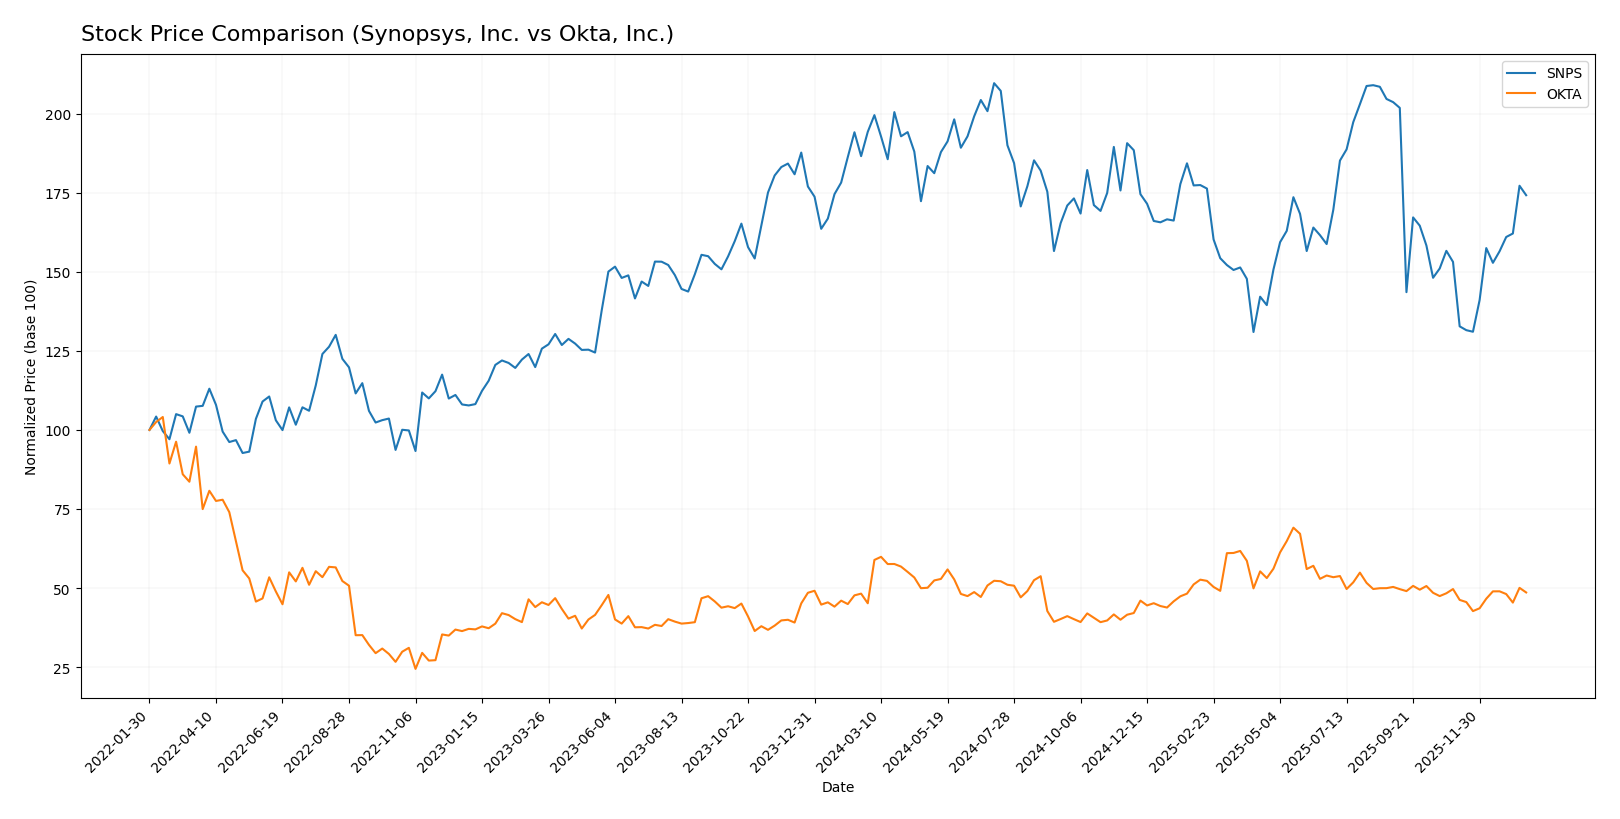
The past year revealed contrasting dynamics between Synopsys, Inc. and Okta, Inc., with Synopsys showing a prolonged bearish trend coupled with recent price recovery, while Okta maintained an overall bullish trajectory despite a recent slight pullback.
Trend Analysis
Synopsys, Inc. experienced a bearish trend over the past 12 months with a -10.31% price change, showing acceleration and high volatility (std deviation 58.85). The stock’s recent 2.5-month period reversed with a 13.77% gain and reduced volatility.
Okta, Inc. demonstrated a bullish trend over the past year with a 7.58% increase, accelerating and lower volatility (std deviation 11.38). However, in the recent period, it faced a slight decline of -2.16% with minimal trend slope change.
Comparatively, Okta delivered the highest overall market performance with sustained gains, whereas Synopsys endured a net decline but showed promising short-term recovery in recent months.
Target Prices
Analysts present a clear consensus on the target prices for Synopsys, Inc. and Okta, Inc., reflecting optimistic outlooks.
| Company | Target High | Target Low | Consensus |
|---|---|---|---|
| Synopsys, Inc. | 600 | 425 | 530 |
| Okta, Inc. | 140 | 60 | 110.67 |
The consensus targets suggest potential upside for both stocks compared to current prices: Synopsys trades near 516.31 USD versus a 530 USD target, while Okta trades at 89.55 USD against a 110.67 USD consensus. This indicates moderate growth expectations by analysts.
Analyst Opinions Comparison
This section compares analysts’ ratings and grades for Synopsys, Inc. and Okta, Inc.:
Rating Comparison
Synopsys, Inc. Rating
- Rating: B- indicating a very favorable outlook
- Discounted Cash Flow Score: 3, showing a moderate valuation based on future cash flows
- ROE Score: 3, moderate efficiency in generating profit from equity
- ROA Score: 3, moderate asset utilization to generate earnings
- Debt To Equity Score: 2, moderate financial risk with higher leverage
- Overall Score: 3, moderate overall financial standing
Okta, Inc. Rating
- Rating: B indicating a very favorable outlook
- Discounted Cash Flow Score: 4, indicating a favorable valuation on discounted cash flow
- ROE Score: 2, moderate but lower efficiency in profit generation from equity
- ROA Score: 3, moderate asset utilization to generate earnings
- Debt To Equity Score: 4, favorable financial risk with lower leverage
- Overall Score: 3, moderate overall financial standing
Which one is the best rated?
Okta holds a slightly better rating with a B compared to Synopsys’s B-. Okta scores higher on discounted cash flow and debt-to-equity, while Synopsys outperforms slightly on return on equity. Overall scores for both are equal at 3.
Scores Comparison
Here is a comparison of the Altman Z-Score and Piotroski Score for Synopsys, Inc. and Okta, Inc.:
Synopsys Scores
- Altman Z-Score: 3.54, indicating a safe zone with low bankruptcy risk.
- Piotroski Score: 4, classified as average financial strength.
Okta Scores
- Altman Z-Score: 4.15, indicating a safe zone with low bankruptcy risk.
- Piotroski Score: 8, classified as very strong financial strength.
Which company has the best scores?
Okta has higher scores in both Altman Z-Score and Piotroski Score, indicating stronger financial health and lower bankruptcy risk compared to Synopsys based on the provided data.
Grades Comparison
The recent grades from reputable firms provide a detailed view of analysts’ sentiment on both Synopsys, Inc. and Okta, Inc.:
Synopsys, Inc. Grades
Below is a table showing recent grades from leading grading companies for Synopsys, Inc.
| Grading Company | Action | New Grade | Date |
|---|---|---|---|
| Piper Sandler | Downgrade | Neutral | 2026-01-13 |
| Morgan Stanley | Maintain | Overweight | 2025-12-12 |
| Rosenblatt | Maintain | Buy | 2025-12-11 |
| Keybanc | Maintain | Overweight | 2025-12-11 |
| Piper Sandler | Maintain | Overweight | 2025-12-11 |
| Needham | Maintain | Buy | 2025-12-11 |
| B of A Securities | Upgrade | Buy | 2025-12-11 |
| JP Morgan | Maintain | Overweight | 2025-12-11 |
| Wells Fargo | Maintain | Equal Weight | 2025-12-11 |
| Rosenblatt | Upgrade | Buy | 2025-12-09 |
The grades for Synopsys show a generally positive consensus with multiple buy and overweight ratings, despite a recent downgrade by Piper Sandler to neutral.
Okta, Inc. Grades
Below is a table showing recent grades from leading grading companies for Okta, Inc.
| Grading Company | Action | New Grade | Date |
|---|---|---|---|
| Stephens & Co. | Upgrade | Overweight | 2026-01-14 |
| Piper Sandler | Maintain | Neutral | 2026-01-05 |
| RBC Capital | Maintain | Outperform | 2026-01-05 |
| Jefferies | Upgrade | Buy | 2025-12-16 |
| Needham | Maintain | Buy | 2025-12-12 |
| BTIG | Maintain | Buy | 2025-12-04 |
| Susquehanna | Maintain | Neutral | 2025-12-03 |
| Cantor Fitzgerald | Maintain | Overweight | 2025-12-03 |
| Canaccord Genuity | Maintain | Buy | 2025-12-03 |
| Scotiabank | Maintain | Sector Perform | 2025-12-03 |
Okta’s grades display a positive trend with several upgrades and multiple buy and overweight ratings, alongside stable neutral opinions.
Which company has the best grades?
Both Synopsys and Okta have predominantly positive grades, with consensus ratings at “Buy.” Okta shows a slightly stronger upgrade momentum and more instances of “Overweight” and “Outperform” ratings, which may indicate higher analyst confidence. Investors might interpret these differences as reflecting distinct risk and growth profiles.
Strengths and Weaknesses
Below is a comparison table highlighting the key strengths and weaknesses of Synopsys, Inc. (SNPS) and Okta, Inc. (OKTA) based on the most recent financial and operational data.
| Criterion | Synopsys, Inc. (SNPS) | Okta, Inc. (OKTA) |
|---|---|---|
| Diversification | Strong product mix: License & Maintenance $3.49B, Technology Service $1.55B | Mainly Subscription-based $2.56B, limited service diversification |
| Profitability | Net margin 18.96% (favorable), but ROIC 1.97% below WACC; value shedding | Low net margin 1.07%, negative ROIC (-0.61%), but improving profitability trend |
| Innovation | Mature product portfolio with steady R&D investment | High innovation in identity management, growing ROIC indicating improving returns |
| Global presence | Established global footprint in semiconductor software | Expanding global identity security solutions presence |
| Market Share | Leading position in EDA software market with strong license revenue | Growing market share in cloud identity management but still emerging |
In summary, Synopsys offers diversified revenue streams and solid profitability but currently struggles to generate returns above its cost of capital, indicating value erosion. Okta shows weaker profitability but exhibits positive momentum in ROIC, signaling potential future value creation as it scales. Investors should weigh Synopsys’s mature stability against Okta’s growth prospects with cautious risk management.
Risk Analysis
Below is a comparative table outlining key risks for Synopsys, Inc. (SNPS) and Okta, Inc. (OKTA) based on their most recent 2025 financial and operational data.
| Metric | Synopsys, Inc. (SNPS) | Okta, Inc. (OKTA) |
|---|---|---|
| Market Risk | Moderate beta at 1.12; subject to tech sector volatility | Lower beta at 0.76; less volatile but still tech-sensitive |
| Debt level | Debt-to-assets 29.64% (neutral); interest coverage moderate at 4.12 | Low debt-to-assets 10.09%; strong interest coverage at 10.2 |
| Regulatory Risk | Moderate, linked to IP and export controls in semiconductor industry | Moderate, related to data privacy and cybersecurity regulations |
| Operational Risk | Complexity in SoC design platforms and IP integration | Dependency on cloud infrastructure and identity management security |
| Environmental Risk | Moderate, typical for tech hardware/software firms | Lower, mostly software with less physical environmental impact |
| Geopolitical Risk | Exposure due to global semiconductor supply chain | International client base may face geopolitical data access challenges |
Synopsys faces moderate market and operational risks tied to its semiconductor IP complexity and global supply chain, while Okta’s main concerns lie in regulatory and security risks amid evolving data privacy laws. Okta’s low leverage and strong interest coverage reduce financial risk, but both companies have high P/E ratios indicating valuation risk.
Which Stock to Choose?
Synopsys, Inc. (SNPS) shows favorable income growth with 15.12% revenue increase in 2025 and strong margins, but mixed profitability and debt metrics. Its financial ratios are split evenly between favorable and unfavorable, and it holds a very favorable B- rating. However, its economic moat is very unfavorable due to declining ROIC below WACC, indicating value destruction.
Okta, Inc. (OKTA) presents strong income growth over 2021-2025 with 212.57% revenue increase and mostly favorable income statement metrics in 2025. Financial ratios are balanced but slightly more favorable than unfavorable, and it has a very favorable B rating. The firm’s moat is slightly unfavorable with ROIC below WACC, yet showing improving profitability.
For investors prioritizing growth potential, Okta’s strong revenue and earnings growth alongside improving profitability might appear more attractive. Conversely, those focused on established stability and consistent income quality could find Synopsys’ solid margins and rating favorable despite its declining moat. The choice could vary depending on risk tolerance and investment strategy.
Disclaimer: Investment carries a risk of loss of initial capital. The past performance is not a reliable indicator of future results. Be sure to understand risks before making an investment decision.
Go Further
I encourage you to read the complete analyses of Synopsys, Inc. and Okta, Inc. to enhance your investment decisions: