In today’s fast-evolving tech landscape, Okta, Inc. and StoneCo Ltd. stand out as key players in software infrastructure, yet they serve distinct but overlapping markets. Okta leads in identity and access management solutions worldwide, while StoneCo drives digital payment innovations primarily in Brazil. Comparing their growth strategies and market positions reveals valuable insights, helping you decide which company holds the most promise for your investment portfolio.

Table of contents
Companies Overview
I will begin the comparison between Okta and StoneCo by providing an overview of these two companies and their main differences.
Okta Overview
Okta, Inc. focuses on providing identity solutions globally, serving enterprises, SMBs, universities, non-profits, and government agencies. Its flagship product, Okta Identity Cloud, offers a comprehensive suite including Single Sign-On, Multi-Factor Authentication, Lifecycle Management, and API Access Management. Headquartered in San Francisco, Okta is a key player in software infrastructure with a market cap of $15.2B and about 5,900 employees.
StoneCo Overview
StoneCo Ltd. delivers financial technology solutions primarily in Brazil, targeting merchants and integrated partners for electronic commerce across multiple channels. It distributes services through proprietary Stone Hubs and a dedicated sales force, supporting over 1.7M clients mostly SMBs. Founded in 2000 and headquartered in the Cayman Islands, StoneCo operates as a subsidiary of HR Holdings, with a market cap near $3.9B and around 7,200 staff.
Key similarities and differences
Both Okta and StoneCo operate in the technology sector with a focus on software infrastructure, yet their business models diverge significantly. Okta specializes in identity management solutions on a global scale, while StoneCo centers on fintech services in Brazil’s commerce ecosystem. Okta primarily sells cloud-based security products, whereas StoneCo offers payment and merchant solutions with a strong local sales presence. Their client bases also differ, with Okta serving a broad international audience versus StoneCo’s regional SMB market.
Income Statement Comparison
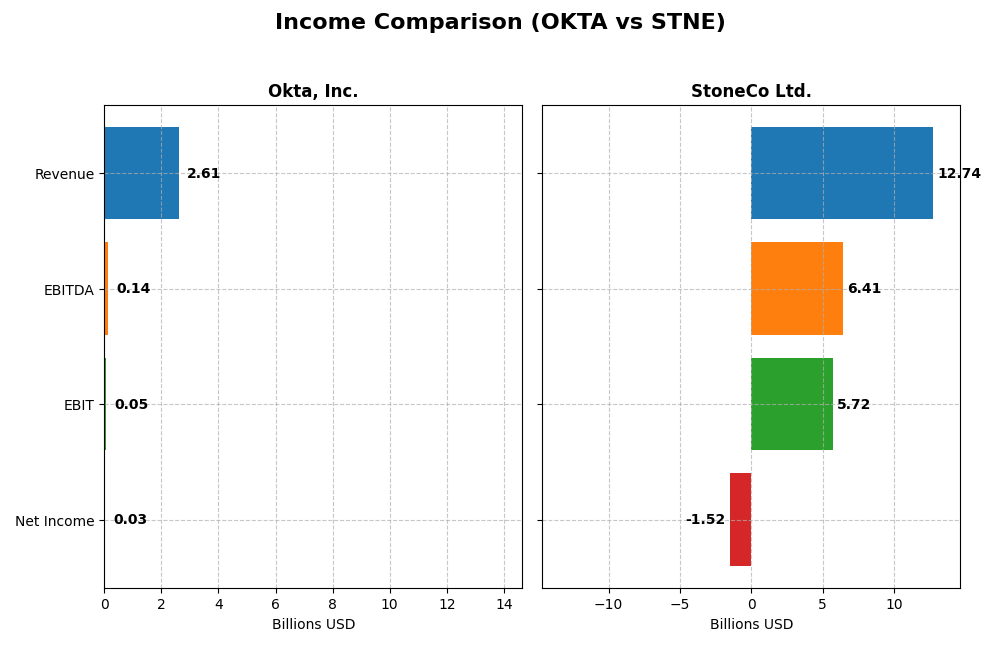
This table presents a side-by-side comparison of key income statement metrics for Okta, Inc. and StoneCo Ltd. for their most recent fiscal years.
| Metric | Okta, Inc. (2025) | StoneCo Ltd. (2024) |
|---|---|---|
| Market Cap | 15.2B USD | 3.9B USD |
| Revenue | 2.61B USD | 12.74B BRL |
| EBITDA | 139M USD | 6.41B BRL |
| EBIT | 51M USD | 5.72B BRL |
| Net Income | 28M USD | -1.52B BRL |
| EPS | 0.17 USD | -5.02 BRL |
| Fiscal Year | 2025 | 2024 |
Income Statement Interpretations
Okta, Inc.
Okta’s revenue demonstrated strong growth from $835M in 2021 to $2.61B in 2025, with net income turning positive in 2025 at $28M after consecutive losses. Gross margins remained favorable around 76%, while net margin improved to 1.07% in 2025. The most recent year showed significant margin recovery and growth acceleration, supported by a 15.33% revenue increase and over 100% net margin growth.
StoneCo Ltd.
StoneCo’s revenue expanded impressively from BRL 3.17B in 2020 to BRL 12.74B in 2024, but net income declined sharply, recording a loss of BRL 1.52B in 2024. While gross margin stayed favorable near 73%, net margin worsened to -11.89%. Despite continued positive revenue growth, the latest year reflected deteriorating profitability and negative trends in net income and EPS growth.
Which one has the stronger fundamentals?
Okta shows stronger fundamentals with consistent revenue and net income growth, improving margins, and favorable evaluations across most income statement metrics. StoneCo, despite robust top-line growth, struggles with sustained net losses and unfavorable net margin trends. Okta’s margin expansion and positive net income reversal contrast with StoneCo’s declining profitability, highlighting Okta’s more stable income statement performance.
Financial Ratios Comparison
The table below presents a comparison of key financial ratios for Okta, Inc. and StoneCo Ltd. based on their most recent fiscal year data, reflecting profitability, liquidity, leverage, efficiency, and dividend metrics.
| Ratios | Okta, Inc. (2025) | StoneCo Ltd. (2024) |
|---|---|---|
| ROE | 0.44% | -12.87% |
| ROIC | -0.61% | 22.41% |
| P/E | 570.6 | -9.84 |
| P/B | 2.49 | 1.27 |
| Current Ratio | 1.35 | 1.37 |
| Quick Ratio | 1.35 | 1.37 |
| D/E (Debt-to-Equity) | 0.15 | 1.10 |
| Debt-to-Assets | 10.1% | 23.5% |
| Interest Coverage | -14.8 | 5.57 |
| Asset Turnover | 0.28 | 0.23 |
| Fixed Asset Turnover | 22.3 | 6.95 |
| Payout ratio | 0 | 0 |
| Dividend yield | 0 | 0 |
Interpretation of the Ratios
Okta, Inc.
Okta shows a mixed ratio profile with notable weaknesses in profitability metrics: net margin at 1.07% and return on equity at 0.44%, both unfavorable, alongside a negative return on invested capital. However, liquidity and debt management ratios are favorable, including a quick ratio of 1.35 and debt-to-equity of 0.15. Okta does not pay dividends, reflecting its reinvestment strategy during growth, with no dividend yield and no share buybacks reported.
StoneCo Ltd.
StoneCo presents a slightly favorable ratio profile despite negative net margin (-11.89%) and return on equity (-12.87%), which are unfavorable. Its return on invested capital is strong at 22.41%, with favorable price-to-book at 1.27 and a current ratio of 1.37. The company does not distribute dividends, likely prioritizing reinvestment or growth, with zero dividend yield and moderate leverage (debt-to-assets 23.53%).
Which one has the best ratios?
StoneCo holds a slightly more favorable overall ratio evaluation, benefiting from strong return on invested capital and reasonable liquidity, despite profitability challenges. Okta’s ratios are more balanced but lean neutral, with better debt and liquidity metrics yet weak profitability. Both companies do not pay dividends, reflecting reinvestment priorities rather than shareholder returns.
Strategic Positioning
This section compares the strategic positioning of Okta and StoneCo, including market position, key segments, and exposure to technological disruption:
Okta, Inc.
- Leading identity solutions provider facing competition in software infrastructure.
- Focused on identity cloud services, including authentication and lifecycle management.
- Positioned in cloud-based security and authentication, adapting to evolving cyber threats.
StoneCo Ltd.
- Financial technology provider targeting Brazilian merchants amid intense fintech competition.
- Delivers electronic commerce solutions mainly to small and medium-sized businesses in Brazil.
- Relies on hyper-local sales and proprietary hubs, integrating digital and in-store commerce.
Okta, Inc. vs StoneCo Ltd. Positioning
Okta’s strategy concentrates on cloud identity and security solutions globally, while StoneCo focuses on fintech services for Brazilian merchants. Okta benefits from a specialized product suite, whereas StoneCo leverages localized sales and broad merchant integration. Both face competitive pressures in dynamic technology sectors.
Which has the best competitive advantage?
StoneCo shows a very favorable moat with growing ROIC exceeding WACC, indicating durable competitive advantage and increasing profitability. Okta’s moat is slightly unfavorable despite growing ROIC, reflecting value destruction but improving profitability trends.
Stock Comparison
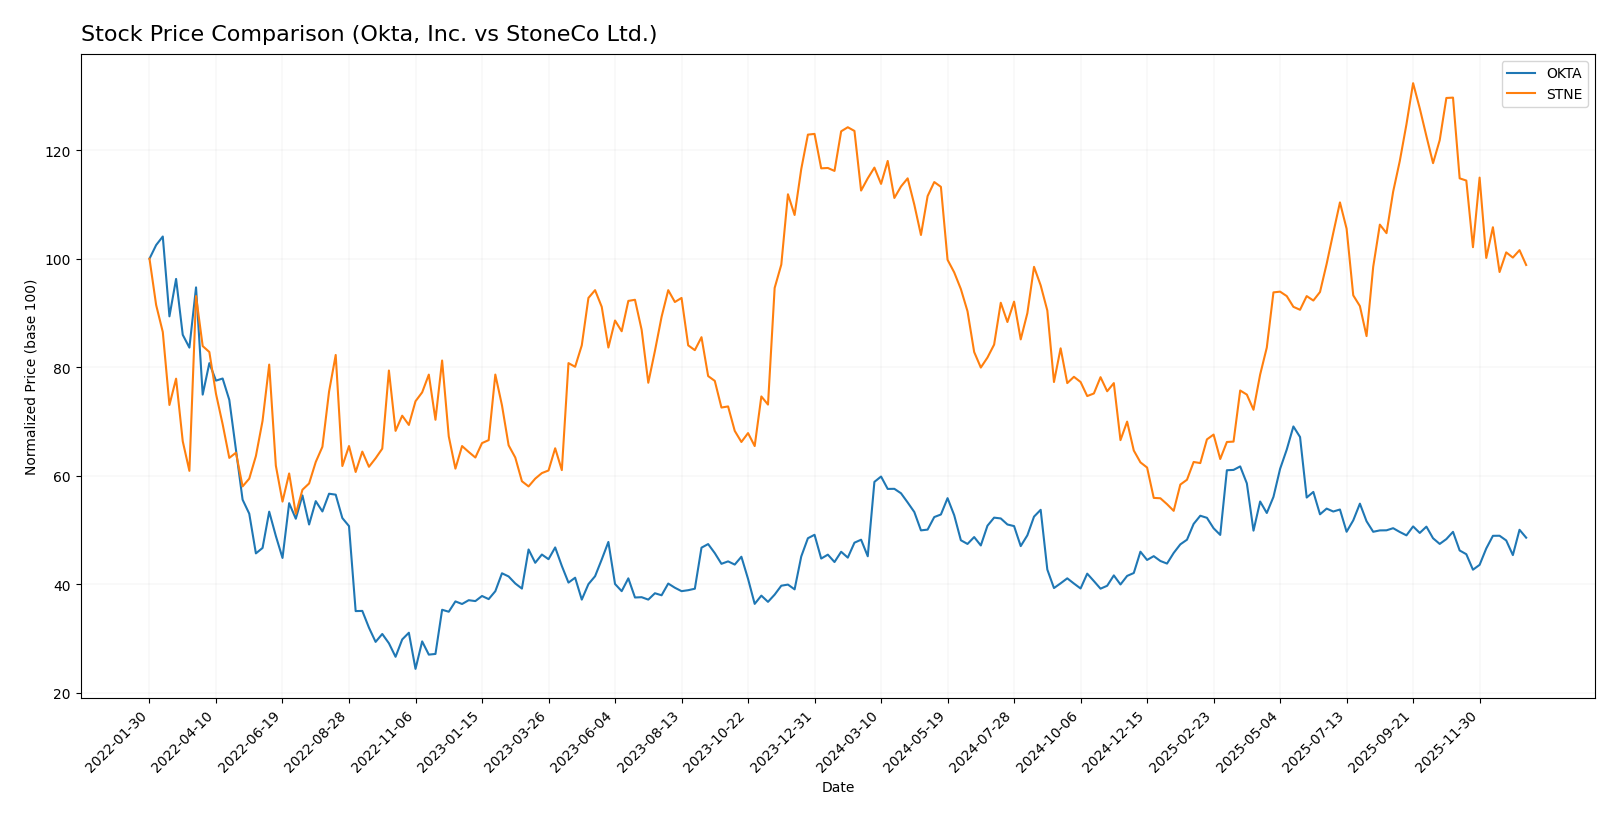
The stock price movements of Okta, Inc. and StoneCo Ltd. over the past year reveal contrasting trends, with Okta showing overall gains amid accelerating momentum, while StoneCo exhibits a sustained decline with deceleration in its downtrend.
Trend Analysis
Okta, Inc. recorded a 7.58% price increase over the past 12 months, indicating a bullish trend with accelerating momentum. The stock reached a high of 127.3 and a low of 72.24, with notable volatility reflected by an 11.38 standard deviation.
StoneCo Ltd. experienced a 13.9% price decrease over the same period, signaling a bearish trend with decelerating downward movement. Its highest price was 19.4 and lowest 7.85, accompanied by lower volatility at a 2.92 standard deviation.
Comparing both stocks, Okta delivered the highest market performance with positive growth, while StoneCo showed significant losses, confirming Okta as the stronger performer over the last year.
Target Prices
Analysts present a clear target price consensus for Okta, Inc. and StoneCo Ltd., reflecting their respective growth expectations.
| Company | Target High | Target Low | Consensus |
|---|---|---|---|
| Okta, Inc. | 140 | 60 | 110.67 |
| StoneCo Ltd. | 20 | 20 | 20 |
Okta’s consensus target price of 110.67 USD is substantially above its current price of 89.55 USD, indicating moderate upside potential. StoneCo’s consensus target of 20 USD also exceeds its current price of 14.49 USD, suggesting room for growth according to analysts.
Analyst Opinions Comparison
This section compares analysts’ ratings and financial scores for Okta, Inc. and StoneCo Ltd.:
Rating Comparison
Okta Rating
- Rating: B, classified as Very Favorable overall.
- Discounted Cash Flow Score: 4, considered Favorable for valuation.
- ROE Score: 2, a Moderate indicator of profit generation efficiency.
- ROA Score: 3, Moderate effectiveness in using assets to generate earnings.
- Debt To Equity Score: 4, Favorable, indicating lower financial risk.
- Overall Score: 3, Moderate overall financial standing.
StoneCo Rating
- Rating: C, also classified as Very Favorable overall.
- Discounted Cash Flow Score: 3, rated Moderate for valuation.
- ROE Score: 1, marked as Very Unfavorable, indicating weak profit generation.
- ROA Score: 1, Very Unfavorable, showing poor asset utilization.
- Debt To Equity Score: 1, Very Unfavorable, suggesting higher financial risk.
- Overall Score: 2, Moderate but lower overall financial standing than Okta.
Which one is the best rated?
Based strictly on the provided data, Okta holds a better rating than StoneCo, with higher scores across discounted cash flow, ROE, ROA, and debt-to-equity metrics, reflecting a stronger overall financial profile.
Scores Comparison
The following table presents a comparison of the Altman Z-Score and Piotroski Score for Okta, Inc. and StoneCo Ltd.:
Okta Scores
- Altman Z-Score: 4.15, indicating a safe zone.
- Piotroski Score: 8, reflecting very strong financial health.
StoneCo Scores
- Altman Z-Score: 1.02, indicating a distress zone.
- Piotroski Score: 5, reflecting average financial strength.
Which company has the best scores?
Based on the provided data, Okta exhibits stronger scores with a safe zone Altman Z-Score and a very strong Piotroski Score. StoneCo’s scores indicate financial distress and average strength, suggesting higher risk comparatively.
Grades Comparison
Here is a detailed comparison of the latest grades assigned to Okta, Inc. and StoneCo Ltd.:
Okta, Inc. Grades
The table below summarizes recent grades assigned to Okta, Inc. by reputable grading firms.
| Grading Company | Action | New Grade | Date |
|---|---|---|---|
| Stephens & Co. | Upgrade | Overweight | 2026-01-14 |
| Piper Sandler | Maintain | Neutral | 2026-01-05 |
| RBC Capital | Maintain | Outperform | 2026-01-05 |
| Jefferies | Upgrade | Buy | 2025-12-16 |
| Needham | Maintain | Buy | 2025-12-12 |
| BTIG | Maintain | Buy | 2025-12-04 |
| Susquehanna | Maintain | Neutral | 2025-12-03 |
| Cantor Fitzgerald | Maintain | Overweight | 2025-12-03 |
| Canaccord Genuity | Maintain | Buy | 2025-12-03 |
| Scotiabank | Maintain | Sector Perform | 2025-12-03 |
Okta shows a strong positive trend, with multiple upgrades and a majority of “Buy” and “Overweight” ratings from respected firms.
StoneCo Ltd. Grades
Below is a summary of StoneCo Ltd.’s recent ratings by established grading companies.
| Grading Company | Action | New Grade | Date |
|---|---|---|---|
| Goldman Sachs | Maintain | Buy | 2025-10-14 |
| B of A Securities | Maintain | Buy | 2025-09-09 |
| UBS | Maintain | Buy | 2025-08-29 |
| JP Morgan | Maintain | Overweight | 2025-07-16 |
| Barclays | Maintain | Equal Weight | 2025-05-12 |
| Barclays | Maintain | Equal Weight | 2025-04-23 |
| Citigroup | Upgrade | Buy | 2025-04-22 |
| Barclays | Maintain | Equal Weight | 2025-03-21 |
| Morgan Stanley | Maintain | Underweight | 2025-03-21 |
| Goldman Sachs | Maintain | Buy | 2025-02-06 |
StoneCo’s ratings maintain a generally positive outlook with several “Buy” grades, but also include multiple “Equal Weight” and one “Underweight,” indicating more mixed sentiment.
Which company has the best grades?
Okta, Inc. has received more consistent and recent upgrades with several “Buy” and “Overweight” ratings, suggesting stronger analyst confidence. StoneCo Ltd. has a more varied grade profile including “Equal Weight” and “Underweight,” which could imply a more cautious stance from analysts and potential volatility for investors.
Strengths and Weaknesses
Below is a comparison of Okta, Inc. and StoneCo Ltd. based on key financial and strategic criteria as of 2026.
| Criterion | Okta, Inc. (OKTA) | StoneCo Ltd. (STNE) |
|---|---|---|
| Diversification | Focused mainly on subscription-based identity services, limited diversification | Primarily focused on digital payment solutions, moderate diversification in financial tech |
| Profitability | Low net margin (1.07%), ROIC negative (-0.61%), shedding value but improving | Negative net margin (-11.89%), high ROIC (22.41%), creating value with strong profitability growth |
| Innovation | Strong technology service growth, increasing subscription revenue | Innovative fintech solutions, with durable competitive advantage and increasing profitability |
| Global presence | Established in North America with growing adoption | Strong presence in Brazil and Latin America, expanding regional footprint |
| Market Share | Leading in identity management, but facing intense competition | Growing market share in digital payments, supported by favorable financial metrics |
Key takeaways: StoneCo demonstrates a very favorable economic moat with strong and growing profitability, while Okta is currently shedding value despite improving ROIC trends. Investors should weigh Okta’s innovation and subscription growth against its profitability challenges, whereas StoneCo offers a more robust value creation profile but with some profitability risks.
Risk Analysis
Below is a comparative risk overview for Okta, Inc. and StoneCo Ltd. based on the latest available data from 2025 and 2024 respectively.
| Metric | Okta, Inc. | StoneCo Ltd. |
|---|---|---|
| Market Risk | Moderate (Beta 0.76) | High (Beta 1.835) |
| Debt level | Low (Debt-to-Equity 0.15) | High (Debt-to-Equity 1.1) |
| Regulatory Risk | Moderate (US and international data privacy laws) | High (Brazilian fintech regulations) |
| Operational Risk | Moderate (Cloud infrastructure and security reliance) | Moderate (Dependence on Brazilian market and payment systems) |
| Environmental Risk | Low (Software sector, limited physical footprint) | Low (Digital payments sector) |
| Geopolitical Risk | Moderate (Global operations, US-based) | High (Based in Cayman Islands, Brazil market exposure) |
The most impactful risks are StoneCo’s high market beta and significant debt load, combined with geopolitical exposure to Brazil’s regulatory environment, which could affect its financial stability. Okta shows stable debt management and a safer Altman Z-score, but faces operational risks tied to cybersecurity and compliance with evolving data privacy rules. Investors should weigh StoneCo’s growth potential against its financial distress signals and Okta’s steadier but less aggressive profile.
Which Stock to Choose?
Okta, Inc. shows a favorable income evolution with strong revenue and net income growth over 2021-2025. Its financial ratios present a balanced profile with 43% favorable and 43% unfavorable metrics, signaling a neutral overall financial health. Profitability remains low but improving, supported by a slightly unfavorable moat rating due to ROIC below WACC despite rising profitability. Debt levels are moderate and well covered, contributing to a very favorable company rating.
StoneCo Ltd. demonstrates favorable revenue growth but faces challenges with negative net margins and declining profitability over 2020-2024. Its financial ratios are slightly favorable overall, with 50% favorable but also significant unfavorable metrics, including high debt-to-equity and weak returns. The company’s moat rating is very favorable thanks to ROIC well above WACC and increasing profitability, although bankruptcy risk is elevated with a low Altman Z-score. Debt remains relatively high, impacting financial stability.
Investors focused on growth may find Okta’s improving income and neutral financial health appealing, while those prioritizing a durable competitive advantage and value creation might view StoneCo’s strong moat and profitability trend as attractive despite its financial risks. The choice could depend on individual risk tolerance and strategy preferences.
Disclaimer: Investment carries a risk of loss of initial capital. The past performance is not a reliable indicator of future results. Be sure to understand risks before making an investment decision.
Go Further
I encourage you to read the complete analyses of Okta, Inc. and StoneCo Ltd. to enhance your investment decisions: