In the fast-evolving technology sector, Okta, Inc. and Rubrik, Inc. stand out as key players in software infrastructure, each driving innovation in identity management and data security, respectively. Both companies operate in overlapping markets focused on enterprise cloud solutions, making their strategies and growth potential highly relevant for investors. This article will analyze their strengths and risks to help you decide which company deserves a place in your investment portfolio.
Table of contents
Companies Overview
I will begin the comparison between Okta and Rubrik by providing an overview of these two companies and their main differences.
Okta Overview
Okta, Inc. focuses on delivering identity solutions to enterprises, SMBs, universities, non-profits, and government agencies both in the US and internationally. Its flagship product, Okta Identity Cloud, integrates various security and access management features, including Single Sign-On and Adaptive Multi-Factor Authentication. Established in 2009 and based in San Francisco, Okta is a key player in software infrastructure with a market cap of about 14.2B USD.
Rubrik Overview
Rubrik, Inc. offers data security solutions encompassing enterprise, cloud, SaaS, and unstructured data protection. The company provides cyber recovery and data threat analytics services to diverse sectors such as financial, healthcare, retail, and public sectors. Founded in 2013 and headquartered in Palo Alto, Rubrik has a market cap near 15.1B USD and recently went public in 2024, emphasizing data security in infrastructure software.
Key similarities and differences
Both Okta and Rubrik operate within the software infrastructure industry and serve enterprise clients, focusing on security solutions. Okta specializes in identity management and access control, while Rubrik concentrates on data protection and cyber recovery. Although both are US-based tech firms with comparable market caps, their core business models address different aspects of cybersecurity, reflecting distinct product offerings and customer needs.
Income Statement Comparison
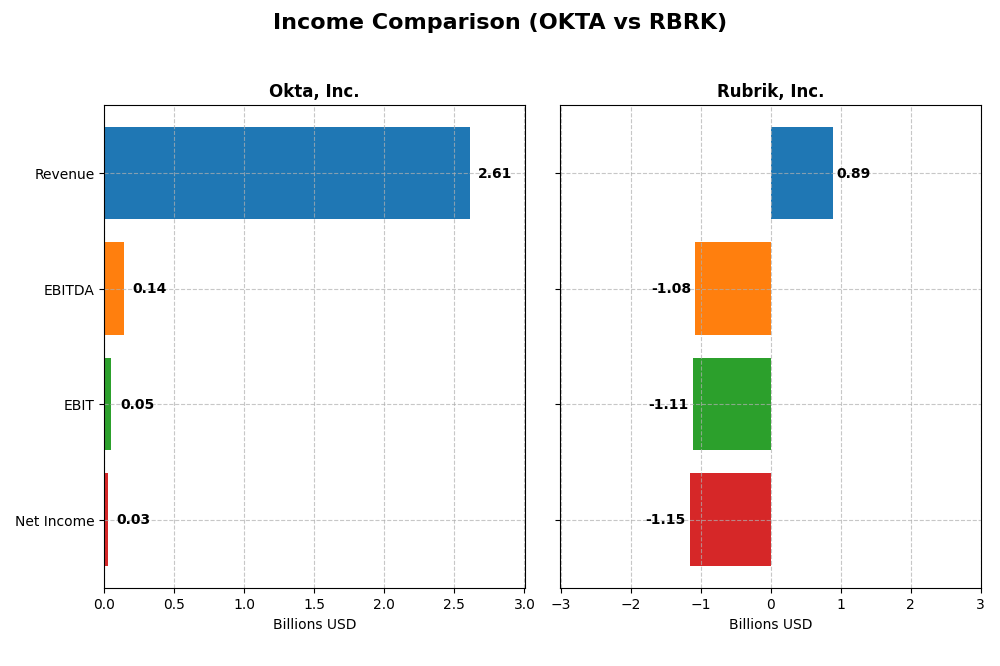
This table compares the most recent full fiscal year income statement figures for Okta, Inc. and Rubrik, Inc., highlighting key metrics for investor analysis.
| Metric | Okta, Inc. (OKTA) | Rubrik, Inc. (RBRK) |
|---|---|---|
| Market Cap | 14.2B | 15.1B |
| Revenue | 2.61B | 887M |
| EBITDA | 139M | -1.08B |
| EBIT | 51M | -1.11B |
| Net Income | 28M | -1.15B |
| EPS | 0.17 | -7.48 |
| Fiscal Year | 2025 | 2025 |
Income Statement Interpretations
Okta, Inc.
Okta’s revenue and net income exhibited strong growth from 2021 to 2025, with revenue increasing by over 200% and net income turning positive in the latest fiscal year. Gross margins remained robust at 76.32%, while EBIT and net margins showed moderate improvement. The 2025 fiscal year marked a significant turnaround with net income reaching $28M and favorable margin expansions.
Rubrik, Inc.
Rubrik’s revenue grew substantially by approximately 129% over the period, yet net income remained deeply negative, with a loss of $1.15B in 2025. Gross margins were solid at 70.02%, but EBIT and net margins were sharply negative, reflecting operational challenges. The latest year revealed a sharp decline in profitability despite strong top-line growth, with worsening EBIT and net margin figures.
Which one has the stronger fundamentals?
Okta shows stronger fundamentals based on a favorable overall income statement evaluation, including solid margin improvements and positive net income growth. In contrast, Rubrik’s unfavorable profitability metrics and persistent net losses offset its revenue gains. Okta’s consistent margin expansion and profitability turnaround position it more favorably in terms of income statement health.
Financial Ratios Comparison
This table presents a side-by-side comparison of key financial ratios for Okta, Inc. and Rubrik, Inc. based on their latest reported fiscal year 2025 data.
| Ratios | Okta, Inc. (OKTA) | Rubrik, Inc. (RBRK) |
|---|---|---|
| ROE | 0.44% | 208.55% |
| ROIC | -0.61% | -236.15% |
| P/E | 570.6 | -9.79 |
| P/B | 2.49 | -20.42 |
| Current Ratio | 1.35 | 1.13 |
| Quick Ratio | 1.35 | 1.13 |
| D/E | 0.15 | -0.63 |
| Debt-to-Assets | 10.09% | 24.65% |
| Interest Coverage | -14.8 | -27.49 |
| Asset Turnover | 0.28 | 0.62 |
| Fixed Asset Turnover | 22.31 | 16.67 |
| Payout ratio | 0 | 0 |
| Dividend yield | 0 | 0 |
Interpretation of the Ratios
Okta, Inc.
Okta’s financial ratios present a mixed picture with 43% favorable and 43% unfavorable indicators. The company shows weak profitability with a net margin of 1.07% and low return on equity at 0.44%, while its price-to-earnings ratio is extremely high at 570.6, signaling overvaluation risks. Okta pays no dividends, consistent with its reinvestment strategy amid ongoing growth and high R&D expenses.
Rubrik, Inc.
Rubrik displays a generally favorable ratio profile, with 57% favorable and 29% unfavorable metrics. Despite a negative net margin of -130.26% and negative return on invested capital, it boasts a strong return on equity of 208.55% and favorable price-to-earnings and price-to-book ratios. Rubrik also does not pay dividends, reflecting its focus on growth and investment in product development.
Which one has the best ratios?
Rubrik holds the advantage with a higher proportion of favorable ratios, including robust returns on equity and attractive valuation multiples. Okta, while maintaining some financial strengths like good interest coverage and low debt, struggles with profitability and valuation concerns. Overall, Rubrik’s ratios suggest a stronger financial profile relative to Okta’s mixed results.
Strategic Positioning
This section compares the strategic positioning of Okta and Rubrik, including Market position, Key segments, and exposure to technological disruption:
Okta, Inc.
- Market leader in identity solutions with moderate competitive pressure and 14B market cap.
- Key segment is subscription and circulation services, generating 2.56B in FY 2025, driven by identity cloud products.
- Exposure to disruption through cloud-based identity and adaptive security technologies.
Rubrik, Inc.
- Provides data security solutions with 15B market cap, facing competitive pressure in data protection.
- Focuses on subscription and other product services in data security, with 828M subscription revenue in FY 2025.
- Faces disruption risks in evolving data security and cyber recovery technologies.
Okta vs Rubrik Positioning
Okta has a more diversified approach focusing on identity across multiple sectors, while Rubrik concentrates on data security for various industries. Okta’s larger subscription revenue contrasts with Rubrik’s narrower segment focus and smaller revenue base.
Which has the best competitive advantage?
Both companies are currently shedding value relative to their cost of capital. Okta shows improving profitability trends, while Rubrik’s profitability is declining, indicating Okta has a slightly stronger competitive moat.
Stock Comparison
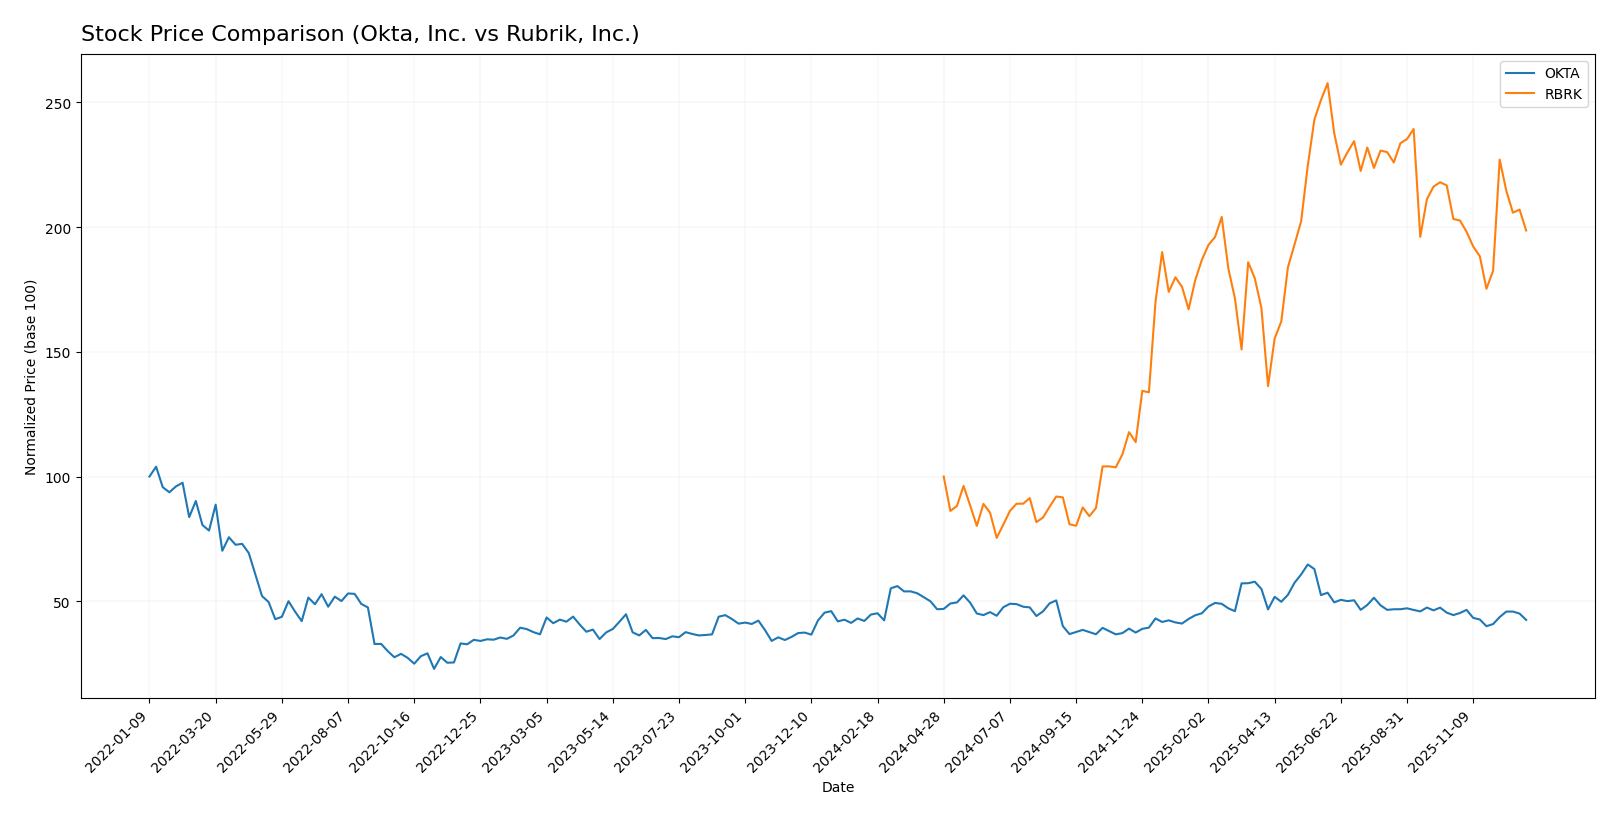
The past year showed contrasting dynamics between Okta, Inc. and Rubrik, Inc., with Okta experiencing a bearish trend marked by a price decline, while Rubrik demonstrated a strong bullish trend despite recent deceleration.
Trend Analysis
Okta, Inc. exhibited a bearish stock trend over the past 12 months with a -4.79% price change and deceleration in the downward movement; the stock ranged between 72.24 and 127.3, showing moderate volatility (std deviation 11.39).
Rubrik, Inc. delivered a bullish trend in the same period with a 98.61% price increase, though its acceleration slowed; price fluctuated between 28.65 and 97.91 with higher volatility (std deviation 21.61).
Comparing both, Rubrik outperformed Okta substantially in market performance over the last year, reflecting strong investor demand despite recent seller dominance in trading volume.
Target Prices
The current analyst consensus presents a promising outlook for both Okta, Inc. and Rubrik, Inc.
| Company | Target High | Target Low | Consensus |
|---|---|---|---|
| Okta, Inc. | 140 | 60 | 110.53 |
| Rubrik, Inc. | 113 | 105 | 109.33 |
Analysts expect Okta’s stock to rise significantly from its current price of $83.64, while Rubrik’s consensus target of $109.33 suggests strong upside potential from its $75.47 price. Both stocks show favorable growth prospects.
Analyst Opinions Comparison
This section compares analysts’ ratings and grades for Okta, Inc. and Rubrik, Inc.:
Rating Comparison
Okta, Inc. Rating
- Rating: B, status very favorable
- Discounted Cash Flow Score: 4, favorable
- ROE Score: 2, moderate
- ROA Score: 3, moderate
- Debt To Equity Score: 3, moderate
- Overall Score: 3, moderate
Rubrik, Inc. Rating
- Rating: C, status very favorable
- Discounted Cash Flow Score: 1, very unfavorable
- ROE Score: 5, very favorable
- ROA Score: 1, very unfavorable
- Debt To Equity Score: 1, very unfavorable
- Overall Score: 2, moderate
Which one is the best rated?
Based strictly on the provided data, Okta holds a higher overall rating (B vs. C) and a better discounted cash flow score, while Rubrik excels in ROE but scores poorly on other financial metrics, resulting in a lower overall score.
Scores Comparison
Here is a comparison of the Altman Z-Score and Piotroski Score for Okta and Rubrik:
Okta Scores
- Altman Z-Score: 3.74, indicating a safe zone with low bankruptcy risk.
- Piotroski Score: 8, categorized as very strong financial health.
Rubrik Scores
- Altman Z-Score: 2.18, indicating a grey zone with moderate bankruptcy risk.
- Piotroski Score: 4, categorized as average financial health.
Which company has the best scores?
Based strictly on the data, Okta shows stronger financial health with a higher Altman Z-Score in the safe zone and a very strong Piotroski Score, while Rubrik’s scores reflect moderate risk and average financial strength.
Grades Comparison
The following presents a comparison of recent grades assigned to Okta, Inc. and Rubrik, Inc.:
Okta, Inc. Grades
This table shows the recent grades and rating actions from recognized grading companies for Okta, Inc.:
| Grading Company | Action | New Grade | Date |
|---|---|---|---|
| Jefferies | Buy | Buy | 2025-12-16 |
| Needham | Maintain | Buy | 2025-12-12 |
| BTIG | Maintain | Buy | 2025-12-04 |
| Guggenheim | Maintain | Buy | 2025-12-03 |
| JP Morgan | Maintain | Overweight | 2025-12-03 |
| BTIG | Maintain | Buy | 2025-12-03 |
| BMO Capital | Maintain | Market Perform | 2025-12-03 |
| Citigroup | Maintain | Neutral | 2025-12-03 |
| Piper Sandler | Maintain | Neutral | 2025-12-03 |
| Susquehanna | Maintain | Neutral | 2025-12-03 |
Okta’s grades predominantly indicate buy or overweight ratings, with some neutral and market perform opinions, showing a generally positive consensus.
Rubrik, Inc. Grades
This table summarizes the recent grades and rating actions from recognized grading companies for Rubrik, Inc.:
| Grading Company | Action | New Grade | Date |
|---|---|---|---|
| Citigroup | Maintain | Buy | 2025-12-08 |
| William Blair | Upgrade | Outperform | 2025-12-05 |
| Keybanc | Maintain | Overweight | 2025-12-05 |
| BMO Capital | Maintain | Outperform | 2025-12-05 |
| Wedbush | Maintain | Outperform | 2025-12-05 |
| Rosenblatt | Maintain | Buy | 2025-12-05 |
| Piper Sandler | Maintain | Overweight | 2025-12-05 |
| Baird | Maintain | Outperform | 2025-12-05 |
| Cantor Fitzgerald | Maintain | Overweight | 2025-12-03 |
| Guggenheim | Maintain | Buy | 2025-12-01 |
Rubrik’s grades mostly reflect buy, outperform, and overweight ratings, with a recent upgrade indicating a positive momentum.
Which company has the best grades?
Rubrik, Inc. has received a stronger set of grades overall, featuring multiple outperform and overweight ratings alongside a recent upgrade. Okta, Inc. also shows mostly buy and overweight ratings but includes more neutral and market perform assessments. Investors may interpret Rubrik’s ratings as slightly more optimistic, potentially signaling higher confidence from analysts.
Strengths and Weaknesses
Below is a comparative overview of the strengths and weaknesses of Okta, Inc. and Rubrik, Inc. based on their recent financial and operational data.
| Criterion | Okta, Inc. | Rubrik, Inc. |
|---|---|---|
| Diversification | Moderate: Mainly subscription-based with some tech services (2.6B USD total revenue, largely subscription) | Limited: Heavy reliance on subscriptions (829M USD) with smaller maintenance and other services |
| Profitability | Low profitability: Slightly unfavorable net margin (1.07%), ROIC negative but improving | Poor profitability: Negative net margin (-130%) and sharply declining ROIC |
| Innovation | Strong innovation indicated by high fixed asset turnover (22.31) and growing ROIC trend | Moderate innovation but declining profitability and negative interest coverage |
| Global presence | Well-established global presence given scale and stable liquidity ratios | Smaller scale and more regional focus, moderate liquidity ratios |
| Market Share | Growing market share in identity management with 2.55B USD subscription revenue | Smaller market share, focused on data management and backup solutions |
Key takeaways: Okta demonstrates stronger revenue growth and improving profitability trends despite current value destruction, reflecting potential for recovery. Rubrik struggles with profitability and value loss, posing higher investment risk despite some favorable financial ratios. Careful risk management is advised.
Risk Analysis
Below is a comparative overview of key risks for Okta, Inc. and Rubrik, Inc. in 2025, helping you gauge potential vulnerabilities.
| Metric | Okta, Inc. | Rubrik, Inc. |
|---|---|---|
| Market Risk | Moderate (Beta 0.78) | Low (Beta 0.28) |
| Debt level | Low (Debt/Equity 0.15) | Moderate (Debt/Equity -0.63*) |
| Regulatory Risk | Moderate | Moderate |
| Operational Risk | Moderate | Moderate |
| Environmental Risk | Low | Low |
| Geopolitical Risk | Moderate | Moderate |
*Note: Rubrik’s negative debt/equity ratio suggests complexities in financial structure or accounting methods.
Okta faces moderate market risk with a beta of 0.78 and maintains low debt levels, but shows unfavorable profitability ratios and a very high P/E ratio, indicating valuation risk. Rubrik shows low market risk but has operational challenges with negative net margin and interest coverage, and its Altman Z-score places it in a grey zone for financial distress. The most impactful risks are Okta’s valuation and profitability concerns, and Rubrik’s financial instability despite its favorable debt profile. Investors should monitor these factors closely for risk management.
Which Stock to Choose?
Okta, Inc. shows favorable income growth with a 15.33% revenue increase in 2025 and strong overall income performance from 2021-2025. Financial ratios are mixed but lean neutral overall, with profitability positive yet modest. Debt levels are low and manageable, supported by a solid current ratio. The company holds a very favorable B rating, indicating moderate financial health and stability.
Rubrik, Inc. experiences strong revenue growth at 41.19% for 2025 but faces unfavorable profitability metrics, including a negative net margin and declining income over the period. Financial ratios are largely favorable, especially ROE, though some leverage and liquidity indicators are weak. The firm is rated very favorable with a C rating but shows signs of financial distress in some operational areas.
For investors, Okta’s favorable income statement and balanced ratios with a stable rating might appeal to those seeking moderate growth with controlled risk. Conversely, Rubrik’s strong growth yet volatile profitability could be of interest to risk-tolerant investors focused on potential turnaround opportunities. The choice may depend on the investor’s appetite for risk versus preference for stability.
Disclaimer: Investment carries a risk of loss of initial capital. The past performance is not a reliable indicator of future results. Be sure to understand risks before making an investment decision.
Go Further
I encourage you to read the complete analyses of Okta, Inc. and Rubrik, Inc. to enhance your investment decisions: