In the fast-evolving world of cybersecurity, Palo Alto Networks, Inc. (PANW) and Okta, Inc. (OKTA) stand out as key players shaping the future of software infrastructure. Both companies address critical security needs—Palo Alto Networks with comprehensive threat prevention and cloud security, Okta with identity and access management solutions. This article will explore their strengths and innovations to help you decide which is the more compelling investment opportunity.

Table of contents
Companies Overview
I will begin the comparison between Palo Alto Networks and Okta by providing an overview of these two companies and their main differences.
Palo Alto Networks Overview
Palo Alto Networks, Inc. specializes in cybersecurity solutions, offering firewall appliances, security management software, and subscription services that cover threat prevention, malware protection, and cloud security. The company serves medium to large enterprises, service providers, and government entities across industries such as financial services, healthcare, and telecommunications. Founded in 2005 and headquartered in Santa Clara, California, it has a market cap of $128B.
Okta Overview
Okta, Inc. provides identity management solutions through its Okta Identity Cloud platform, including single sign-on, adaptive multi-factor authentication, and API access management. The company targets enterprises, SMBs, universities, non-profits, and government agencies globally. Established in 2009 and based in San Francisco, California, Okta has a market cap of $15B and offers customer support, training, and professional services.
Key similarities and differences
Both Palo Alto Networks and Okta operate in the Software – Infrastructure industry, focusing on security but with distinct areas: Palo Alto Networks specializes in network and cloud cybersecurity, while Okta focuses on identity and access management. Each sells through direct and partner channels, but Palo Alto Networks targets larger organizations with a broader security portfolio compared to Okta’s identity-centric solutions. Their market caps and employee counts also reflect Palo Alto’s larger scale.
Income Statement Comparison
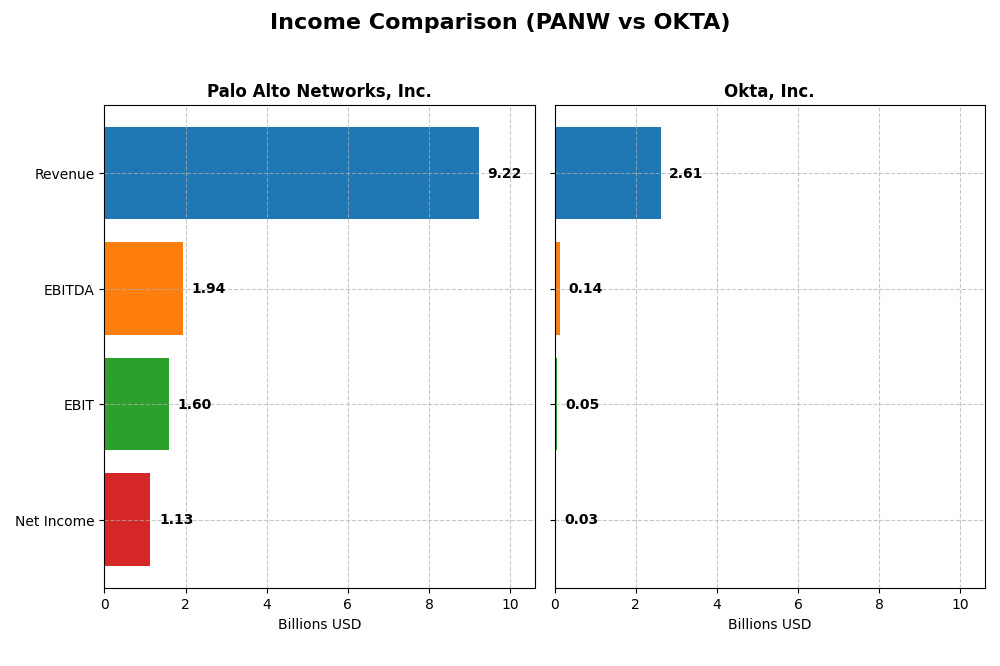
The table below compares the most recent fiscal year income statement figures for Palo Alto Networks, Inc. and Okta, Inc., presenting key metrics in a clear, concise format.
| Metric | Palo Alto Networks, Inc. | Okta, Inc. |
|---|---|---|
| Market Cap | 128.4B | 15.2B |
| Revenue | 9.22B | 2.61B |
| EBITDA | 1.94B | 139M |
| EBIT | 1.60B | 51M |
| Net Income | 1.13B | 28M |
| EPS | 1.71 | 0.17 |
| Fiscal Year | 2025 | 2025 |
Income Statement Interpretations
Palo Alto Networks, Inc.
Palo Alto Networks showed strong revenue growth from $4.26B in 2021 to $9.22B in 2025, with net income rebounding from a loss in 2021 to $1.13B in 2025. Gross and EBIT margins remained favorable, around 73% and 17% respectively. However, net margin declined sharply in 2025 despite overall positive trends, indicating some pressure on profitability.
Okta, Inc.
Okta’s revenue increased substantially from $835M in 2021 to $2.61B in 2025, with net income turning positive in 2025 at $28M after years of losses. Gross margin was favorable at 76%, but EBIT and net margins were modest and neutral at 1.95% and 1.07%. The company experienced strong growth in earnings and margins in the latest year, signaling improving fundamentals.
Which one has the stronger fundamentals?
Both companies demonstrate favorable income statement growth and margins, with Palo Alto Networks exhibiting higher absolute revenue and net income and stronger EBIT margin. Okta shows impressive proportional growth and margin improvement but remains at lower profit levels. Palo Alto’s slight net margin decline in 2025 contrasts with Okta’s positive turnaround, presenting a nuanced comparison of fundamentals.
Financial Ratios Comparison
The following table presents a side-by-side comparison of key financial ratios for Palo Alto Networks, Inc. and Okta, Inc. based on their most recent fiscal year data available.
| Ratios | Palo Alto Networks, Inc. (2025) | Okta, Inc. (2025) |
|---|---|---|
| ROE | 14.5% | 0.4% |
| ROIC | 5.7% | -0.6% |
| P/E | 101.4 | 570.6 |
| P/B | 14.7 | 2.5 |
| Current Ratio | 0.89 | 1.35 |
| Quick Ratio | 0.89 | 1.35 |
| D/E | 0.04 | 0.15 |
| Debt-to-Assets | 1.4% | 10.1% |
| Interest Coverage | 414.3 | -14.8 |
| Asset Turnover | 0.39 | 0.28 |
| Fixed Asset Turnover | 12.6 | 22.3 |
| Payout ratio | 0 | 0 |
| Dividend yield | 0 | 0 |
Interpretation of the Ratios
Palo Alto Networks, Inc.
Palo Alto Networks shows a mixed ratio profile with favorable net margin (12.3%) and strong interest coverage (532.53), but weaknesses in price multiples (PE 101.43, PB 14.7) and current ratio (0.89). Debt levels are low with favorable debt-to-equity and debt-to-assets ratios. The company does not pay dividends, likely reflecting a growth and reinvestment focus.
Okta, Inc.
Okta’s ratios reveal challenges, including low net margin (1.07%), ROE (0.44%), and negative ROIC (-0.61%), offset by a favorable WACC (7.18%) and solid liquidity (current ratio 1.35). Debt metrics are also favorable. Okta does not pay dividends, consistent with its investment in growth and R&D priorities during this phase.
Which one has the best ratios?
Palo Alto Networks has a slightly favorable overall ratio assessment, with strong profitability and solvency metrics despite high valuation multiples. Okta’s ratios are more neutral, hindered by low profitability and returns despite good liquidity and debt positions. Based on these evaluations, Palo Alto Networks exhibits a stronger financial ratio profile.
Strategic Positioning
This section compares the strategic positioning of Palo Alto Networks, Inc. and Okta, Inc., focusing on market position, key segments, and exposure to technological disruption:
Palo Alto Networks, Inc.
- Leading cybersecurity provider with significant market cap and moderate competitive pressure.
- Key segments include firewall appliances, subscription services, and support, driving revenue growth.
- Exposure includes cloud security, IoT security, and threat intelligence innovations.
Okta, Inc.
- Identity solutions provider with smaller market cap and similar competitive pressure.
- Focuses on identity cloud platform with subscription and technology services as main drivers.
- Exposure centers on adaptive multi-factor authentication and passwordless login technologies.
Palo Alto Networks, Inc. vs Okta, Inc. Positioning
Palo Alto Networks shows a diversified portfolio with products, subscriptions, and support, while Okta concentrates on identity management solutions. Palo Alto’s broader cybersecurity scope contrasts with Okta’s focused identity cloud platform, reflecting differing strategic breadths and market approaches.
Which has the best competitive advantage?
Both companies show slightly unfavorable moat evaluations, shedding value but with growing ROIC trends. Palo Alto Networks’ less negative ROIC gap suggests a marginally stronger competitive advantage relative to Okta’s deeper value destruction.
Stock Comparison
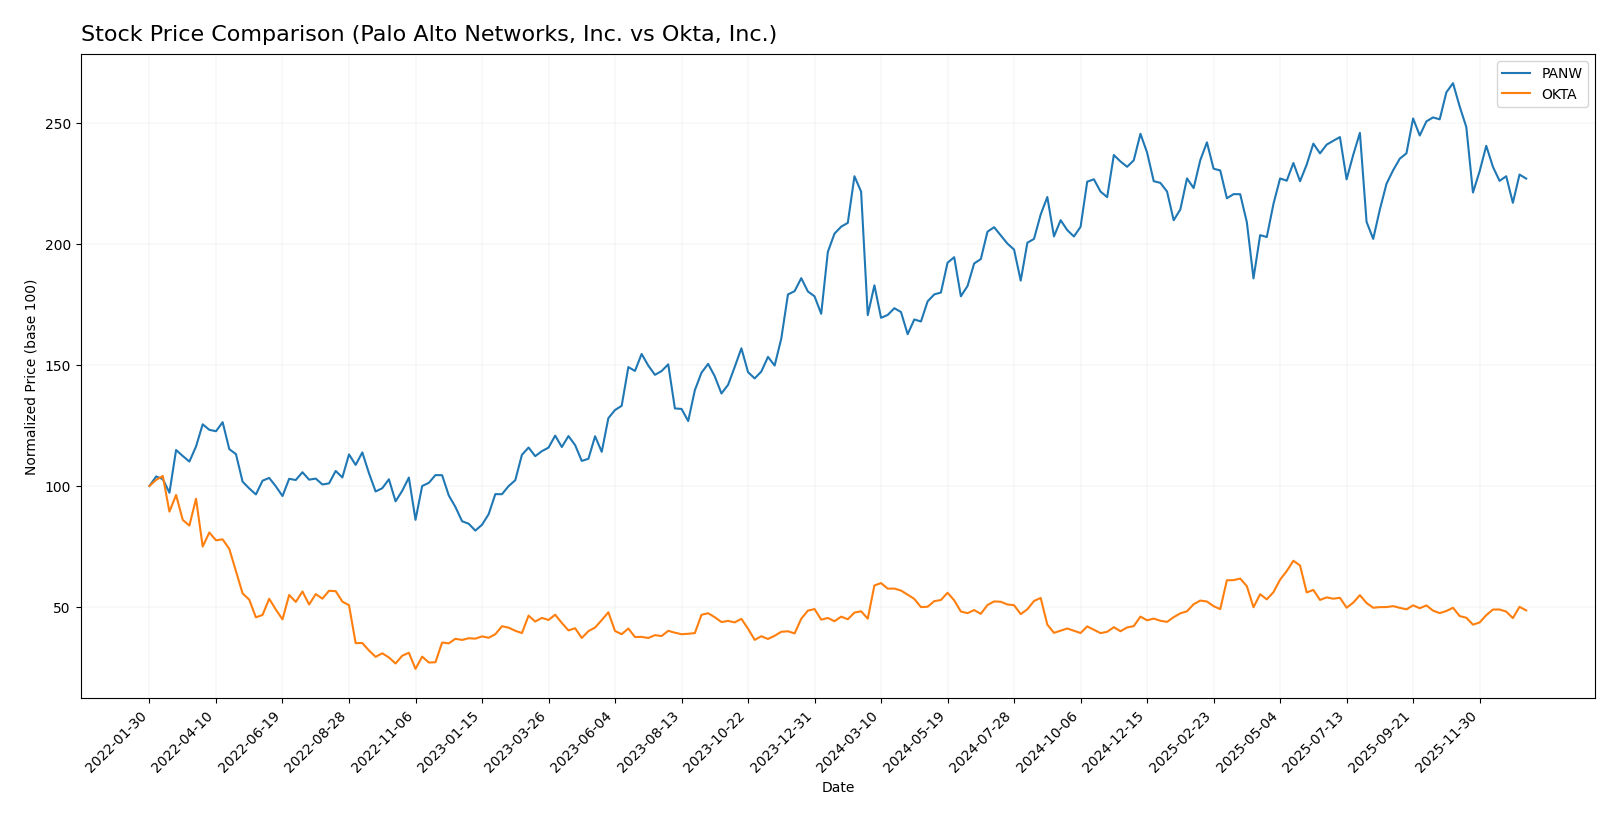
The stock price movements of Palo Alto Networks, Inc. and Okta, Inc. over the past 12 months reveal distinct bullish trends with varying momentum and recent trading dynamics.
Trend Analysis
Palo Alto Networks, Inc. exhibited a bullish trend with a 33.05% price increase over the past year, though the trend shows deceleration and notable volatility with a 19.95 std deviation. The stock reached a high of 220.24 and a low of 134.51.
Okta, Inc. also followed a bullish trajectory with a 7.58% rise in the same period, accompanied by accelerating momentum and lower volatility at an 11.38 std deviation. Its price fluctuated between 72.24 and 127.3.
Comparing both stocks, Palo Alto Networks delivered stronger market performance with a significantly higher price increase, despite recent downward pressure, while Okta maintained steady growth with increasing buyer dominance.
Target Prices
Analysts present a clear consensus on the target prices for Palo Alto Networks, Inc. and Okta, Inc.
| Company | Target High | Target Low | Consensus |
|---|---|---|---|
| Palo Alto Networks, Inc. | 265 | 157 | 231.07 |
| Okta, Inc. | 140 | 60 | 110.67 |
The target consensus for Palo Alto Networks is significantly above its current price of $187.66, indicating potential upside. Okta’s consensus target is also above its current price of $89.55, suggesting positive growth expectations from analysts.
Analyst Opinions Comparison
This section compares analysts’ ratings and grades for Palo Alto Networks, Inc. and Okta, Inc.:
Rating Comparison
PANW Rating
- Rating: B, considered very favorable by analysts.
- Discounted Cash Flow Score: 4, indicating favorable valuation based on cash flow.
- ROE Score: 4, showing efficient profit generation from equity.
- ROA Score: 3, moderate effectiveness in asset utilization.
- Debt To Equity Score: 4, favorable financial stability with low debt reliance.
- Overall Score: 3, representing a moderate overall financial standing.
OKTA Rating
- Rating: B, also rated very favorable by analysts.
- Discounted Cash Flow Score: 4, similarly favorable valuation based on cash flow.
- ROE Score: 2, moderate efficiency in generating profit from equity.
- ROA Score: 3, moderate effectiveness in asset utilization.
- Debt To Equity Score: 4, also favorable financial stability with low debt.
- Overall Score: 3, also representing a moderate overall financial standing.
Which one is the best rated?
Both Palo Alto Networks and Okta share the same overall rating of B and an overall score of 3. However, Palo Alto Networks scores higher on return on equity, indicating more efficient profit generation, while other scores are comparable.
Scores Comparison
Here is a comparison of the Altman Z-Score and Piotroski Score for Palo Alto Networks, Inc. and Okta, Inc.:
Palo Alto Networks Scores
- Altman Z-Score of 5.95, placing it in the safe zone.
- Piotroski Score of 6, indicating average financial strength.
Okta Scores
- Altman Z-Score of 4.15, also in the safe zone.
- Piotroski Score of 8, indicating very strong financial strength.
Which company has the best scores?
Okta has a lower Altman Z-Score than Palo Alto Networks but both are in the safe zone. Okta’s Piotroski Score is higher, indicating stronger financial health compared to Palo Alto Networks.
Grades Comparison
Here is a detailed comparison of the latest reliable grades assigned to Palo Alto Networks, Inc. and Okta, Inc.:
Palo Alto Networks, Inc. Grades
The following table summarizes recent grades from reputable grading companies for Palo Alto Networks:
| Grading Company | Action | New Grade | Date |
|---|---|---|---|
| UBS | Maintain | Neutral | 2026-01-13 |
| Piper Sandler | Maintain | Overweight | 2026-01-05 |
| Guggenheim | Upgrade | Neutral | 2026-01-05 |
| Morgan Stanley | Maintain | Overweight | 2025-12-18 |
| Goldman Sachs | Maintain | Buy | 2025-11-21 |
| HSBC | Downgrade | Reduce | 2025-11-21 |
| Needham | Maintain | Buy | 2025-11-20 |
| WestPark Capital | Maintain | Hold | 2025-11-20 |
| Bernstein | Maintain | Outperform | 2025-11-20 |
| DA Davidson | Maintain | Buy | 2025-11-20 |
Palo Alto Networks exhibits a generally positive rating trend with multiple Buy and Overweight grades, though there is one notable downgrade to Reduce by HSBC.
Okta, Inc. Grades
Below is a summary of recent grades from recognized grading firms for Okta:
| Grading Company | Action | New Grade | Date |
|---|---|---|---|
| Stephens & Co. | Upgrade | Overweight | 2026-01-14 |
| Piper Sandler | Maintain | Neutral | 2026-01-05 |
| RBC Capital | Maintain | Outperform | 2026-01-05 |
| Jefferies | Upgrade | Buy | 2025-12-16 |
| Needham | Maintain | Buy | 2025-12-12 |
| BTIG | Maintain | Buy | 2025-12-04 |
| Susquehanna | Maintain | Neutral | 2025-12-03 |
| Cantor Fitzgerald | Maintain | Overweight | 2025-12-03 |
| Canaccord Genuity | Maintain | Buy | 2025-12-03 |
| Scotiabank | Maintain | Sector Perform | 2025-12-03 |
Okta shows a strong upgrade momentum with multiple Buy and Overweight grades and a recent upgrade to Overweight by Stephens & Co.
Which company has the best grades?
Both Palo Alto Networks and Okta have a consensus “Buy” rating, but Okta displays a stronger recent upgrade momentum with more consistent Buy and Overweight grades. This may indicate differing investor sentiment and potential risk profiles impacting portfolio decisions.
Strengths and Weaknesses
Below is a comparative table highlighting the key strengths and weaknesses of Palo Alto Networks, Inc. (PANW) and Okta, Inc. (OKTA) based on the most recent financial and operational data from 2025.
| Criterion | Palo Alto Networks, Inc. (PANW) | Okta, Inc. (OKTA) |
|---|---|---|
| Diversification | Strong revenue mix: $1.8B Products, $4.97B Subscriptions, $2.45B Support | Primarily subscription model: $2.56B Subscription, minimal Technology Services $54M |
| Profitability | Net margin 12.3% (favorable), ROIC 5.67% (neutral), but ROIC < WACC, slightly unfavorable economic moat | Net margin 1.07% (unfavorable), negative ROIC (-0.61%), ROIC < WACC, economic moat slightly unfavorable |
| Innovation | Consistent growth in ROIC (224.5% increase), strong fixed asset turnover (12.56), indicating efficient asset use and innovation | Growing ROIC trend (92% increase) but still negative; very high PE (570.6) suggests high growth expectations but risk |
| Global presence | Large and diversified revenue base with strong subscription growth over years | Subscription growth strong but more concentrated; lower revenue scale compared to PANW |
| Market Share | Significant market presence with diversified product lines and support services | Niche player focused on identity management with growing but smaller market share |
Key takeaways: Both companies show growing profitability trends but are still shedding value in 2025. PANW offers a more diversified and stable revenue base with better profitability metrics, while OKTA is more growth-oriented but riskier with weaker margins and a higher valuation multiple. Investors should weigh stability against growth potential carefully.
Risk Analysis
The table below summarizes key risk factors for Palo Alto Networks, Inc. (PANW) and Okta, Inc. (OKTA) based on their latest financial and operational data from 2025.
| Metric | Palo Alto Networks, Inc. (PANW) | Okta, Inc. (OKTA) |
|---|---|---|
| Market Risk | Moderate beta (0.75), high P/E (101.43) indicating valuation sensitivity | Moderate beta (0.76), very high P/E (570.6) signaling high valuation risk |
| Debt level | Very low debt-to-equity (0.04), strong interest coverage (532.53) | Low debt-to-equity (0.15), good interest coverage (10.2) |
| Regulatory Risk | Moderate, cybersecurity sector faces evolving compliance demands | Moderate, identity management sector subject to data privacy regulations |
| Operational Risk | Slightly unfavorable asset turnover (0.39), but strong fixed asset turnover | Unfavorable asset turnover (0.28), strong fixed asset turnover |
| Environmental Risk | Low direct impact, but increasing client demand for sustainability | Low direct impact, focus on cloud identity solutions reduces footprint |
| Geopolitical Risk | US-based with global clients, exposure to international market volatility | US-based with international exposure, potential risks from geopolitical tensions |
In synthesis, valuation and market risk are the most impactful for both companies due to their high P/E ratios, reflecting investor expectations and market volatility. Palo Alto Networks shows stronger financial stability with very low debt and excellent interest coverage, reducing bankruptcy risk. Okta has a higher Piotroski score indicating strong financial health but carries more operational and valuation risk. Regulatory changes in cybersecurity and data privacy remain important to monitor closely.
Which Stock to Choose?
Palo Alto Networks, Inc. (PANW) shows strong income growth with a 14.87% revenue increase in 2025 and favorable margins. Its financial ratios are slightly favorable overall, supported by low debt and excellent interest coverage, though valuation multiples appear high. The company has a growing profitability trend but is currently shedding value according to its ROIC vs. WACC analysis. It holds a very favorable rating with a moderate overall score and a safe Altman Z-Score.
Okta, Inc. (OKTA) presents favorable income growth with a 15.33% revenue rise in 2025 and solid gross margins, though profitability ratios remain mostly unfavorable or neutral. Its financial ratios are assessed as neutral overall, with moderate debt levels and good liquidity. The company is also shedding value but with improving profitability. Ratings are very favorable, complemented by a safe zone Altman Z-Score and a strong Piotroski score.
Investors focused on growth and strong income statement momentum might find Palo Alto Networks more aligned with their profile, while those valuing financial strength and higher Piotroski scores could see Okta as more fitting. The slightly favorable financial ratios of PANW contrast with OKTA’s neutral stance, suggesting the choice depends on risk tolerance and strategy preferences.
Disclaimer: Investment carries a risk of loss of initial capital. The past performance is not a reliable indicator of future results. Be sure to understand risks before making an investment decision.
Go Further
I encourage you to read the complete analyses of Palo Alto Networks, Inc. and Okta, Inc. to enhance your investment decisions: